

Key takeaways
Cotality’s national Home Value Index (HVI) rose 0.7% in August, the strongest month on month gain since May last year.
The result pushed the annual change higher for the second month in a row, to 4.1%.
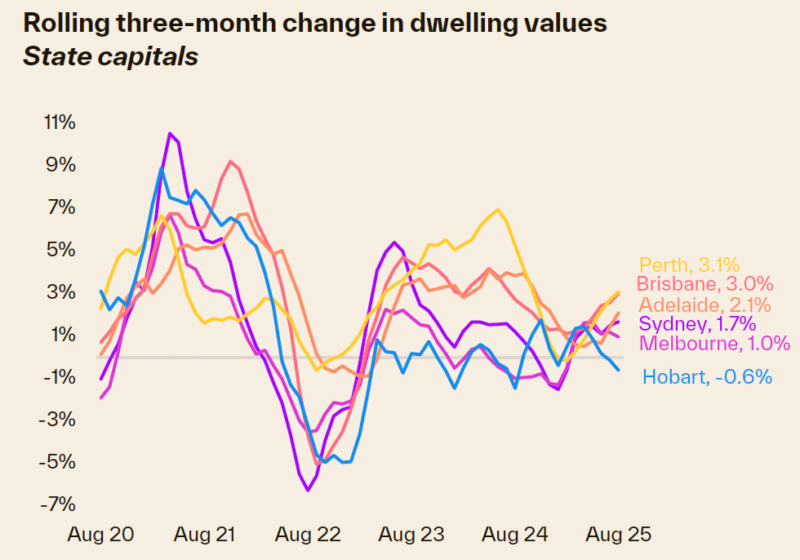
The mid-sized capitals are once again leading the growth trend, with Brisbane (+1.2%) and Perth (+1.1%) recording the highest monthly gains. Adelaide wasn’t far behind with a 0.9% lift in values.
The median house price in Australia’s combined capital cities is now $1,056,440.
The median unit price in Australia’s capital cities is $711,370
The median dwelling value in Australia’s combined regional areas is $693,859
But of course, there are markets within markets, so we detail the median prices for each capital city in this article.
Want to know what’s really happening with property prices right now?
Every month, investors, homeowners, and would-be buyers turn to the latest median property price data, hoping to make sense of what’s happening in our housing markets.
And while the numbers give us important clues, they don’t tell the full story.
Australia’s property markets are being pulled in different directions.
On the one hand, there is continued demand driven by strong population growth, tight rental markets, and a chronic undersupply of new homes.
On the other hand, still relatively high interest rates, borrowing constraints, and affordability challenges are keeping some buyers on the sidelines.
That’s why it’s never been more important to look beyond the headlines.
In this update, I’ll break down what’s really going on behind the median price figures in each of our major capital cities.

Remember—there’s not one “Australian property market,” but many sub-markets moving at different speeds.
So, let’s cut through the noise and look at what’s really happening on the ground.
Cotality’s national Home Value Index (HVI) rose 0.7% in August, the strongest month on month gain since May last year.
The result pushed the annual change higher for the second month in a row, to 4.1%.
The mid-sized capitals are once again leading the growth trend, with Brisbane (+1.2%) and Perth (+1.1%) recording the highest monthly gains. Adelaide wasn’t far behind with a 0.9% lift in values.
Darwin has also recorded a solid gain, with a 1.0% rise in August, taking values 10.8% higher through the first eight months of the year, by far the highest year-to-date gain across the capital cities.
It seems that investors are willing to look through the volatile history of Darwin housing trends, with investors attracted to the low price points and high yields. Lending to this segment has more than doubled over the past year.
Additionally, listings are extraordinarily low, down about 50% on the five-year average.
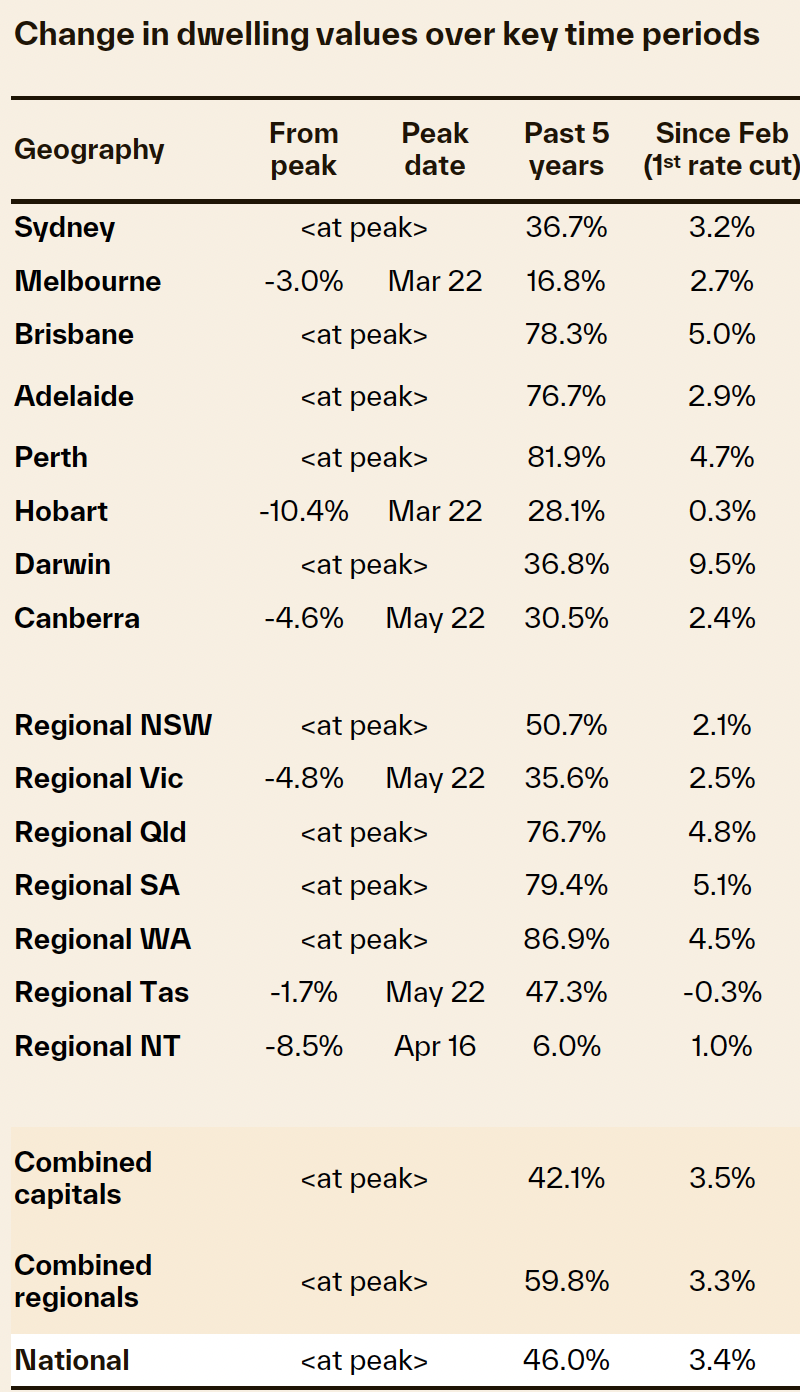
Change in dwelling values around Australia
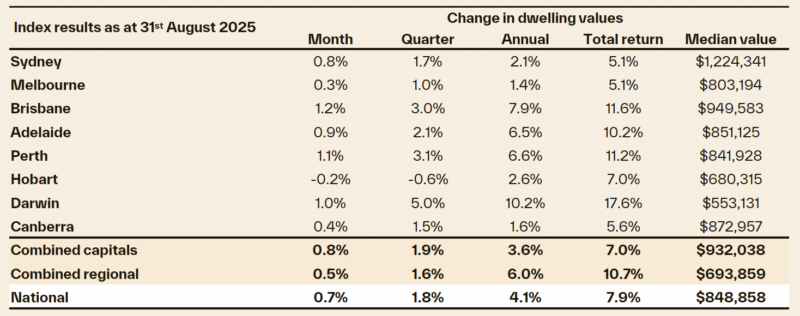
Source: Cotality 1st September 2025
- The median dwelling price for Australia now sits at $848,858
- The median dwelling price for our combined capital cities now sits at $932,038
- The median dwelling price for our combined regional towns sits at $693,859
Be careful how you interpret this data!

Note: The media keeps telling us that Perth, Brisbane and Adelaide have overtaken Melbourne in median values, but this is misleading.
They are quoting the "dwelling prices", but as you can see from the table below, Melbourne has double the number of units (apartments) relative to houses when compared to these other capitals and this obviously skews the median ‘all dwellings’ values.
Percentage of Units in the Market
| City / Region | % units |
|---|---|
| Greater Sydney | 39.3% |
| Greater Darwin | 36.4% |
| ACT | 33.8% |
| Greater Melbourne | 33.0% |
| Greater Brisbane | 25.3% |
| Greater Hobart | 18.3% |
| Greater Adelaide | 16.3% |
| Greater Perth | 15.8% |
| Regional NT | 25.8% |
| Regional Qld | 25.0% |
| Regional NSW | 14.8% |
| Regional Vic. | 11.2% |
| Regional Tas. | 10.5% |
| Regional WA | 7.9% |
| Regional SA | 5.8% |
| Combined capitals | 30.0% |
| Combined regionals | 16.4% |
| National | 25.5% |
Source: CoreLogic
Current Australian house price trends
The following chart clearly shows that there is not "one property market" around Australia.
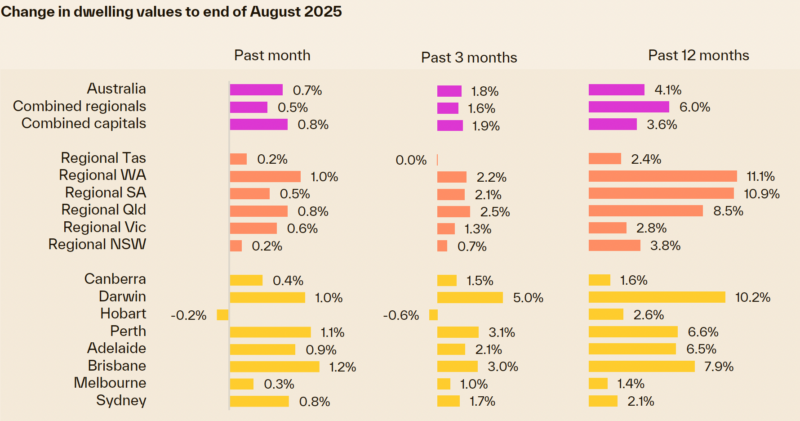
We are now through the winter selling season, and almost "boomtime" auction clearance results we have experienced over the last few months suggest that the Spring property market is going to deliver further price growth around Australia.
What you need to know about median house prices
I’ve written a detailed article explaining why not to trust median property prices here.
However, understanding median house prices can be useful because they give investors a rough guide about the locations they can afford.
Yet they should never be considered to be the Holy Grail of property data, because of the tendency for median prices to jump around from quarter to quarter as they are more a reflection of the properties recently sold rather than what a particular property is worth.
In many locations understanding the median house price is almost worthless because of the variations of the great variation in sale prices for houses, which means the area does not have a homogeneous style of housing.
For example, you could get a significant variation in property value for similar properties when you compare the more desirable locations within a particular suburb, such as a property having water views with ones that are less desirable such as on a busy road or even on a secondary main road or too near the train or with views of the service station across the street.
As you can see, if a suburb has housing of variable quality, the median house price is not very useful because some properties are simply more valuable than others.
However, if a suburb has very similar housing, such as renovated older homes on large blocks or a newer suburb where most of its housing stock was built over a few years, the median house price would be more relevant.
Melbourne's median property price
Here is the latest data on the median property prices for Melbourne.
| Property | Median price | Δ MoM | Δ QoQ | Δ Annual |
|---|---|---|---|---|
| All dwellings | $803,194 | 0.3% | 1.0% | 1.4% |
| Capital city houses | $956,305 | 0.4% | 1.3% | 2.1% |
| Capital city units | $622,939 | 0.2% | 0.2% | -0.4% |
| Regional dwellings | $595,399 | 0.6% | 1.3% | 2.8% |
Source: Cotality, 1st September 2025
Melbourne property values have risen 16.8% over the past 5 years, and 3.5% since the first rate cut in February, but are still -3% below their peak of March 2022, despite having risen 0.3% in August.
Melbourne buyers have consistently enjoyed more choice relative to other markets, and construction rates relative to population growth in Victoria have been somewhat balanced compared to other parts of the country where we are not building enough dwellings.
At the same time the Victorian government has created uncertainty amongst the investors and business people, and local economics is a major factor in the health of a property market.
The result is that the Melbourne housing market has not performed as strongly as most other capitals over the last couple of years.
However, the Melbourne market has turned the corner with 6 months of growth but there is currently still a window of opportunity for strategic property investors as Melbourne property values still have significant upside potential.
The average price of a Melbourne standalone house is the lowest it has been against its Sydney equivalent in around twenty years.
Why the underperformance of the Melbourne market?
Partly it might reflect the greater stock of housing available for sale in the Melbourne market relative to other states.
Also, investor demand has also been lower in Melbourne dues to discontent with the way the Victorian government is treating investors and favouring tenants.
Also, one of the biggest short term influences on the property market performance is each city’s economy, and there is no doubt that there is plenty of negative sentiments about how the Victorian government is handling its economy.
However the Melbourne housing markets are fragmented and not surprisingly, there is currently a flight to quality properties in Melbourne, with A-grade homes and "investment grade" properties still in short supply for the prevailing demand, but B Grade properties are taking longer to sell and informed buyers are avoiding C Grade properties.
More recently improving affordability and the interest rate cut seems to have boosted Melbourne buyer a confidence creating renewed demand and subsequent price growth.
Moving forward strong immigration and a lack of supply of properties will help keep pushing Melbourne property prices higher.
Melbourne's auction results show the market depth experienced over the last few months with virtually "boom time" results, with multiple buyers vying for good properties.
Sydney's median property price
Here is the latest data on the median property prices for Sydney.
| Property | Median price | Δ MoM | Δ QoQ | Δ Annual |
|---|---|---|---|---|
| All Capital city dwellings | $1,224,341 | 0.8% | 1.7% | 2.1% |
| Capital city houses | $1,521,611 | 0.9% | 2.0% | 2.9% |
| Capital city units | $873,838 | 0.6% | 0.9% | 0.0% |
| Regional dwellings | $774,168 | 0.2% | 0.7% | 3.8% |
Source: Cotality, 1st September 2025
The pace of Sydney property price growth has slowed significantly at the end of last year, but market sentiment has improved now that interest rates have moved lower and Sydney price are rising strongly again.
Sydney house prices have risen 16.8% over the past 5 years and are currently at new peaks.
Moving forward, the various sectors of the Sydney property markets will be fragmented.
Buyer confidence has returned and those who have delayed purchases due to sustained high interest rates are re-entering the market leading to strong Sydney auction clearance rates reflecting strong depth of buyer sentiment and this is now reflecting in higher prices.
Brisbane's median property price
Here is the latest data on the median property prices for Brisbane.
| Property | Median price | Δ MoM | Δ QoQ | Δ Annual |
|---|---|---|---|---|
| All Capital city dwellings | $949,583 | 1.2% | 3.0% | 7.9% |
| Capital city houses | $1,040,651 | 1.2% | 2.9% | 7.3% |
| Capital city units | $740,992 | 1.3% | 3.9% | 11.1% |
| Regional dwellings | $752,533 | 0.8% | 2.5% | 8.5% |
Source: Cotality, 1st September 2025
Brisbane's housing market skyrocketed over the past 5 years with 78.3% trough to peak growth, and is currently at a new peak in price.
Brisbane has remained one of the strongest-performing markets over the few past years and our on-the-ground experience at Metropole Brisbane shows that there is still strong demand from both home buyers and property investors for A-grade homes and investment-grade properties, even though the rate of price increases is moderating.
Supply is struggling to keep up with the rising demand, further supporting rising home values as well as apartment prices.
Brisbane has never been a city that held many auctions, however, as you can see from the chart below, the Brisbane auction market results have picked up over the year.
Adelaide's median property price
Here is the latest data on the median property prices for Adelaide.
| Property | Median price Δ | MoM Δ | QoQ Δ | Annual Δ |
|---|---|---|---|---|
| All Capital city dwellings | $851,125 | 0.9% | 2.1% | 6.5% |
| Capital city houses | $906,620 | 0.9% | 2.1% | 6.4% |
| Capital city units | $620,421 | 1.1% | 2.0% | 7.7% |
| Regional dwellings | $494,357 | 0.5% | 2.1% | 10.9% |
Source: Cotality, 1st September 2025
The Adelaide property market was one of the country's top performing markets and after stalling a little at the beginning of this year, Adelaide property values are increasing again, bringing prices to a record high.
The comparative affordability of the city’s homes saw prices defy the period of rising interest rates, but this affordability gap is now disappearing.
Cotality data shows Adelaide values recorded a 5-year "trough to peak" growth of 76.7 per cent.
Like in most capital cities, low stock levels are also helping to insulate home values, with increased competition among potential buyers
The strong Adelaide auction clearance rates are an indication of the depth of the Adelaide property market and while they are a little lower this year than last, the depth of buyer demand has kept Adelaide auction clearance rates high.
Perth's median property price
Here is the latest data on the median property prices for Perth.
| Property | Median price Δ | Δ MoM | Δ QoQ | Δ Annual |
|---|---|---|---|---|
| All Capital city dwellings | $841,928 | 1.1% | 3.1% | 6.6% |
| Capital city houses | $881,867 | 1.1% | 3.1% | 6.3% |
| Capital city units | $624,821 | 1.0% | 3.0% | 10.0% |
| Regional dwellings | $595,356 | 1.0% | 2.2% | 11.1% |
Source: Cotality, 1st Se[tember 2025
Perth’s housing market continues to stand out nationally remaining the strongest market in the country for monthly and annual home price growth.
But remember...Perth housing values remained flat for most of the last decade, and over the last couple of years house and unit values in Perth enjoyed their most significant increases and are currently at a new peak.
The relative affordability of the city’s homes, population growth, and very tight rental markets are also supporting home values.
However, I would be very careful investing in Perth for a number of reasons:
- Currently East Coast property buyers are pushing up Perth property values, buying properties site unseen and paying prices well above market price. This means the investor has to overpay, they will regret down the track.
Our contacts on the ground in Perth advise us that East Coast buyers' agents (NOT Metropole) are paying what they call "silly prices" significantly above what locals would pay, because properties are still relatively cheap in Perth. And they are buying these properties, site, unseen, creating significant risks for their clients. - The Western Australian economy is not as diverse as the other capital cities. While Perth is not a mining town, it is too dependent on a couple of industries – especially the mining industry which accounts for around 45% of the economic output and much of this is dependent on China, and this has a direct knock-on effect on WA house prices.
The mining and energy companies are large employers in Perth. This means that the Perth property market is susceptible to a downturn in mining.
Apart from the large energy companies, most corporate head offices are located in the eastern capital cities. Management roles in head offices tend to attract higher salaries which, to some extent, support/underpin property prices. - Further, the larger east coast capital cities have significantly larger the population with more diverse the employment opportunities which in general attract higher salaries.

Hobart's median property price
Here is the latest data on the median property prices for Hobart.
| Property | Median price | Δ MoM | Δ QoQ | Δ Annual |
|---|---|---|---|---|
| All Capital city dwellings | $680,315 | -0.2% | -0.6% | 2.6% |
| Capital city houses | $724,097 | -0.2% | -0.7% | 6.3% |
| Capital city units | $551,149 | -0.1% | 0.1% | 1.5% |
| Regional dwellings | $532,167 | 0.2% | 0.0% | 2.4% |
Source: Cotality, 1st September 2025
Hobart was once the darling of speculative property investors and the best-performing property market in 2017- 2018.
After rising 28.1% over the past 5 years, Hobart dwelling values fell and are still -10.4% below their peak of March 2022.
Hobart remains the weakest capital city market when comparing annual price growth , as well as the change from peak.
Darwin's median property price
Here is the latest data on the median property prices for Darwin.
| Property | Median price Δ | Δ MoM | Δ QoQ | Δ Annual |
|---|---|---|---|---|
| All Capital city dwellings | $553,131 | 1.0% | 5.0% | 10.2% |
| Capital city houses | $654,490 | 1.1% | 6.1% | 10.9% |
| Capital city units | $393,254 | 0.8% | 2.5% | 8.8% |
| Regional dwellings | n/a | n/a | n/a | n/a |
Source: Cotality, 1st September 2025
Darwin remains the most affordable capital city to purchase a house.
The city’s famously relaxed and laid-back lifestyle and the low-density population were a bonus in the post-pandemic era and drove interest in Darwin property.
After rising 36.8% over the past 5 years, Darwin is at a new peak price after rising 1% through August 2025.
Canberra's median property price
Here is the latest data on the median property prices for Canberra.
| Property | Median price | Δ MoM | Δ QoQ | Δ Annual |
|---|---|---|---|---|
| All Capital city dwellings | $872,957 | 0.4% | 1.5% | 1.6% |
| Capital city houses | $1,008,291 | 0.6% | 1.9% | 2.1% |
| Capital city units | $594,813 | -0.2% | 0.1% | -0.1% |
| Regional dwellings | n/a | n/a | n/a | n/a |
Source: Cotality, 1st September 2025
Home prices in Canberra rose inAugust and also 1.6% higher than their August 2024 levels.
Overall Canberra’s median house prices recorded 30.5% growth over the past 5 years but are still 4.6% below their peak in May 2022.
The subdued Canberra auction clearance rates throughout the last year are a sign of the weakness of the Canberra property market.
What should you do now as a property buyer?
Now that you’ve got the latest property price data at your fingertips—and hopefully a better understanding of what’s really happening on the ground—you’re already ahead of most buyers and investors.
But remember, data is only part of the picture. In my mind property investment is part science and part art.
The data is the science, but perspective is the art, and so it's important how you interpret the information and what you do with it.
If you’re serious about building wealth through property and want expert guidance to cut through the noise and avoid costly mistakes, why not organise a free Wealth Discovery Chat with the team at Metropole? Just click here to organise that.
We’ve been helping Australians grow, protect, and pass on their wealth for over 26 years, and we’d love to help you too.
Because while the market will keep moving, your financial future doesn’t have to be left to chance.
- Also read:Everything you need to know about the state of Australia’s property markets in 20 charts – September 2025

- Also read:This week’s Australian Property Market Update – Latest Data, State by State September 9th 2025

- Also read:Melbourne property market forecast for 2026 | Is it a good time to invest in Melbourne?

- Also read:Latest Property Price Forecasts Revealed. Australian Property Market Outlook 2025–26: Where Prices Are Headed After Three Rate Cuts.

- Also read:Sydney property market forecast for 2026. Is it a good time to invest in Sydney?


