Could Australia’s surprisingly strong jobs market become the trigger for another interest rate rise?
That is the possibility property investors and homeowners must now consider following the release of the latest employment figures.
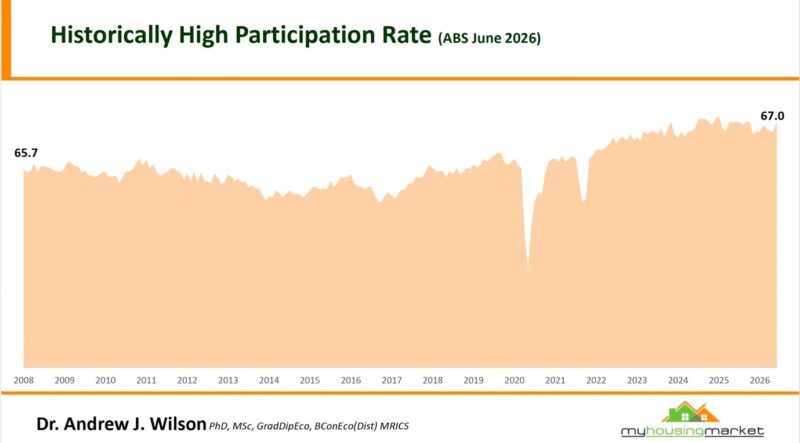
Australia added 76,300 jobs in June, more than five times the increase economists had expected, while the participation rate climbed to a historically strong 67%.
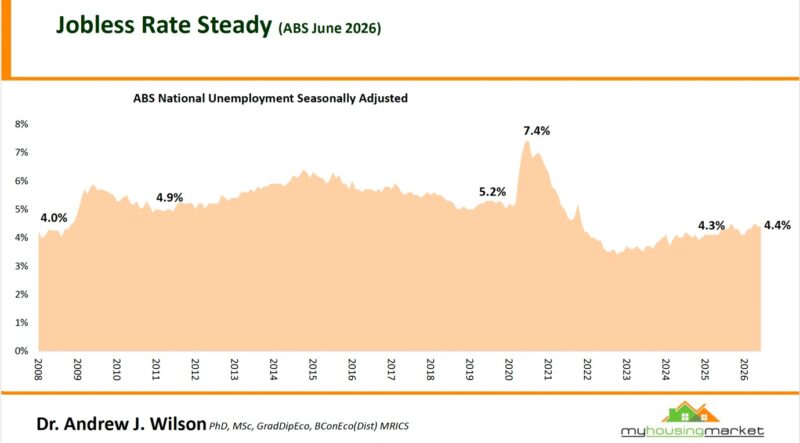
The unemployment rate remained steady at 4.4%, although this was largely because more Australians entered the workforce and began looking for work.
In most circumstances, a resilient labour market would be welcomed as good economic news, but the Reserve Bank is currently trying to slow demand sufficiently to bring inflation under control.
That means the strength of the June employment figures may leave the door open for another interest rate rise if the upcoming inflation data shows that price pressures remain stubbornly high.
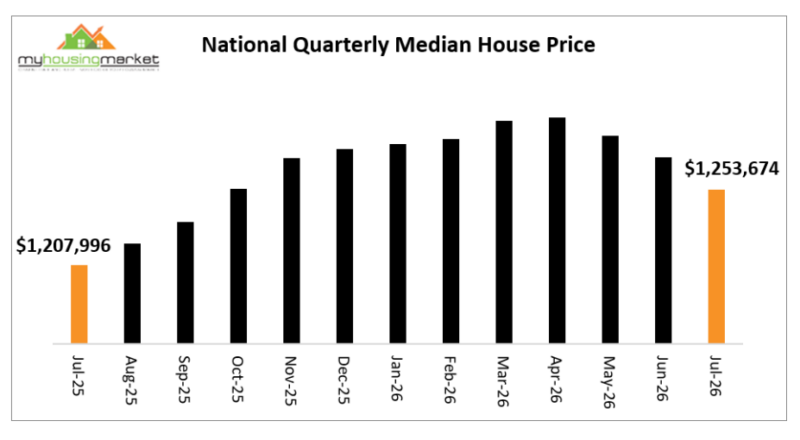
Meanwhile, Australia’s property markets continue to send mixed signals.
Some regional markets have recorded annual house-price growth of close to 20% or more, while others have gone backwards, and the major capital-city auction markets finished a subdued July with some tentative signs of resilience.
In this week’s Property Insiders, Dr Andrew Wilson and I look behind the headline employment figures, examine the risk of another rate rise and review the regional housing markets and the latest auction results.
Watch this week’s video, then keep reading for my thoughts on what these figures mean for homeowners and property investors.

Australia created more than 76,000 jobs in June
Australia’s labour market produced a much stronger result in June than almost anyone expected.
Watch this week's Property Insider chat as Dr. Andrew Wilson explains that seasonally adjusted employment increased by 76,300 people, taking the number of employed Australians to approximately 14.82 million.
Full-time employment increased by 29,300, while part-time employment rose by 47,000.
Employment is now 252,000 higher than it was a year ago, representing annual growth of 1.7%.
These are impressive figures considering the economy has been dealing with higher interest rates, weak productivity, falling household disposable incomes and cautious consumer spending.
They suggest employers are still willing to hire and that the economy continues to absorb a growing workforce.
However, the figures also contain some important qualifications.
The number of unemployed Australians increased by 12,700 during June and is now 4.6% higher than a year ago.
Underemployment also rose from 6.3% to 6.5%, indicating that some Australians who have jobs would still like to work additional hours.
So, while the labour market remains resilient, there is also evidence of gradually increasing spare capacity beneath the headline numbers.
Why unemployment remained at 4.4%
At first glance, it may appear unusual that Australia created more than 76,000 jobs while unemployment remained unchanged at 4.4%.
The explanation lies in the participation rate, which measures the proportion of working-age Australians who are either employed or actively looking for work, and rose from 66.7% to 67%.
A rising participation rate is generally a positive sign because it reflects confidence that jobs are available, but it can also increase the number of people officially classified as unemployed while they search for work, and this is precisely what happened in June.
The labour force grew quickly enough to absorb the employment surge without pushing the unemployment rate lower.
Of course, there may be several reasons why more people are entering the workforce - some are attracted by the availability of jobs, while others may be responding to the higher cost of living and mortgage repayments by seeking work or additional hours.
This is why a single headline number never tells the complete story.
The employment surge leaves the door open for another rate rise
The June employment figures are likely to make the Reserve Bank’s next decision more difficult.
The RBA has been trying to slow economic demand and reduce inflation without causing a sharp rise in unemployment or pushing the economy into recession.
Until now, the labour market has proved more resilient than many economists expected, which gives the RBA additional room to increase interest rates if inflation remains above its preferred range.
Strong employment supports household income and spending, while a tight labour market can also contribute to wage pressures. Both can make inflation more persistent.
The June figures alone don’t guarantee another interest rate rise, especially as underemployment increased and much of the employment growth was in part-time work.
However, they remove one of the arguments the RBA might have had for remaining on hold.
The next inflation figures, coming out shortly, will be particularly important.
If underlying inflation remains higher than the RBA expected, the combination of persistent price pressures and a resilient labour market could make another rate rise difficult to avoid.
For homeowners and property investors, this means it would be premature to assume the interest rate cycle has peaked.
The national figures conceal very different state economies
Of course, Australia doesn’t have one uniform labour market, just as it does not have one property market.
The latest state figures reveal substantial differences in employment conditions.
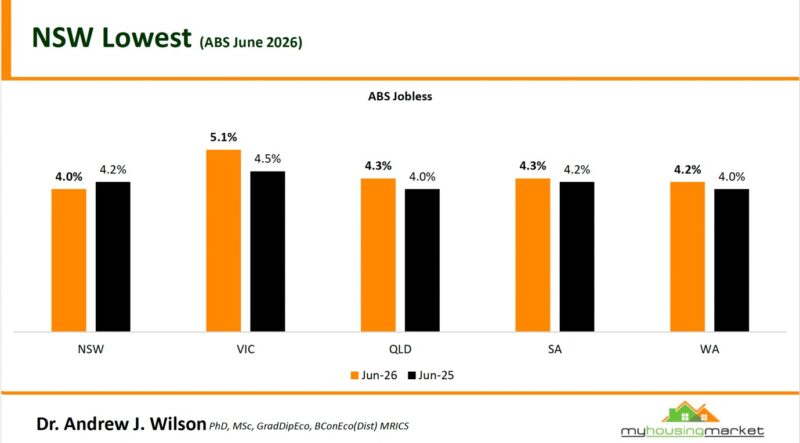
Victoria’s unemployment rate has risen to 5.1%, significantly above the national rate, while the state also recorded an underemployment rate of 7.3%.
This suggests the Victorian economy is experiencing considerably more spare capacity than the national headline implies.
Victoria has been dealing with high government debt, heavier property taxes, increasing regulation and weak business confidence, all of which have affected investment and employment decisions.
New South Wales continues to record one of the lowest unemployment rates in the country, while Queensland, South Australia and Western Australia are sitting closer to the national average.
These differences matter because employment growth is one of the foundations of housing demand.
People are more likely to form households, purchase homes and commit to larger mortgages when they feel secure in their jobs and confident about their future income.
However, employment is only one driver of property markets. Relative affordability, population growth, housing supply, taxation and consumer confidence will also influence how each state performs.
Regional property markets continue to produce extraordinary results
Watch this week's Property Insider chat as Dr Andrew Wilson shares the latest figures, which show that some regional housing markets continue to record very strong price growth despite higher interest rates.
However, the performance gap between regions is substantial.
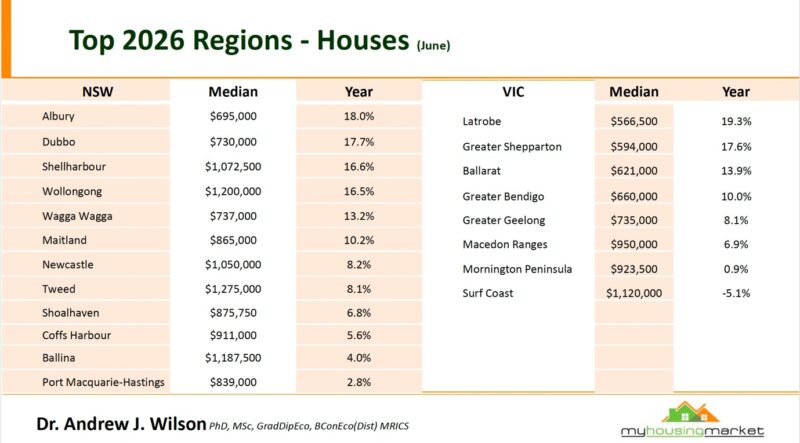
In New South Wales, Albury recorded annual house-price growth of 18%, closely followed by Dubbo at 17.7%, Shellharbour at 16.6% and Wollongong at 16.5%.
The median house price in Wollongong has now reached $1.2 million, while Shellharbour’s median has moved above $1.07 million.
These are no longer inexpensive alternatives to Sydney.
In Victoria, Latrobe recorded annual growth of 19.3%, Greater Shepparton grew by 17.6% and Ballarat increased by 13.9%.
Greater Bendigo recorded growth of 10%, while Greater Geelong produced a more moderate 8.1% increase.
However, the Mornington Peninsula recorded annual growth of only 0.9%, while the Surf Coast fell by 5.1%.
This variation reminds us that the label “regional property” covers a huge range of markets with very different economic and demographic drivers.
Queensland’s regional markets remain among the strongest
Queensland continues to dominate the regional growth tables.
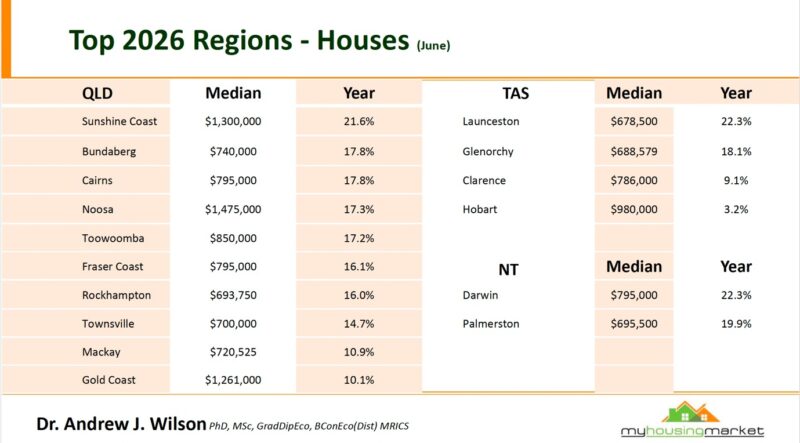
The Sunshine Coast recorded annual house-price growth of 21.6%, taking its median price to $1.3 million.
Bundaberg and Cairns both grew by 17.8%, while Noosa increased by 17.3%, Toowoomba by 17.2% and the Fraser Coast by 16.1%.
Rockhampton and Townsville also recorded annual growth of 16% and 14.7% respectively.
This reflects Queensland’s strong population growth and investment inflows in recent years, but it would be risky to assume these growth rates can continue indefinitely. Affordability is deteriorating rapidly and yields have compressed in some locations.
Investors buying after a strong upswing need to be especially careful because they may be paying for yesterday’s performance.
Some of the strongest results were found in Tasmania and the Northern Territory.
Launceston recorded annual house-price growth of 22.3%, with its median reaching $678,500, while Glenorchy grew by 18.1%.
Darwin also increased by 22.3%, taking its median house price to $795,000, while Palmerston recorded annual growth of 19.9%.
These figures are impressive, but smaller markets can be more volatile.
A relatively modest change in demand, employment or migration can have an outsized effect on prices because transaction volumes are lower and the buyer pool is narrower.
Investors should also remember that strong recent price growth doesn’t automatically translate into superior long-term performance.
The depth and diversity of the local economy, future housing supply, household incomes and the size of the owner-occupier market remain critical.
Should investors chase the regional winners?
Rapid regional price growth will inevitably attract investors searching for the next hotspot, but chasing markets after they have already risen strongly carries considerable risk.
Many regional markets experienced an extraordinary boost during the pandemic as Australians moved away from capital cities, embraced remote work and searched for more affordable housing.
Others have been driven by a spate of inexperienced buyer's agents, ploughing their clients into the same markets, artificially raising prices.
Some of these shifts will be lasting, but others are already normalising as employers require workers to spend more time in the office and households reconsider the practicalities of living far from major employment centres.
Regional markets also tend to be more exposed to one or two industries and usually have fewer buyers when conditions change.
In my view, most investors are better served by focusing on areas with diversified employment, rising household incomes, constrained supply and a substantial owner-occupier market.
Auction markets finish July with some resilient signs
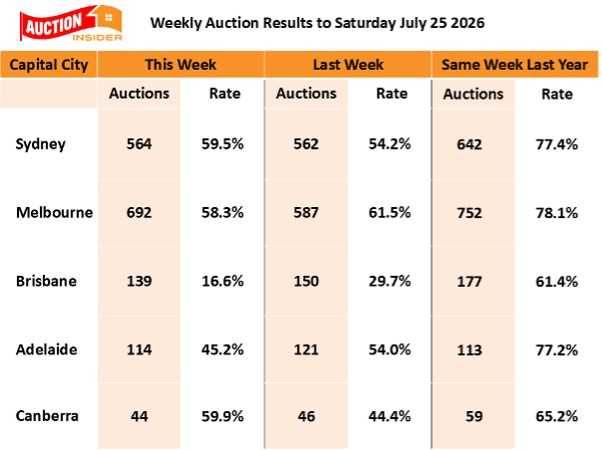
Australia’s auction markets concluded a generally subdued July with some capitals showing tentative improvement.
The national weekend auction market reported an average clearance rate of 47.9% over the past week which was slightly lower than the 48.8% reported over the previous week and again well below the 71.9% reported over the same week last year.
Auction markets have ended July with some capitals now pushing towards 60% clearance rates, so we now all awaiting the usual August seasonal revival.
Clearance rates near 60% usually indicate relatively balanced conditions rather than a rapidly rising market.
Buyers are taking more time, scrutinising property quality and becoming increasingly price-sensitive.
Vendors who base their expectations on last year’s prices may struggle, while realistically priced, well-located properties are still attracting competition.
The improvement in Sydney’s weekly clearance rate and the relative stability emerging in Melbourne suggest some buyers are gradually returning.
What this means for property investors
The latest data reinforces the importance of separating short-term market sentiment from long-term property fundamentals.
A further interest rate rise would place additional pressure on household budgets and borrowing capacity. It would probably keep buyers cautious and extend the period of subdued auction activity.
However, it would also make many new housing projects even less financially viable by increasing developers’ finance and holding costs.
In other words, higher rates may restrain demand in the short term while worsening the housing shortage over the longer term.
This is one reason I remain optimistic about the prospects for well-located, investment-grade property, despite expecting the market to experience further bumps along the way.
Of course, averages can be misleading.
Properties with weak locations, little scarcity, excessive nearby supply or limited owner-occupier appeal are likely to struggle as buyers become more selective.
On the other hand, quality properties in established suburbs where affluent owner-occupiers want to live will remain scarce.
Strategic investors should maintain substantial financial buffers, avoid overstretching and allow for the possibility that interest rates may remain higher for longer.
The current environment may feel uncomfortable, but periods of softer sentiment often provide investors with more time to conduct proper due diligence and negotiate with vendors.
By the time the economic outlook becomes reassuring and the property recovery is obvious, more buyers will have returned and many of today’s opportunities will have disappeared.
Successful property investing has always required a long-term perspective, careful asset selection and the financial capacity to hold through changing economic conditions.
]]>