

Key takeaways
Dwelling values increased a modest 0.4% in the first month of spring, broadly in line with the monthly change in July and August at 0.3% as momentum continues to leave the market.
The slowdown in the pace of growth comes as home owners increasingly look to sell.
The flow of new listings coming onto the market was tracking 3.2% higher than a year ago nationally to be 8.8% higher than the previous five-year average for this time of the year.
And our property market have been very fragmented, with Perth Adelaide in Brisbane having recorded the fastest pace of growth of capital cities for much of the past two years.
Alongside the rise in real estate listings, we have also seen vendor metrics soften, signalling weaker selling conditions.
The median house price in Australia’s combined capital cities is now $1,004,385
The median unit price in Australia’s capital cities is $683,419
The median dwelling value in Australia’s combined regional areas is $640,243
But of course, there are markets within markets, so we detail the median prices for each capital city in this article.
Dwelling values increased a modest 0.4% in the first month of spring, broadly in line with the monthly change in July and August at 0.3% as momentum continues to leave the market.
Nationally, housing values rose 1.0% in the September quarter, the lowest rise in the national Home Value Index (HVI) over a rolling three-month period since March 2023 when the market was moving through the early phases of the current upswing.
Over the last few years our property market have been very fragmented, with Perth Adelaide in Brisbane having recorded the fastest pace of growth of capital cities for much of the past two years.
Demonstrating the diversity of housing conditions, four capital cities recorded a fall in dwelling values through the September quarter, led by Melbourne where values were down -1.1%.

Growth conditions across regional housing markets have also eased, with the quarterly trend in the combined regionals index reducing from 2.3% in the three months ending April to 1.7% in the June quarter, and more recently to 1.0% over the September quarter.

Change in dwelling values around Australia
| City | Month | Quarter | Annual | Total return | Median value |
|---|---|---|---|---|---|
| Sydney | 0.2% | 0.5% | 4.5% | 7.8% | $1,188,912 |
| Melbourne | -0.1% | -1.1% | -1.4% | 2.4% | $777,390 |
| Brisbane | 0.9% | 2.7% | 14.5% | 19.0% | $881,091 |
| Adelaide | 1.3% | 4.0% | 14.8% | 19.1% | $802,075 |
| Perth | 1.6% | 4.7% | 24.1% | 29.8% | $797,184 |
| Hobart | -0.4% | -0.8% | -1.1% | 2.9% | $654,302 |
| Darwin | 0.1% | -0.7% | 2.0% | 8.7% | $492,332 |
| Canberra | -0.3% | -0.9% | 0.7% | 4.9% | $844,882 |
| Combined capitals | 0.5% | 1.1% | 6.7% | 10.7% | $891,639 |
| Combined regional | 0.4% | 1.0% | 6.7% | 11.5% | $640,243 |
| National | 0.4% | 1.0% | 6.7% | 10.9% | $807,110 |
Source: CoreLogic 1st October 2024
- The median dwelling price for Australia now sits at $807,110
- The median dwelling price for our combined capital cities now sits at $891,639
- The median dwelling price for our combined regional towns sits at $640,243
Be carful how you interpret this data!
The media keeps telling us that Perth, Brisbane and Adelaide have overtaken Melbourne in median values, but this is misleading.
They are quoting the "dwelling prices" mentioned above, but Melbourne has double the number of units (apartments) relative to houses when compared to these other capitals and this obviously skews the median ‘all dwellings’ values.
Percentage of Units in the Market
| City / Region | % units |
|---|---|
| Greater Sydney | 39.3% |
| Greater Darwin | 36.4% |
| ACT | 33.8% |
| Greater Melbourne | 33.0% |
| Greater Brisbane | 25.3% |
| Greater Hobart | 18.3% |
| Greater Adelaide | 16.3% |
| Greater Perth | 15.8% |
| Regional NT | 25.8% |
| Regional Qld | 25.0% |
| Regional NSW | 14.8% |
| Regional Vic. | 11.2% |
| Regional Tas. | 10.5% |
| Regional WA | 7.9% |
| Regional SA | 5.8% |
| Combined capitals | 30.0% |
| Combined regionals | 16.4% |
| National | 25.5% |
Source: CoreLogic, August 2024
Current Australian house price trends
Of course, there is not one property market around Australia as the following chart clearly shows.

The ongoing rise in housing values reflects a persistent imbalance between supply and demand which varies in magnitude across our cities and regions.
Perth continues to stand out with a substantially higher rate of growth compared to any other region, up 1.6% over the month.
Adelaide (+1.3%), Brisbane (+0.9%) and the regional areas of SA (+1.1%), WA (+1.6%) and Queensland (+0.7%) also show a consistently high rate of capital growth month-to-month.
These regions are generally benefiting from a combination of comparatively lower housing prices and positive demographic factors that continue to support housing demand.
Although the pace of gains has slowed a little, most regions are still recording value growth well below the highs of last year.
| Onset of Covid to September 2024 |
$ | Δ from peak to September 2024 | Series peak to date | |
|---|---|---|---|---|
| Sydney | 29.2% | $268,627 | <at peak> | <at peak> |
| Melbourne | 9.9% | $70,190 | -5.1% | 22-Mar |
| Brisbane | 66.4% | $351,613 | <at peak> | <at peak> |
| Adelaide | 69.0% | $327,581 | <at peak> | <at peak> |
| Perth | 74.6% | $340,720 | <at peak> | <at peak> |
| Hobart | 26.9% | $138,668 | -12.5% | 22-Mar |
| Darwin | 25.3% | $99,537 | -6.0% | 14-May |
| Canberra | 30.8% | $198,773 | -6.0% | 22-May |
| Regional NSW | 49.2% | $244,295 | -2.8% | 22-May |
| Regional VIC | 30.8% | $132,252 | -8.4% | 22-May |
| Regional QLD | 66.2% | $267,551 | <at peak> | <at peak> |
| Regional SA | 66.0% | $173,228 | <at peak> | <at peak> |
| Regional WA | 71.0% | $220,646 | <at peak> | <at peak> |
| Regional TAS | 45.9% | $162,584 | -4.0% | 22-May |
| Combined capitals | 34.1% | $226,976 | <at peak> | <at peak> |
| Combined regional | 53.7% | $223,558 | <at peak> | <at peak> |
| National | 38.3% | $223,417 | <at peak> | <at peak> |
Note: Onset of COVID calculated from March 2020
What you need to know about median house prices
We’ve written a detailed article explaining why not to trust median property prices here.
However, understanding median house prices can be useful because they give investors a rough guide about the locations they can afford.
Yet they should never be considered to be the Holy Grail of property data, because of the tendency for median prices to jump around from quarter to quarter.
They are more a reflection of the properties recently sold in the area rather than what a particular property is worth.
In many locations understanding the median house price is almost worthless because of the variations of the great variation in sale prices for houses, which means the area does not have a homogeneous style of housing.
For example, you could get a significant variation in property value for similar properties when you compare the more desirable locations within a particular suburb, such as a property having water views with ones that are less desirable such as on a busy road or even on a secondary main road or too near the train or with views of the service station across the street.
As you can see, if a suburb has housing of variable quality, the median house price is not very useful because some properties are simply more valuable than others.
However, if a suburb has very similar housing, such as renovated older homes on large blocks or a newer suburb where most of its housing stock was built over a few years, the median house price would be more relevant.
Melbourne's median property price
Here is the latest data on the median property prices for Melbourne.
| Property | Median price | Δ MoM | Δ QoQ | Δ Annual |
|---|---|---|---|---|
| All dwellings | $777,390 | -0.1% | -1.1% | -1.4% |
| Capital city houses | $925,762 | -0.2% | -1.3% | -1.3% |
| Capital city units | $612,215 | 0.1% | -0.5% | -1.6% |
| Regional dwellings | $561,990 | -0.2% | -1.4% | -1.5% |
Source: CoreLogic, 1st October 2024
Melbourne's values have risen 9.9% since the onset of Covid, but are still -5.1% below their peak of March 2022 and they fell-0.2% August.
Melbourne buyers have consistently enjoyed more choice relative to other markets, at the same time construction rates relative to population growth in Victoria have been somewhat balanced compared to other parts of the country.
The result is that the Melbourne housing market has not performed as strongly as some other capitals over the last year or two.
However, this creates a window of opportunity for strategic property investors as Melbourne property values have significant upside potential.
The average price of a Melbourne standalone house is the lowest it has been against its Sydney equivalent in around twenty years.
Why the underperformance of the Melbourne market?
Partly it might reflect the greater stock of housing available for sale in the Melbourne market relative to other states.
Also, investor demand has also been lower in Melbourne dues to discontent with the way the Victorian government is treating investors and favouring tenants.
Also, one of the biggest short term influences on the property market performance is each city’s economy, and there is no doubt that there is plenty of negative sentiments about how the Victorian government is handling its economy.
However the Melbourne housing markets are fragmented and more than 50 Victorian suburbs saw house price growth exceed the average national average house price growth in 2023.
Not surprisingly, there is currently a flight to quality properties in Melbourne, with A-grade homes and "investment grade" properties still in short supply for the prevailing demand, but B Grade properties are taking longer to sell and informed buyers are avoiding C Grade properties.
Moving forward strong immigration and a lack of supply of properties will help keep pushing Melbourne property prices higher.
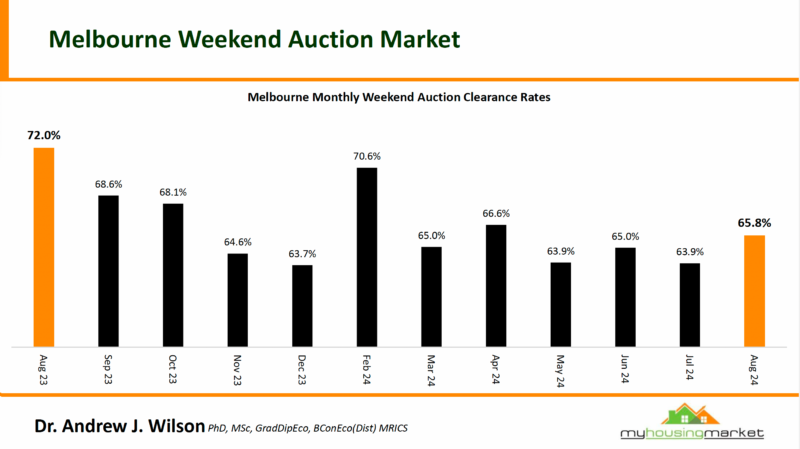
Melbourne's auction results show the market depth experienced so far this year with multiple buyers vying for good properties.
Sydney's median property price
Here is the latest data on the median property prices for Sydney.
| Property | Median price | Δ MoM | Δ QoQ | Δ Annual |
|---|---|---|---|---|
| All Capital city dwellings | $1,188,912 | 0.2% | 0.5% | 4.5% |
| Capital city houses | $1,473,775 | 0.1% | 0.3% | 4.9% |
| Capital city units | $860,849 | 0.6% | 0.9% | 3.5% |
| Regional dwellings | $740,981 | 0.2% | 0.4% | 3.6% |
Source: CoreLogic, 1st October 2024
The Sydney property market saw home values defy predictions and rise steadily for the last 18 months however price growth is slowed over the past quarter in Sydney.
The increase in Sydney properties hitting the market this year has been met with strong demand driving property price growth, but this has slowed over the seasonally quieter winter period as buyers have enjoyed more options, a trend expected to carry into spring
Moving forward, the various sectors of the Sydney property markets will be fragmented, which is a more “normal” property market.
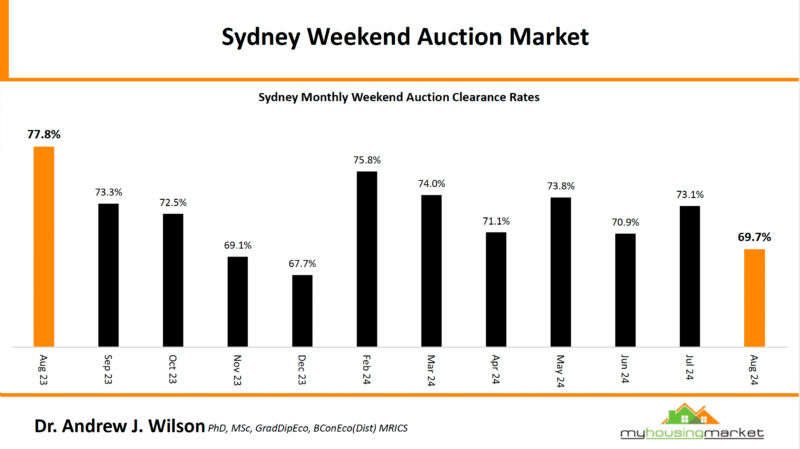
Sydney auction clearance rate have been strong all year, showing significant depth in the market and suggesting sale prices will continue to keep rising this year.
Brisbane's median property price
Here is the latest data on the median property prices for Brisbane.
| Property | Median price | Δ MoM | Δ QoQ | Δ Annual |
|---|---|---|---|---|
| All Capital city dwellings | $881,091 | 0.9% | 2.7% | 14.5% |
| Capital city houses | $973,534 | 0.8% | 2.4% | 13.5% |
| Capital city units | $661,925 | 1.2% | 4.2% | 19.4% |
| Regional dwellings | $664,174 | 0.9% | 2.6% | 12.2% |
Source: CoreLogic, 1st October 2024
Brisbane's housing market skyrocketed during the pandemic with 66.4% trough to peak growth, and is currently at a new peak in price.
Brisbane remains one of the strongest performing markets over the past year and our on-the-ground experience at Metropole Brisbane is that there is still strong demand from both home buyers and property investors for A-grade homes and investment-grade properties.
Supply is struggling to keep up with the rising demand, further supporting rising home values.
At the end of last year, Brisbane auction market slumped a little, but Brisbane has never been a city that held many auctions, however, as you can see from the chart below, the Brisbane auction market has been strong throughout 2024, suggesting property prices will keep rising.

Adelaide's median property price
Here is the latest data on the median property prices for Adelaide.
| Property | Median price Δ | MoM Δ | QoQ Δ | Annual Δ |
|---|---|---|---|---|
| All Capital city dwellings | $802,075 | 1.3% | 4.0% | 14.8% |
| Capital city houses | $856,856 | 1.3% | 3.9% | 14.4% |
| Capital city units | $564,854 | 1.4% | 4.8% | 17.2% |
| Regional dwellings | $435,729 | 1.1% | 2.3% | 10.6% |
Source: CoreLogic, 1st October 2024
The Adelaide property market remains one of the countries top performing markets.
Low stock levels are intensifying competition and sellers are entering the spring sewing season with the upper hand.
The comparative affordability of the city’s homes has seen prices defy the significant increase in interest rates since May 2022, but this affordability gap is now disappearing.
CoreLogic data shows Adelaide values recorded a COVID-19 "trough to peak" growth of 69 per cent.
Like in most capital cities, low stock levels are also helping to insulate home values, with increased competition among potential buyers
The strong auction clearance rates are an indication of the depth of the Adelaide property market and while they started a little lower this year, the depth of buyer demand has kept Adelaide auction clearance rates high.

Perth's median property price
Here is the latest data on the median property prices for Perth.
| Property | Median price Δ | Δ MoM | Δ QoQ | Δ Annual |
|---|---|---|---|---|
| All Capital city dwellings | $797,184 | 1.6% | 4.7% | 24.1% |
| Capital city houses | $830,965 | 1.6% | 4.6% | 24.0% |
| Capital city units | $572,007 | 2.0% | 6.2% | 25.2% |
| Regional dwellings | $531,310 | 1.6% | 3.6% | 19.3% |
Source: CoreLogic, 1st October 2024
Perth has maintained its streak of relative outperformance and remains the strongest market in the country for monthly and annual home price growth.
But remember...Perth housing values remained flat for most of the last decade, but over the last 15 months house and unit values in Perth enjoyed their most significant increases and are currently at a new peak.
The relative affordability of the city’s homes, population growth, and very tight rental markets are also supporting home values.
However, I would avoid investing in Perth for a number of reasons:
- Currently East Coast property buyers are pushing up Perth property values, buying properties site unseen and paying prices well above market price. This means the investor has to overpay, they will regret down the track.
Our contacts on the ground in Perth advise us that East Coast buyers' agents (NOT Metropole) are paying what they call "silly prices" significantly above what locals would pay, because properties are still relatively cheap in Perth. And they are buying these properties, site, unseen, creating significant risks for their clients. - The Western Australian economy is not as diverse as the other capital cities. While Perth is not a mining town, it is too dependent on a couple of industries – especially the mining industry which accounts for around 45% of the economic output and much of this is dependent on China, and this has a direct knock-on effect on WA house prices. The mining and energy companies are large employers in Perth. This means that the Perth property market is susceptible to a downturn in mining.
Apart from the large energy companies, most corporate head offices are located in the eastern capital cities. Management roles in head offices tend to attract higher salaries which, to some extent, support/underpin property prices. - Further, the larger east coast capital cities have significantly larger the population with more diverse the employment opportunities which in general attract higher salaries.

Hobart's median property price
Here is the latest data on the median property prices for Hobart.
| Property | Median price | Δ MoM | Δ QoQ | Δ Annual |
|---|---|---|---|---|
| All Capital city dwellings | $654,302 | -0.4% | -0.8% | -1.1% |
| Capital city houses | $692,504 | -0.2% | -0.9% | -1.6% |
| Capital city units | $536,932 | -1.1% | -0.5% | 1.2% |
| Regional dwellings | $$516,910 | -0.2% | -0.2% | 1.6% |
Source: CoreLogic, 1st October 2024
Hobart was the darling of speculative property investors and the best-performing property market in 2017- 2018.
After rising 26.9% over the Covid period, Hobart dwelling values fell and are still -12.5% below their peak of March 2022.
Hobart remains the weakest capital city market when comparing annual price growth , as well as the change from peak.
Hobart was an underperformer for most of 2023 and 2024.
Darwin's median property price
Here is the latest data on the median property prices for Darwin.
| Property | Median price Δ | Δ MoM | Δ QoQ | Δ Annual |
|---|---|---|---|---|
| All Capital city dwellings | $492,332 | 0.1% | -0.7% | 2.0% |
| Capital city houses | $592,507 | 0.1% | -0.4% | 3.4% |
| Capital city units | $353,742 | 0.2% | -1.2% | -0.8% |
| Regional dwellings | n/a | n/a | n/a | n/a |
Source: CoreLogic, 1st October 2024
Darwin remains the most affordable capital city to purchase a house.
The city’s famously relaxed and laid-back lifestyle and the low-density population were a bonus in the post-pandemic era and drove interest in Darwin property.
After rising 25.3% over the Covid period, Darwin's dwelling fell 6.0% after peaking in May 2014 and prices are still -6% below their previous peak.
Canberra's median property price
Here is the latest data on the median property prices for Canberra.
| Property | Median price | Δ MoM | Δ QoQ | Δ Annual |
|---|---|---|---|---|
| All Capital city dwellings | $844,882 | -0.3% | -0.9% | 0.7% |
| Capital city houses | $966,684 | -0.2% | -0.7% | 1.7% |
| Capital city units | $583,164 | -0.3% | -1.4% | -2.6% |
| Regional dwellings | n/a | n/a | n/a | n/a |
Source: CoreLogic, 1st October 2024
Home prices in Canberra fell again in August, and are only up 0.7% from their August 2023 levels.
Canberra’s property market was once the “quiet achiever” with median house prices recording 30.8% growth since the beginning of Covid.
A number of factors were driving house price increases in Canberra and the wider ACT including rising interest from international and interstate investors and tight land releases among others.
After rising 30.8% over the Covid period, Canberra's dwelling values fell and are still 6% below their peak in May 2022.

The subdued Canberra auction clearance rates throughout the last year are a sign of the weakness of the Canberra property market.

- Also read:Melbourne property market forecast for 2025

- Also read:Sydney property market forecast for 2025
- Also read:Latest property price forecasts for 2024 revealed. What’s ahead in our housing markets in the next year or two?
- Also read:This week’s Australian Property Market Update – Latest Data, State by State September 24th 2024
- Also read:Everything you need to know about the state of Australia’s property markets in 20 charts – September 2024


