


Key takeaways
Budget changes and affordability pressures have cooled buyer demand, driving an increase in auction withdrawals and pre-auction sales.
Nationally, the auction share dropped from nearly 45% in November 2025 to just over 30% in June 2026, led by Sydney and Melbourne.
Sitting above the 28% long-term average, auction activity has room to fall further as vendors increasingly opt for private treaty sales.
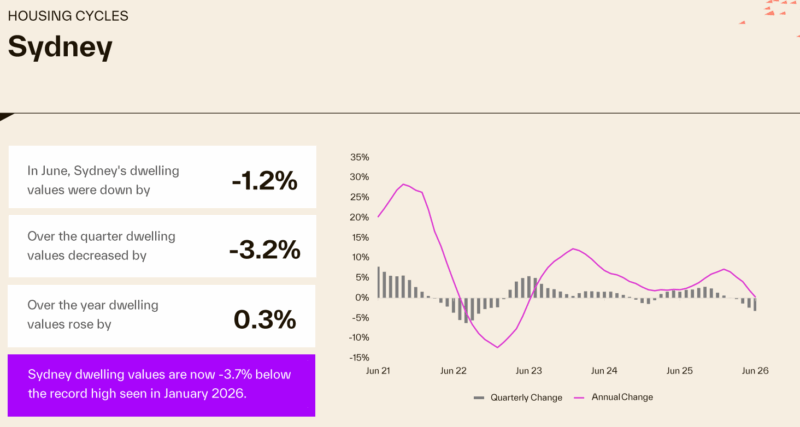
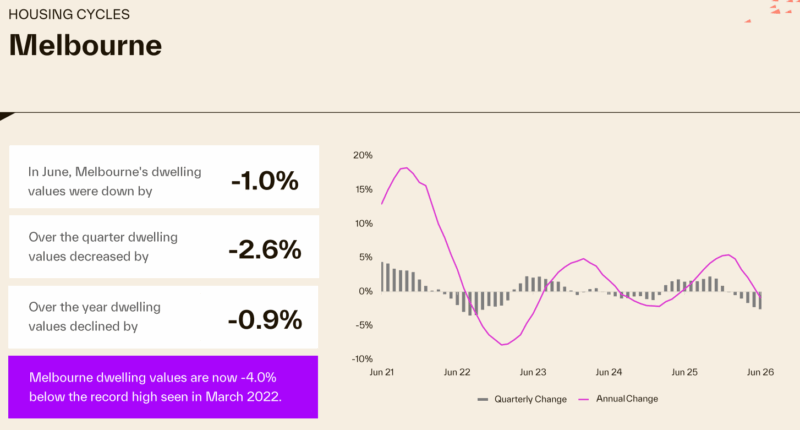
Sydney dwelling values fell 1.2% in June and are now 3.7% below their January 2026 peak, while Melbourne values declined 1.0% over the month and sit 4.0% below their March 2022 high.
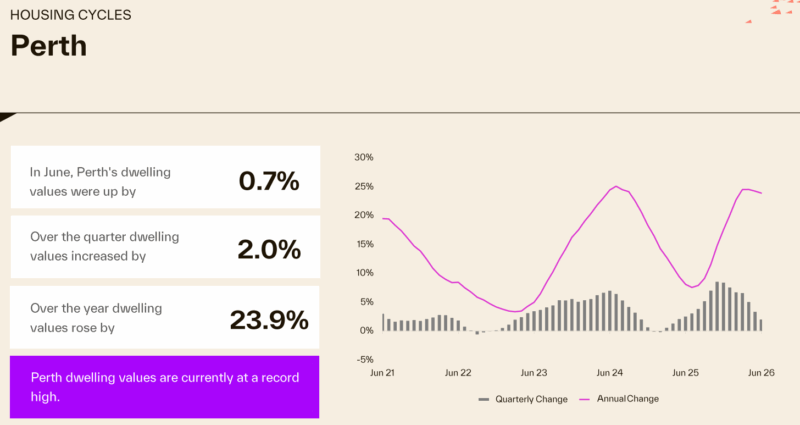
Perth values rose 23.9% over the past year compared with a 0.9% fall in Melbourne, with the gap in annual growth rates across the capital cities remaining close to 25 percentage points.
33,935 new listings over the four weeks ending 5 July, 6.2% below the five-year average.
Total listings at 131,407 over the four weeks ending 5 July, up 7.7% from a year ago and 3.5% below the five-year average.
Vendor discounting has started to rise, with the median discount across the combined capital cities increasing to 3.6%, reflecting improved negotiating conditions for buyers.
There is no doubt that our housing markets are facing challenges from all directions, but clearly, they have remained resilient.
To better understand what's happening, this monthly collection of charts from Cotality paints an interesting picture.
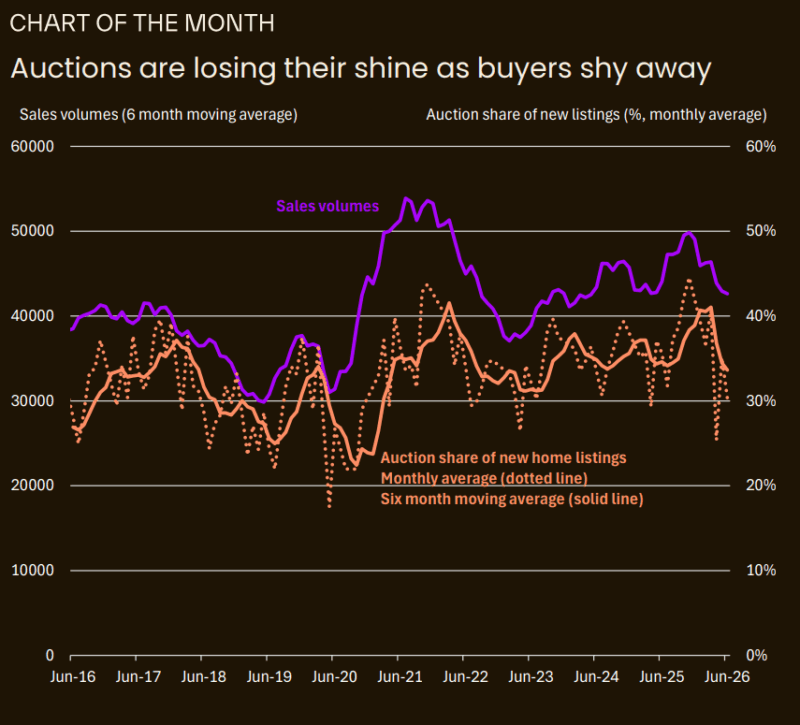
According to Cotality, Australian property vendors are increasingly turning their backs on auctions as cooling buyer demand reshapes the market.
The latest data shows the national share of auctions to new listings dropped sharply from its recent peak of almost 45% in November 2025 to just over 30% in June 2026.
The cooling of sales volumes since late 2025 reflects the cumulative impact of interest rate rises, cost of living, uncertainty, and policy changes negatively impacting property demand.
As clearance rates fall and auction withdrawals rise, vendors are shifting their preferences toward private treaties rather than risking a public campaign that fails to sell.
Cotality Australia Head of Research Gerard Burg said that while the auction market typically experiences strong seasonal fluctuations, the current downturn reflects deeper shifts in underlying market dynamics.
He further said:
"The decline in clearance rates since late last year has captured a lot of headlines.
Given that the auction market has a strong seasonal trend, typically stronger in the spring and weaker in winter, it is important to look through these factors to see the underlying trends in the market.
What we have observed over the past few months has been a steady decline in sales volumes as demand-side pressures have built, meaning that there have been fewer buyers in the market. This goes well beyond just the normal seasonal trend."
Sydney and Melbourne lead the pullback
The shift away from auctions is most visible in the historically high-volume markets of Sydney and Melbourne, both heavy auction markets that tend to lead national trends.
Compared with November, monthly auction numbers in these cities fell sharply, outpacing the broader decline in new listings and suggesting a trend that extends beyond seasonal factors.
However, the retreat is not isolated to major auction hubs.
Even capitals where private treaties dominate, including Brisbane and Adelaide, have recorded an increasing preference for private sales in recent months as vendors adapt to weaker demand.
Mr Burg said that seller behaviour directly mirrors the strength of buyer appetite.
"During times of strong demand, vendors clearly favour auctions as competition between multiple bidders can result in a higher price," Mr Burg said.
"However, they have been shying away more recently in this weaker demand environment. This has been seen in an increasing tendency to sell ahead of the auction date as well as a rise in withdrawals, pointing to vendors who are increasingly unwilling to test the market at an auction and have the property fail to sell."
Room for further adjustment
While the auction share has retreated to just over 30%, historic patterns indicate that auction activity may contract further.
The long-term average for auction listings sits at around 28%, suggesting that private sales will continue to gain traction as the property ecosystem recalibrates.
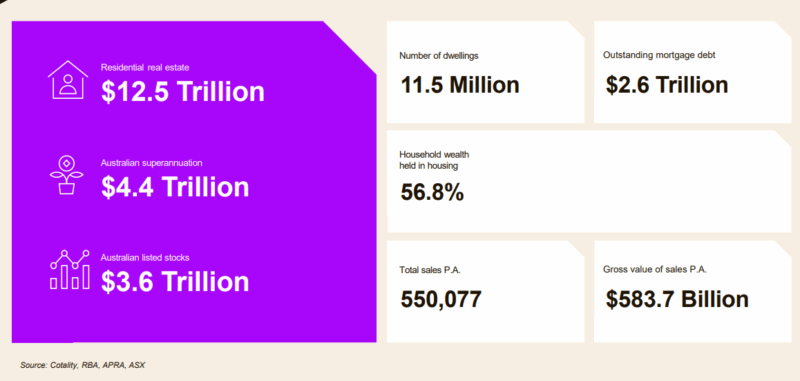
Residential real estate underpins Australia's wealth
- The total value of Australian residential real estate was $12.5 trillion at the end of June 2026.
- Outstanding mortgages against all residential housing are only $2.6 trillion - a very comfortable 20% Loan to Value ratio.
- 56.8% of total Aussie household wealth is held in residential property - one of the many reasons neither the banks, the government nor the RBA wants a property crash.
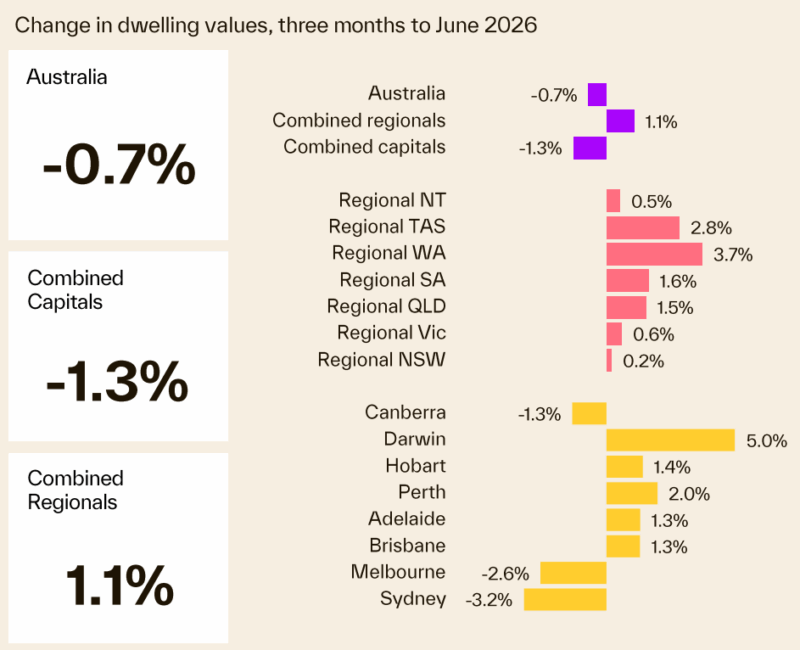
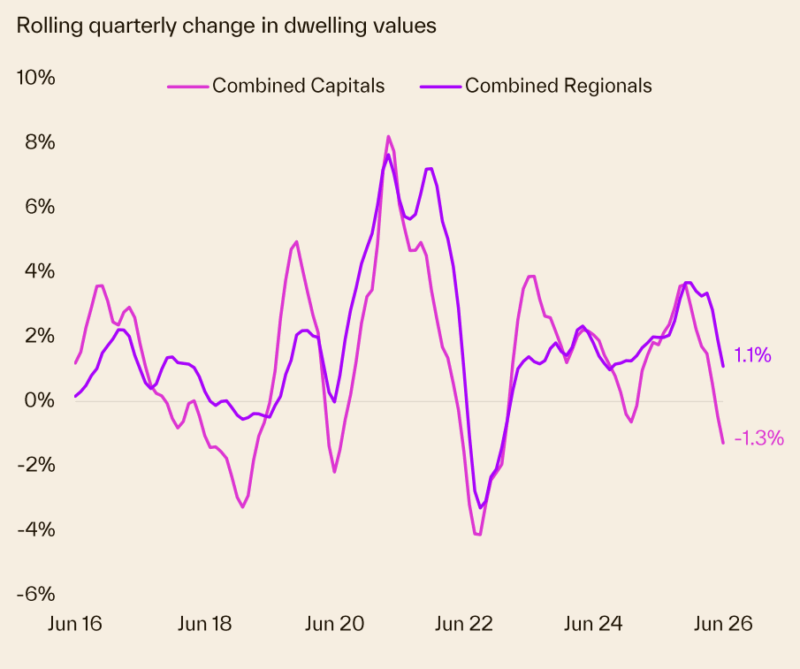
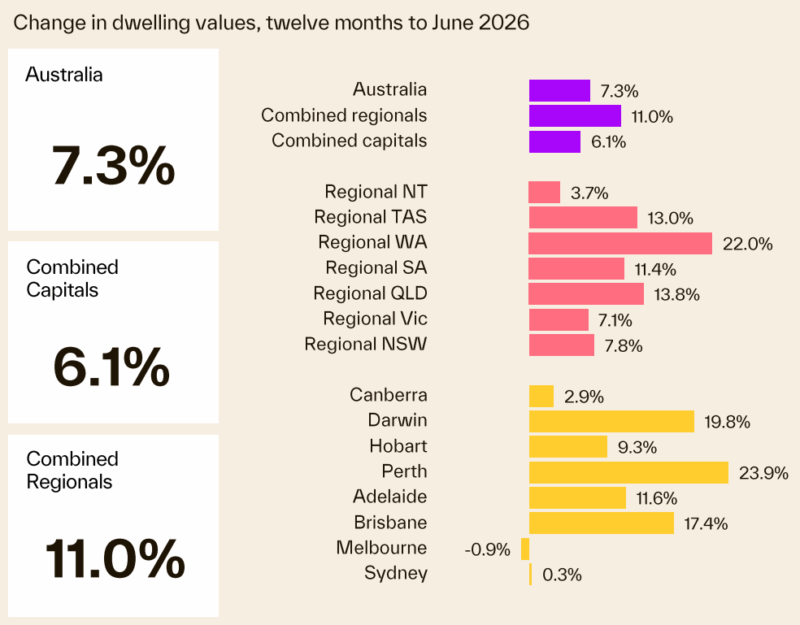
Australian dwelling values
- Australian home values decreased 0.7% over the three months to June, the largest rolling three -month decline in national home values since January 2023.
- The annual growth trend decelerates to 7.3%.
- As buyer demand and monthly gains lose momentum, annual growth is likely to moderate further through the second half of the year.
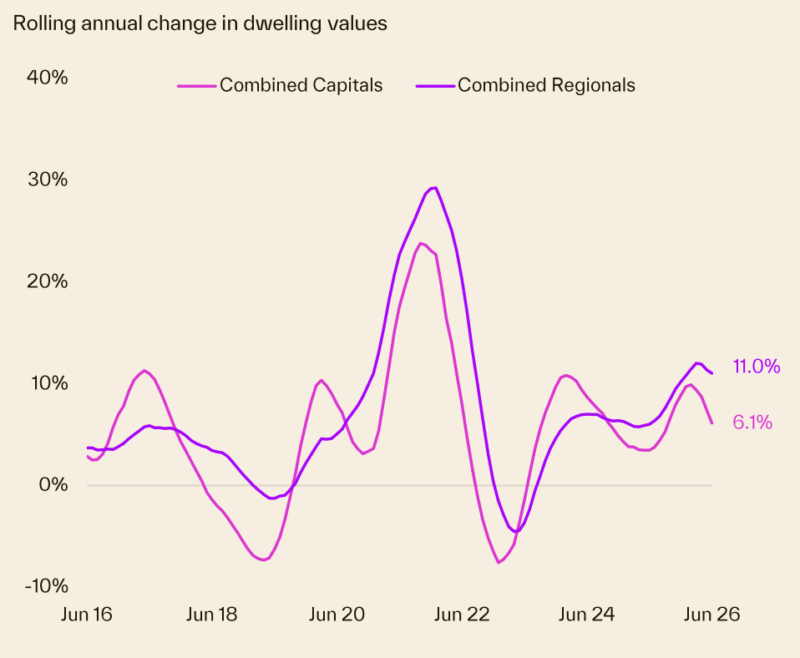
- Regional areas are outpacing capitals, with values rising 1.1% against a 1.3% fall in combined capital city values over the June quarter.
- However, as a property investor, you can always outperform the average.
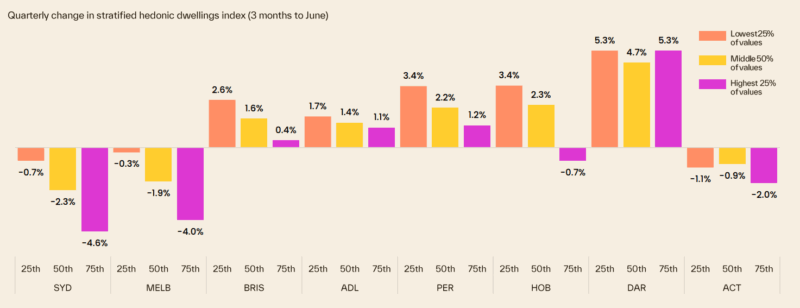
Our capital city markets are fragmented
Our housing markets are fragmented, with each state performing differently depending on local economic and market factors.
The following chart shows how different price segments in each capital city market are performing.
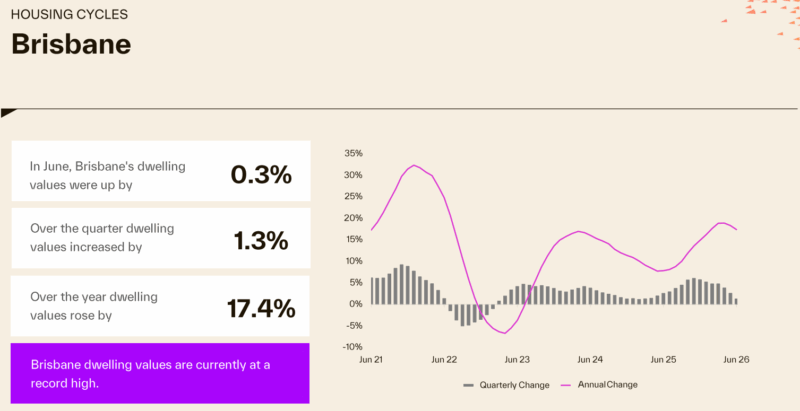
Each State is running its own race
One star performer was Brisbane, where property values increased 17.4% over the last year and are currently at a record high.
- Perth property values are up 23.9% over the year and are currently at a new record high.
- Sydney property values increased only 0.3% over the past year but are now -3.7% below their record high in January 2026.
- Melbourne property values decreased -1.0% for June, also decreased -0.9% over the year, and are now -4% below the record high seen in March 2022.
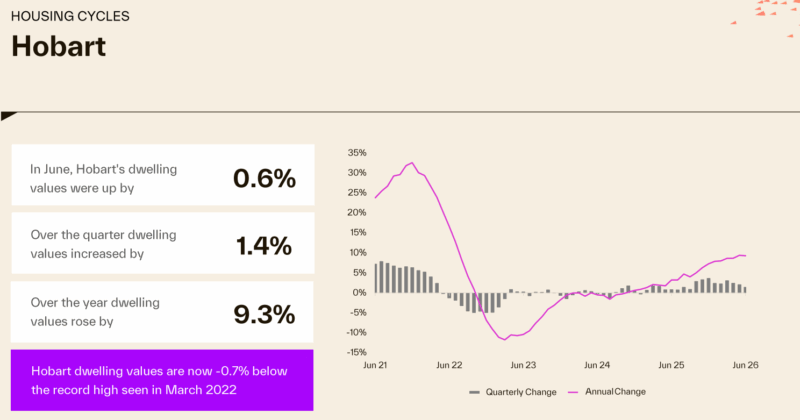
- In the previous darling of the housing markets, Hobart, house prices are -0.7 % below their record highs recorded in March 2022.
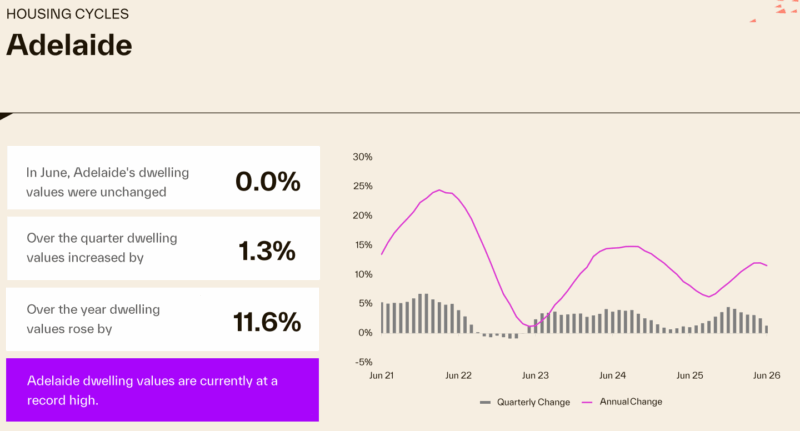
Here's how the Adelaide property market performed.
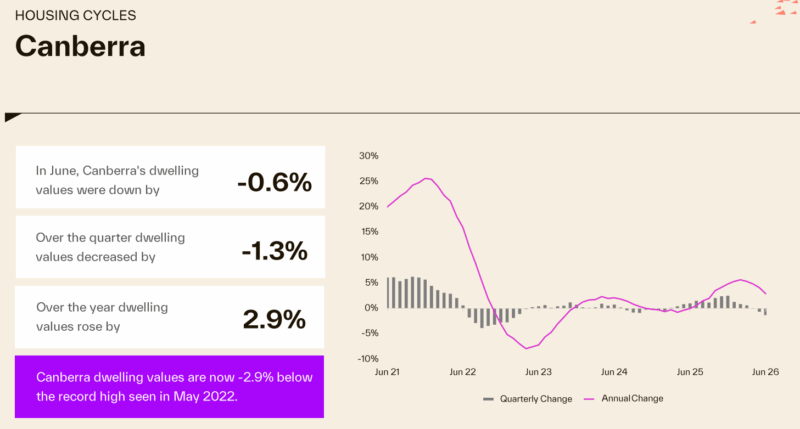
- Dwelling values in Canberra increased 2.9% over the last year.
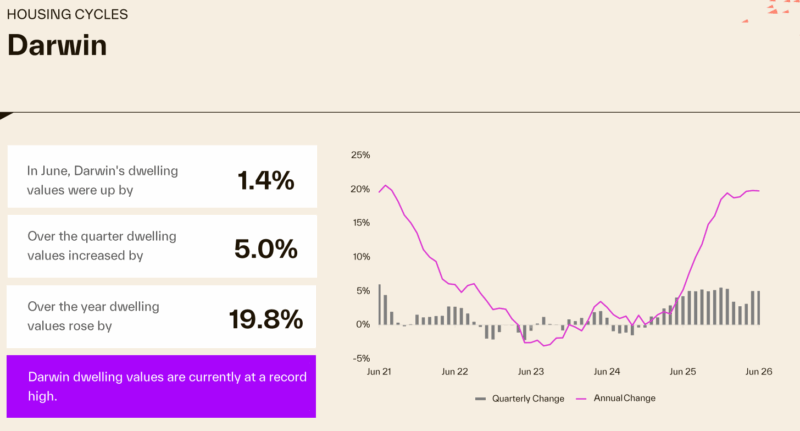
- The Darwin housing market has performed strongly, increasing 19.8% over the year and is currently at a new record high.
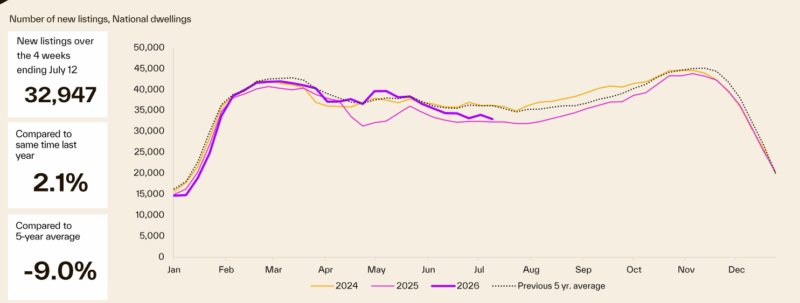
Here's how many properties are for sale at the moment
- New listings tracked closely with the five - year average through the first half of the year and remained above 2025 levels for most of the year.
- Listing activity has softened from a peak in early March, trending downwards through winter, closing 2.1% above year ago levels and 9.0% below the five - year average.
- The problem is that very few are A Grade homes or investment grade properties. Owners of quality properties are holding onto them.
- Total listings commenced 2026 well below year ago levels and began to rise steadily through the first half of the year, overtaking 2025 levels by the mid year, but still 3.7% below the five - year average in early July.
- With total listings up 8.4% on year ago levels, the trend is showing a steady rise in listings at a time when buyer demand is easing.
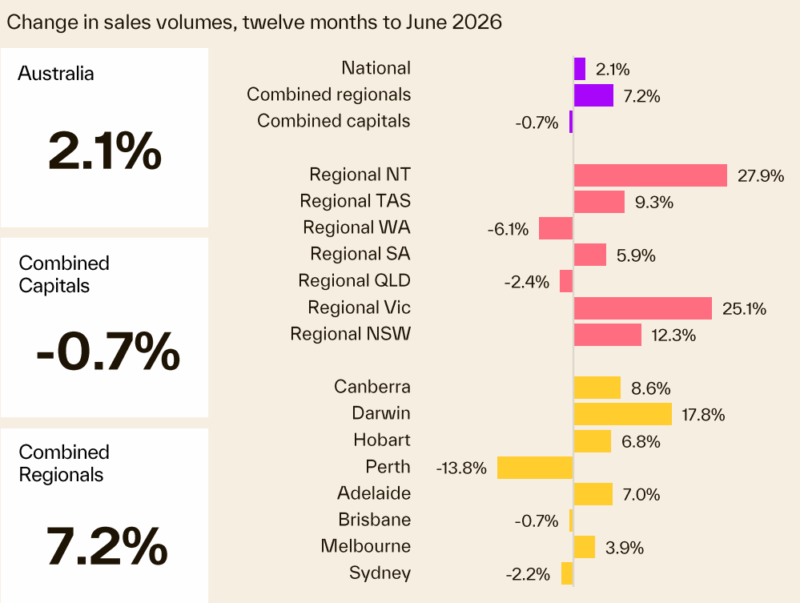
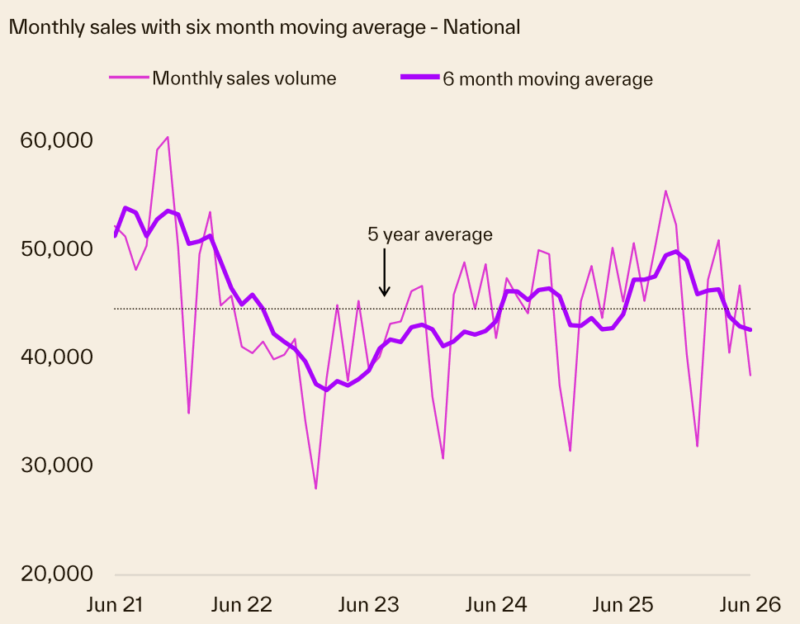
Transaction volumes
- National home sales rose 2.1% over the year to June 2026 with growth concentrated in regional markets.
- The number of ales across the combined regional areas increased 7.2% year on year, while the combined capitals eased 0.7.
- The deterioration in demand since late 2025 is clearly evident, with sales volumes now tracking below the five - year average.
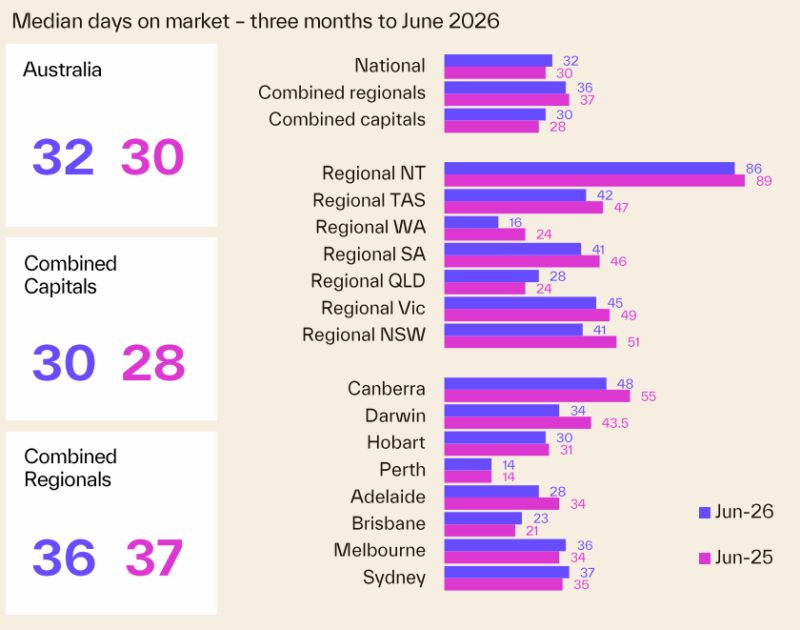
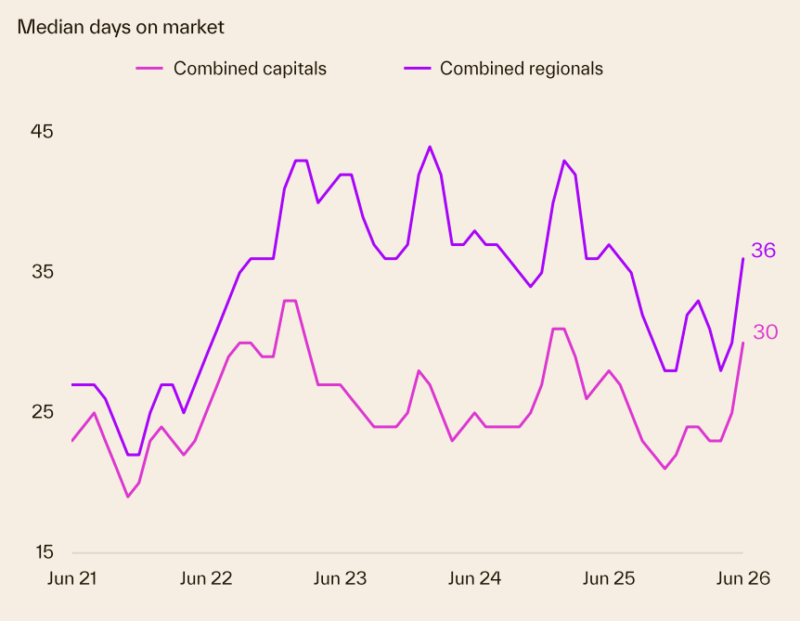
Homes are taking slightly longer to sell
- Nationally, homes are taking slightly longer to sell, with the median time on market rising to 32 days.
- Since late 2025 selling conditions have softened across both the capital city and regional markets.
- The rise in selling times has become more noticeable in recent months, with the median time to sell increasing to 30 days across the capitals and reaching 36 days across the regional markets.
- This is a clear sign of cooling conditions and increasing supply.
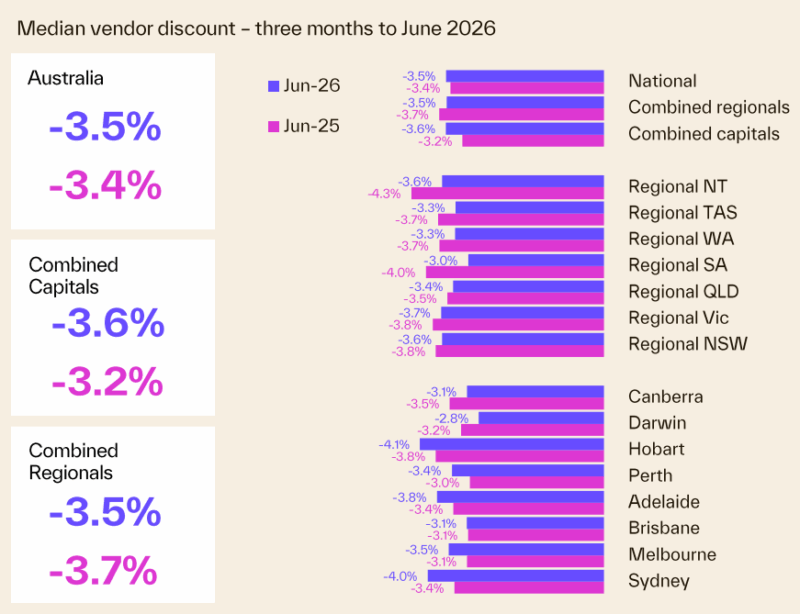
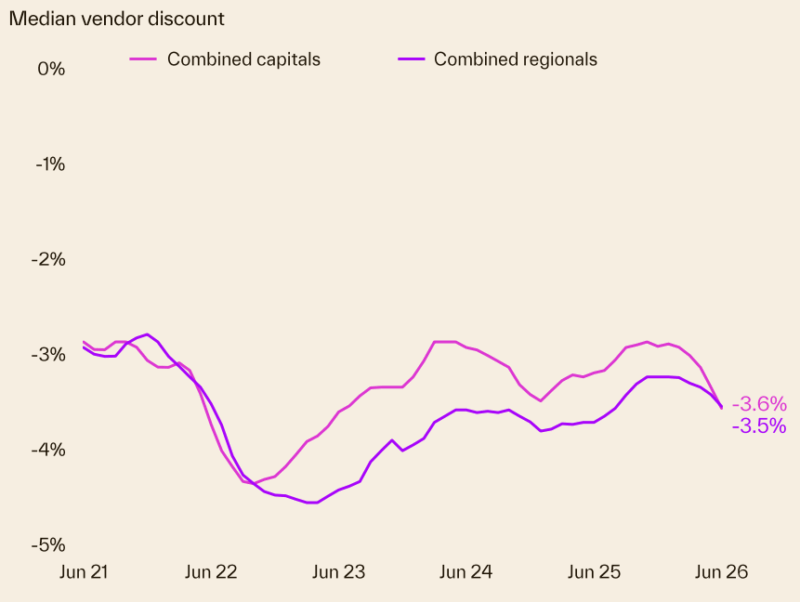
Vendor Discounting
- Discounting rates have been rising as the stock of properties listed for sale has increased, giving buyers greater scope for negotiation.
- Across the combined capitals, the median vendor discount rose to 3.6% (from 3.0% in the March quarter).
- Disounting in regional areas has been steadier, moving to 3.5% (from 3.3% in Q1).
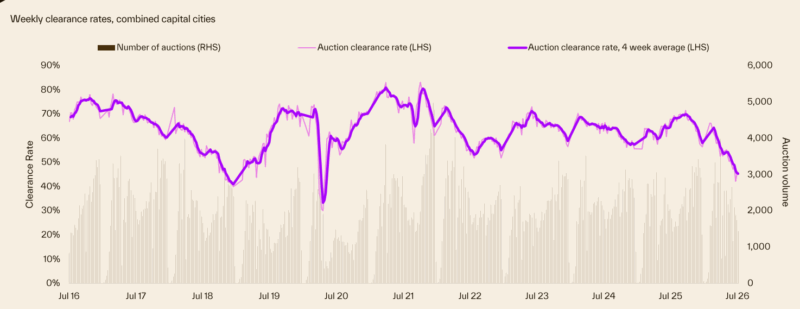
Auction clearance rates
- After reaching a peak of approximately 66% in early February, clearance rates have eased steadily in the months since.
- The combined capital city 4 -week average fell below the 60% threshold in mid -March and continued to trend lower through the first half of 2026, reaching the low 40 per cent level in June.
- Given the serie skews towards Melbourne and Sydney, the downward trend largely reflects easing demand, and rising supply across these two large auction markets.
- We update the weekly auction clearance results here each week.
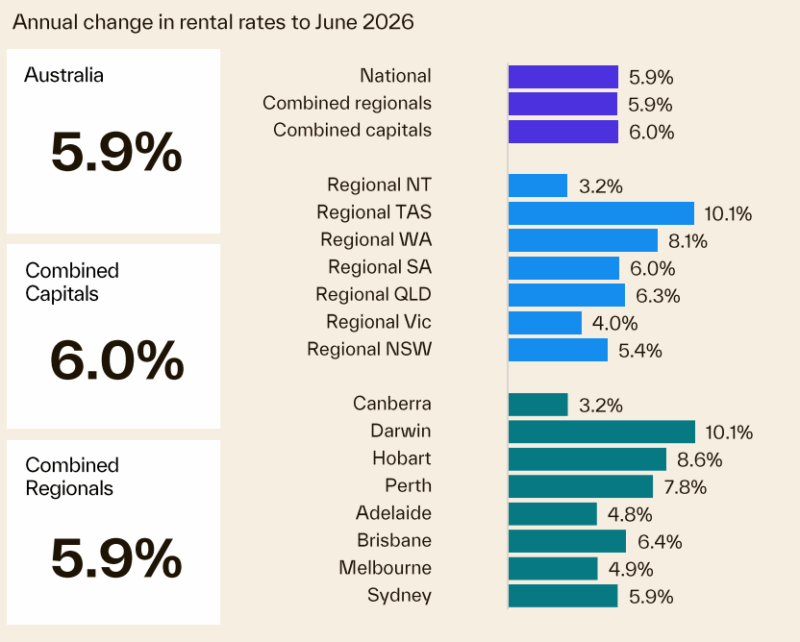
We're still experiencing a rental market crisis in Australia.
- Vacancies are still tight.
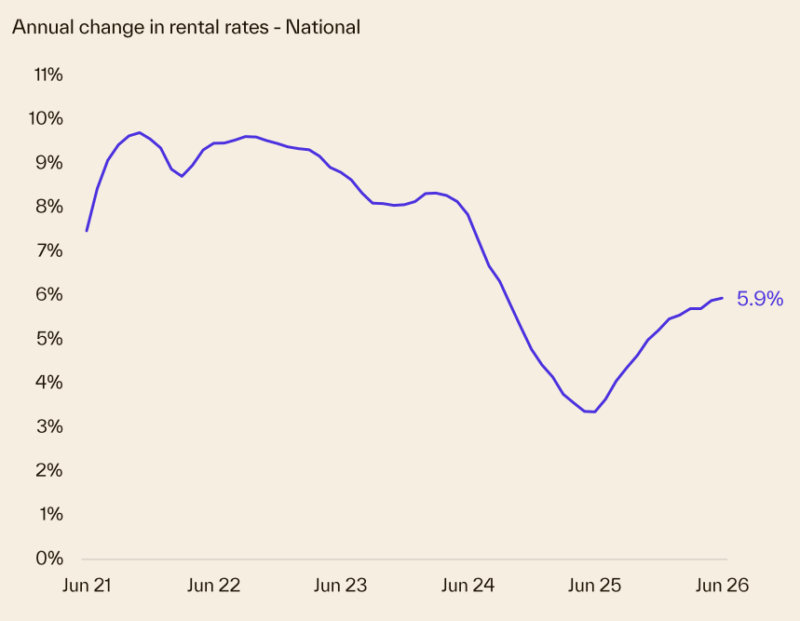
- National rents grew 5.9% over the year to June 2026, up from a mid - 2025 low of 3.4%, and the pickup is evident across both capital cities and regional markets.
- Growth is well below the rates recorded between 2021 and 2024, which suggests the market is firm but growing at a more moderate pace than a few years ago.
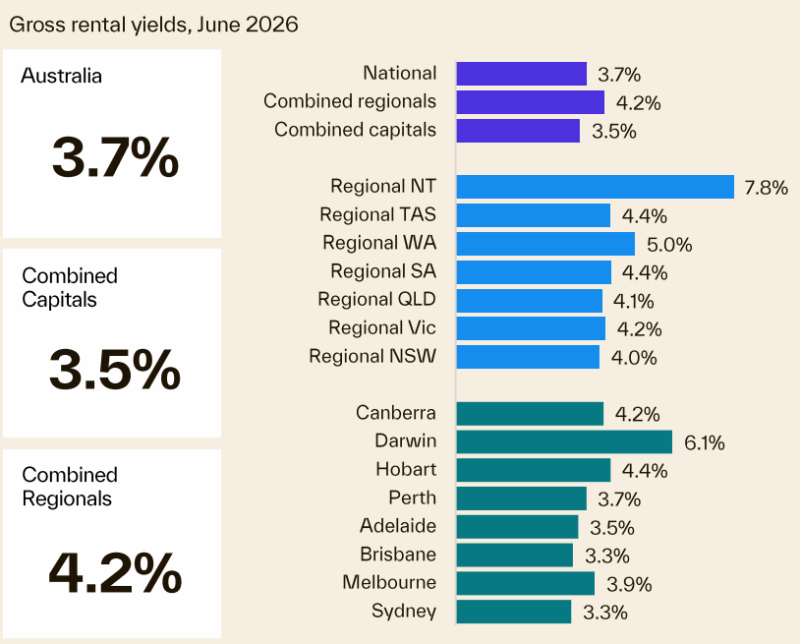
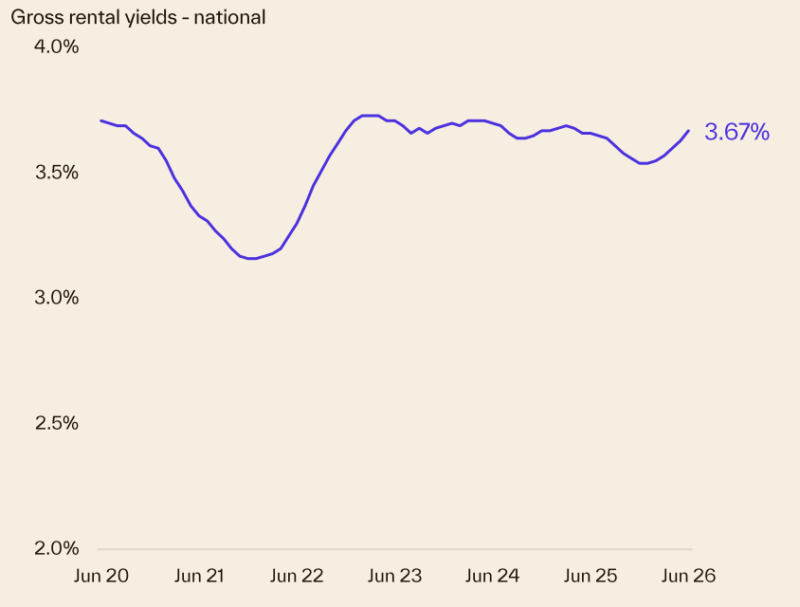
- National gross rental yields have edged up to around 3.7% as rents continue to increase while home values ease.
- Yields have increased from their 2022 low point of 3.2%.
- Regional areas continue to outperform the capitals on rental yield, at 4.2%, compared with 3.5% across the capitals, with regional NT (7.8%) and Darwin (6.1%) out in front.
- Sydney and Brisbane (both 3.3%), along with Adelaide (3.5%) are sitting at the softer end.
Dwelling approvals and housing credit
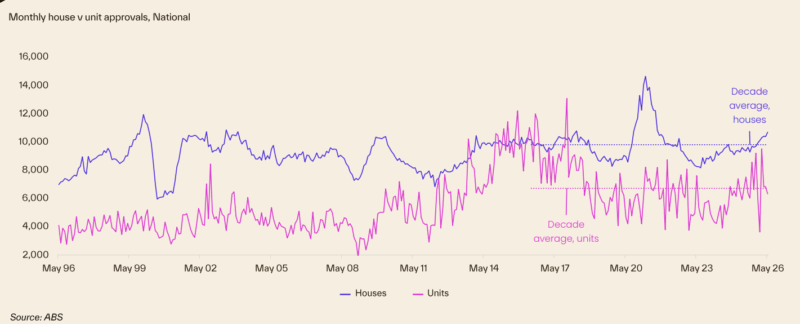
- Unit approvals dropped to 6,325 in May 2026, down sharply from the February high, with high construction costs making apartments tough to finance and get off the ground.
- House approvals climbed to 10,694, up 13.2% on the same time a year ago and running 9.1% above the decade average, helped along by smaller builds, quicker construction and owner - builders.
- Quarter - on - quarter commencements fell 11.2%, led by a 19.8% drop in apartments, with house commencements also declining by 3.6%.
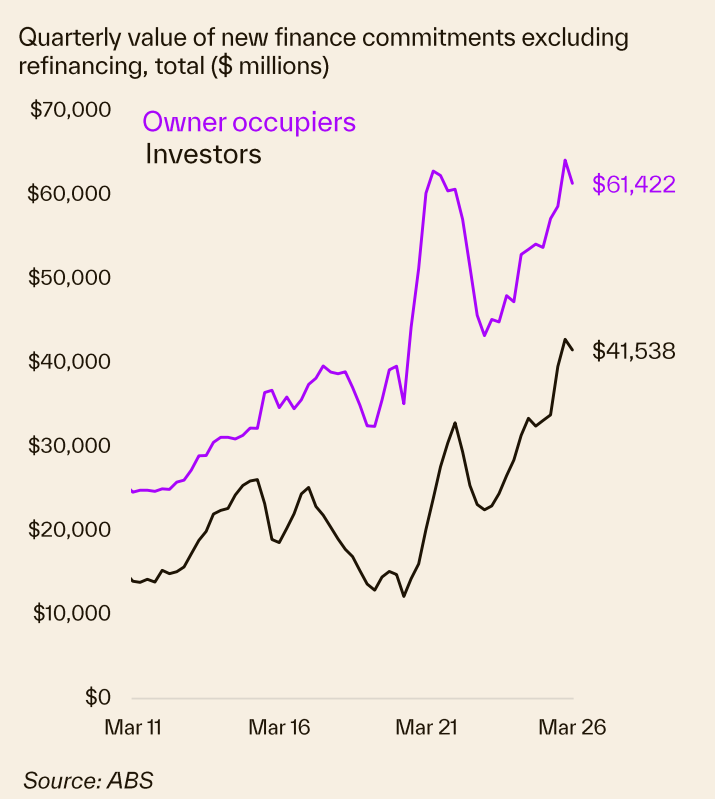
Finance and Lending
- From a peak in December 2025, the value of home lending fell 3.8% in the March quarter.
- The decline was broad based across borrower types but led by owner - occupiers (down 4.3%) ahead of investors (down 3.0%).
- This saw the investor share of lending rise to its highest rate since September 2016.
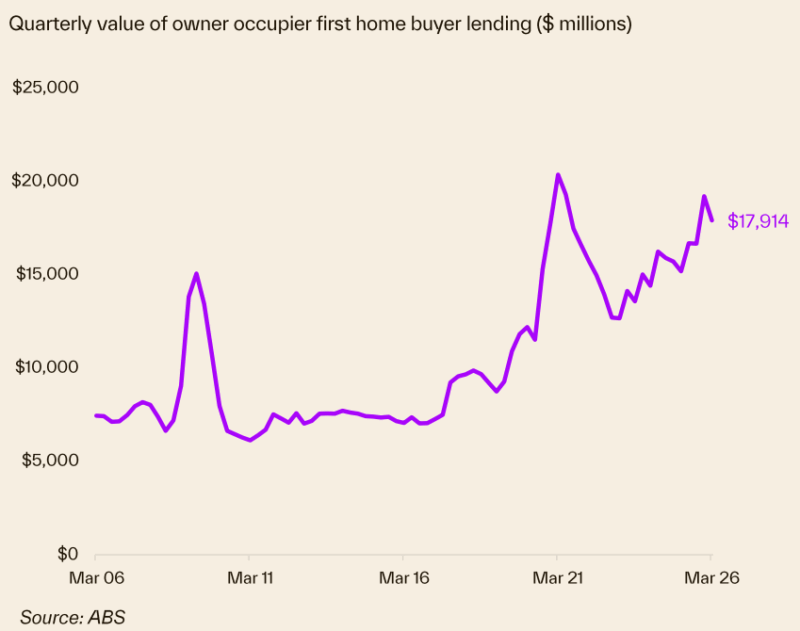
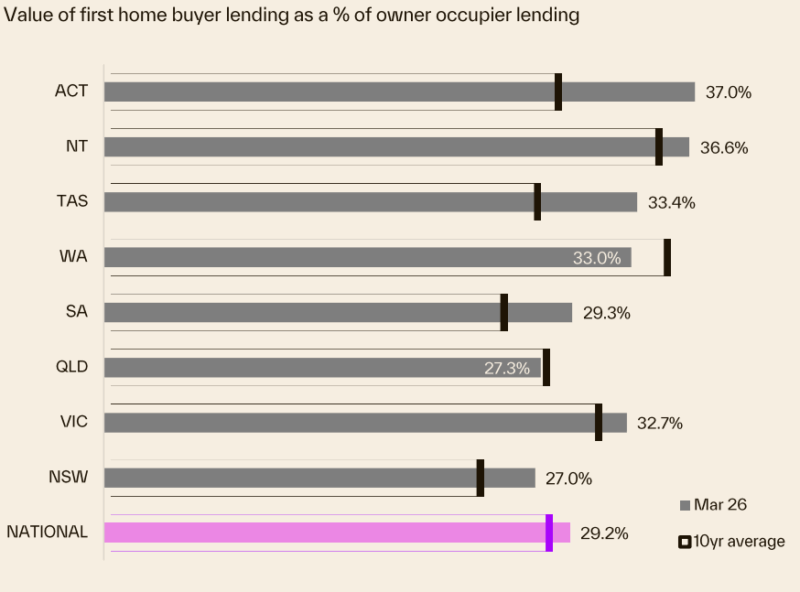
- First - home buyer lending as a proportion of owner - occupier lending reached 29.0%, slightly exceeding the decade average of 27.6%.
- This increase highlights a rise in first - home buyer activity following the expansion of the 5% deposit guarantee.
- ACT remains the strongest market for first - home buyers at 37.0%, followed by the NT (36.6%) and TAS (33.4%), with all three regions sitting significantly above their respective ten - year averages.
- Coversely, QLD and NSW continue to represent the smallest shares at 27.0%.
- Specifically QLD's share remains below its ten - year average of 27.3%.
Source of charts: Cotality Monthly Housing Chart Pack, Jule 2026
- Also read:This week’s Australian Property Market Update – Latest Data, State by State July 28th 2026

- Also read:Melbourne property market forecast for 2026 & 2027 | Separating the fundamentals from the sentiment

- Also read:53 years of valid reasons not to invest

- Also read:Brisbane Property Market Forecast [2026 & Beyond] – What The Olympics Decade Means for Investors.

- Also read:Sydney property market forecast for 2026 and 2027 | Why the short-term softness is a long-term opportunity


