


Key takeaways
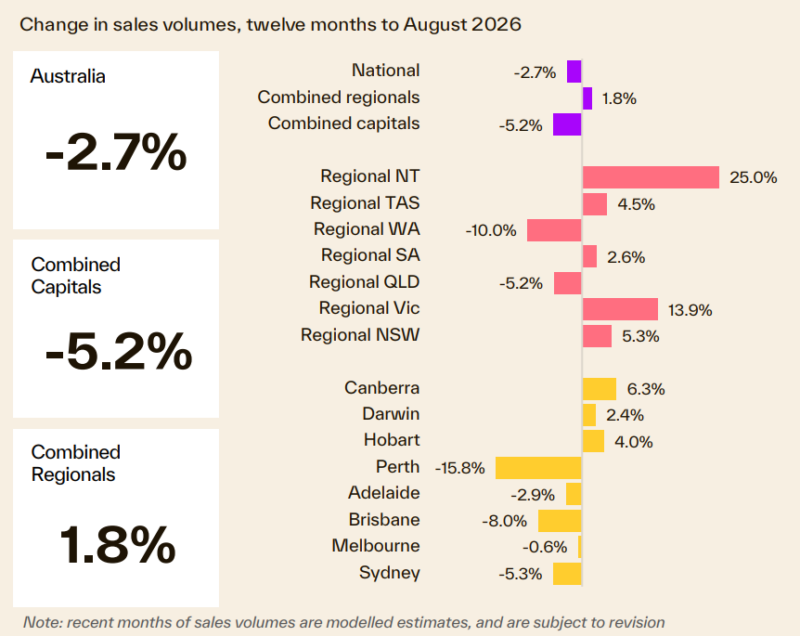
National annual sales fell 2.7% over the year to August, with capital city volumes down 5.2% while regional sales rose 1.8%.
Higher-value homes have led the downturn in Australia's largest cities, with upper-quartile house values down 10.7% from peak in Sydney and 10.5% in Melbourne.
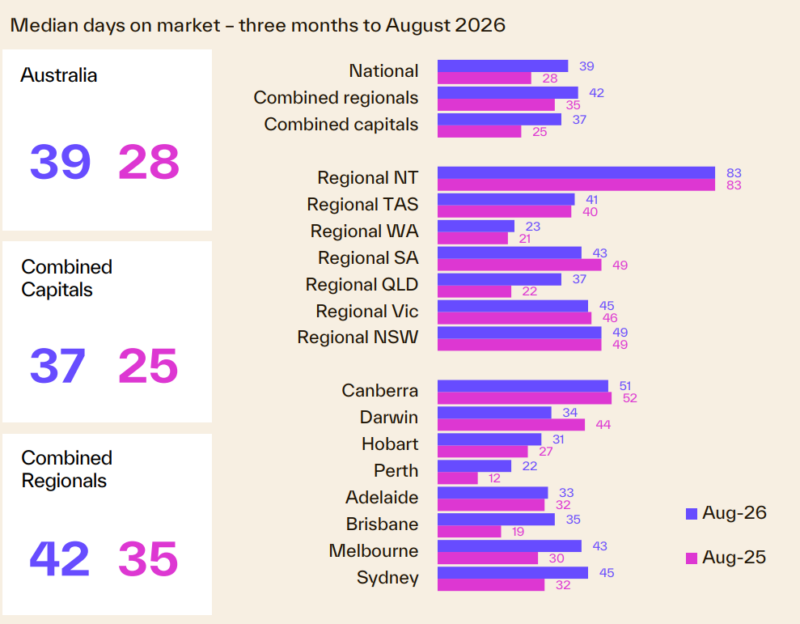
Selling conditions continue to soften, with the median time on market increasing to 39 days, up from 28 days a year ago.
National annual sales declined 2.7% over the year to August, with capital city sales down 5.2% and regional sales rising 1.8%.
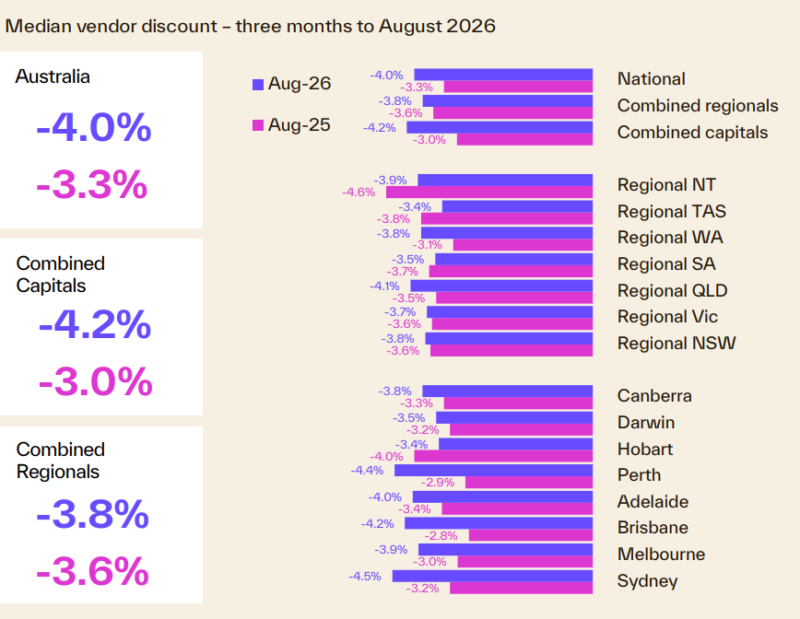
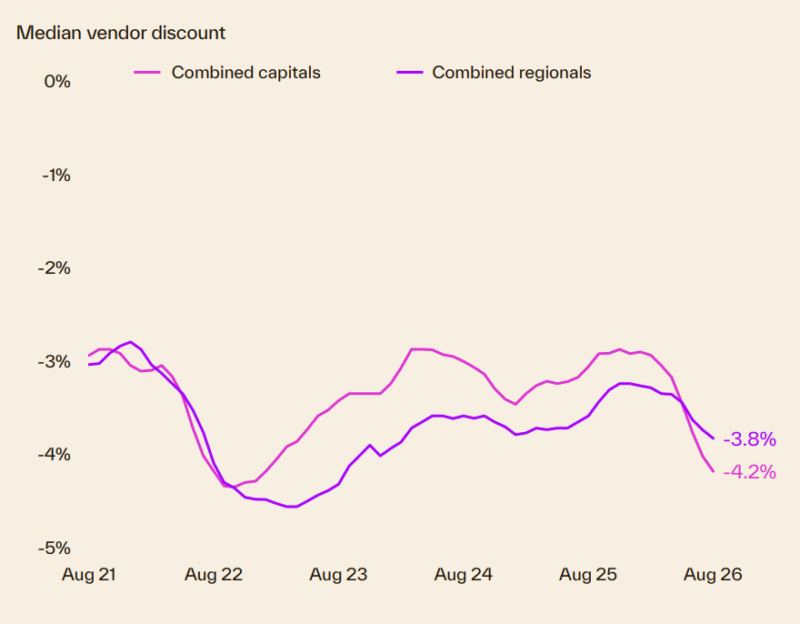
Vendor discounting widened, with the median discount across the capitals reaching 4.2%, the highest level since January 2023.
Total listings rose to more than 139,100 properties, up 18.1% year-on-year and now 2.2% above the five-year average.
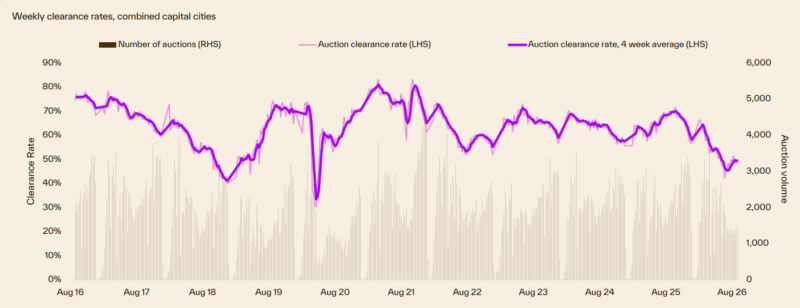
The four-week average auction clearance rate was 49.5% at the end of August and has remained below 50% since early June.
There is no doubt that our housing markets are facing challenges from all directions, but clearly they have remained more resilient than the property pessimists had predicted.
To better understand what's happening, this monthly collection of charts from Cotality paints an interesting picture.
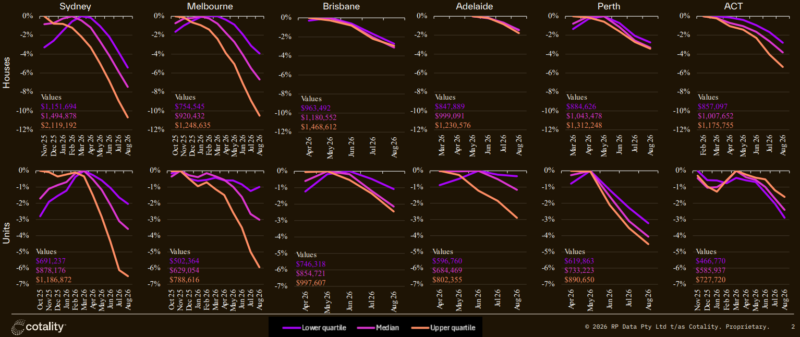
According to Cotality, Australia's most expensive homes are leading the housing downturn, with upper-quartile house values in Sydney and Melbourne now more than 10% below their peak levels, while lower-priced homes and units continue to show greater resilience.
Cotality's September Chart of the Month examines how housing values are tracking across different price segments, revealing the sharpest falls have occurred at the top end of the market.
Among Australia's largest cities, upper-quartile house values are now 10.7% below peak in Sydney and 10.5% lower in Melbourne, highlighting the extent to which higher-value properties have driven the downturn.
Cotality Head of Research Gerard Burg said the downturn has broadened over time, spreading beyond the premium markets where it first emerged.
He said:
"Early in the cycle, falling home values were largely confined to higher-priced properties in Sydney, Melbourne and Canberra.
More recently, however, home values have also started declining across Brisbane, Adelaide and Perth, demonstrating that the downturn is now affecting a broader range of markets.
While the market correction has become more widespread, the largest declines continue to be concentrated among higher-value homes."
Mr Burg said the timing and scale of declines varied across cities.
"Higher-value dwellings in Sydney, Melbourne and Canberra were the first to turn and continue to record the largest cumulative falls.
Upper-quartile houses in Sydney and Melbourne are now more than 10% below their cyclical peaks, underscoring the role premium housing has played in driving the downturn."
In contrast, price declines across Brisbane, Adelaide and Perth have been more evenly distributed across value segments, reflecting their later entry into the downturn."
However, Mr Burg noted there were exceptions to the broader trend:
"Canberra's unit market has bucked the pattern, with lower-value units recording larger declines than their higher-value counterparts.
Lower-quartile unit values in Canberra are down 2.9% from peak levels compared with a decline of 1.6% across the upper quartile, reflecting an overhang of more affordable stock."
The divergence between upper and lower-value housing remains most pronounced in Melbourne and Sydney.
The gap between cumulative declines across upper and lower-quartile houses has reached 6.6 percentage points in Melbourne and 5.3 percentage points in Sydney.
By comparison, the difference is less than one percentage point in Perth, Adelaide and Brisbane.
How do units compare?
Mr Burg said a similar trend was evident across the unit market, although the differences between value segments were less pronounced than for houses:
"Units have generally proven more resilient throughout the downturn, supported by their relative affordability and lower entry price points.
While higher-value units have generally recorded larger declines than lower-value stock, the gap is smaller than what we are seeing across detached housing."
The difference between upper and lower-quartile unit declines is widest in Melbourne and Sydney at 4.9 and 4.5 percentage points respectively, compared with 2.6 percentage points in Adelaide, 1.4 percentage points in Brisbane and 1.3 percentage points in Perth.
However, there were some notable exceptions:
"Perth's unit market has recorded larger declines than houses across every value segment, while upper-quartile units in Adelaide have fallen further than upper-quartile houses.
Despite these exceptions, affordability has generally helped support demand for units and cushion value declines relative to detached housing."
Residential real estate underpins Australia's wealth
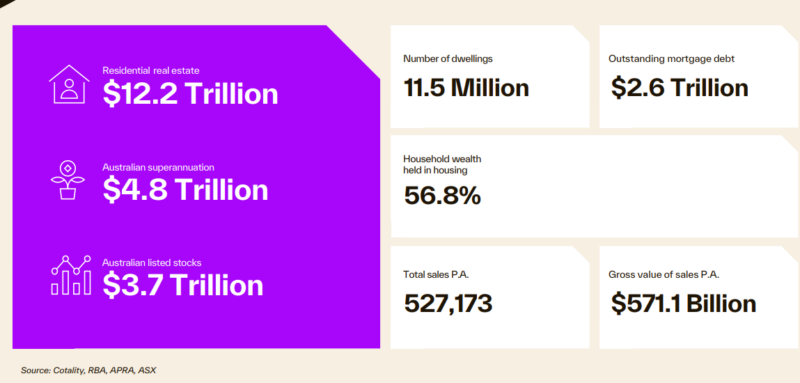
- The total value of Australian residential real estate was $12.2 trillion at the end of August 2026.
- Outstanding mortgages against all residential housing are only $2.6 trillion - a very comfortable 20% Loan to Value ratio.
- 56.8% of total Aussie household wealth is held in residential property - one of the many reasons neither the banks, the government nor the RBA wants a property crash.
Australian dwelling values
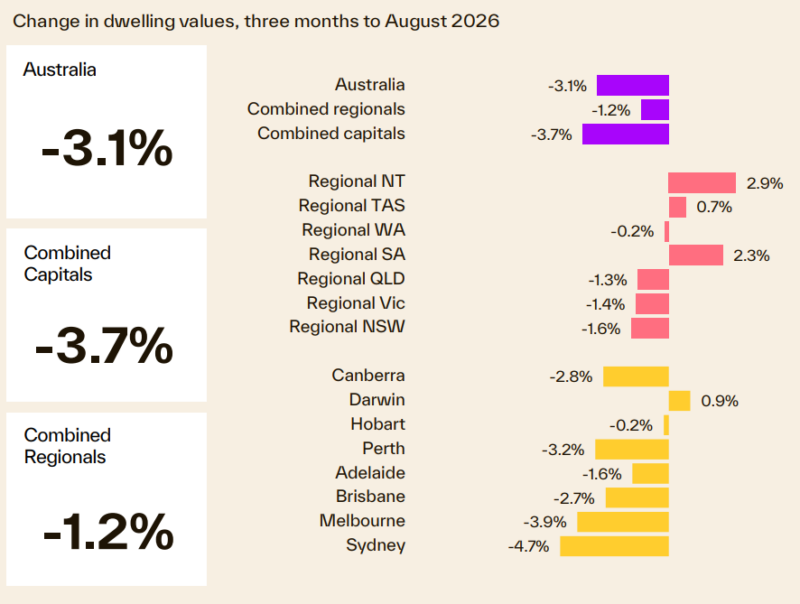
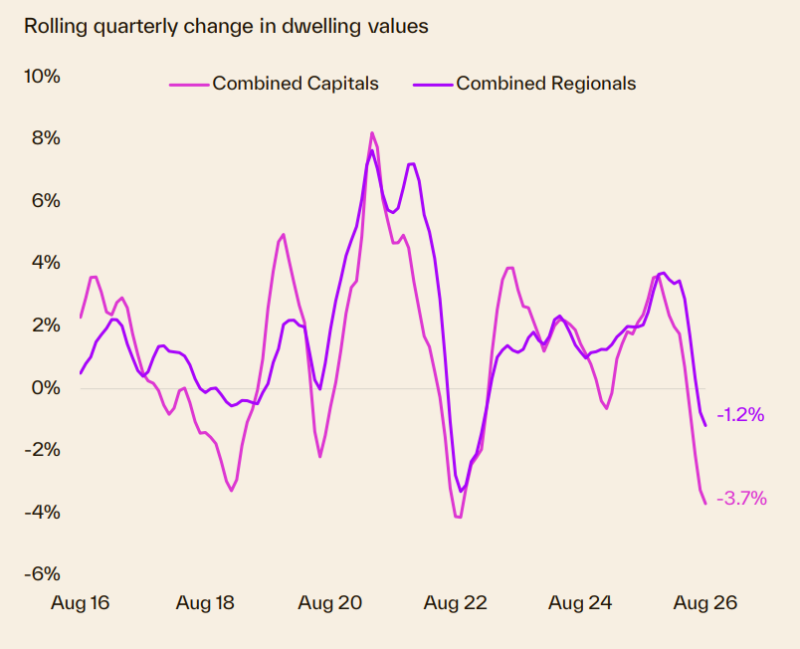
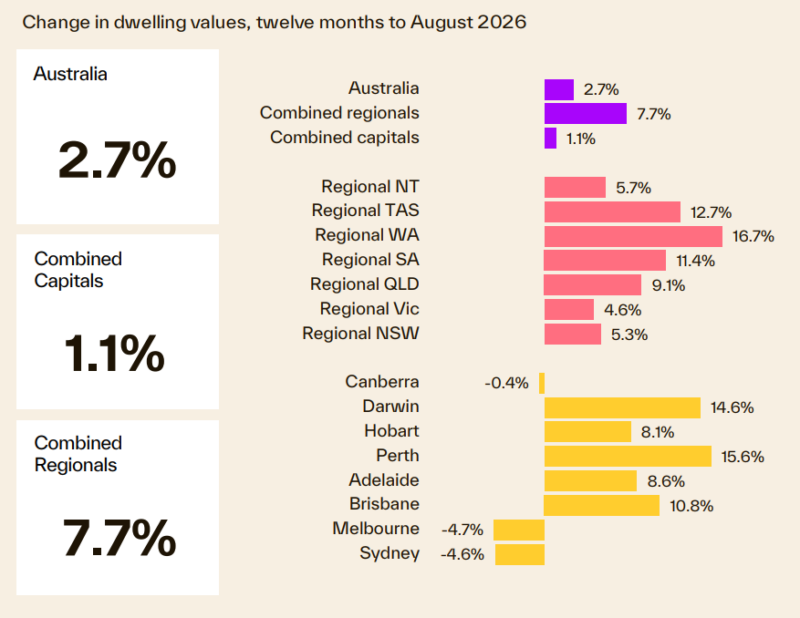
- The rolling quarterly trend for national dwelling values was down 3.1% over the three months to August.
- The annual growth trend eased further, with the national Home Value Index up 2.7% over the year to August, adding roughly $24,648 to the median Australian dwelling value.
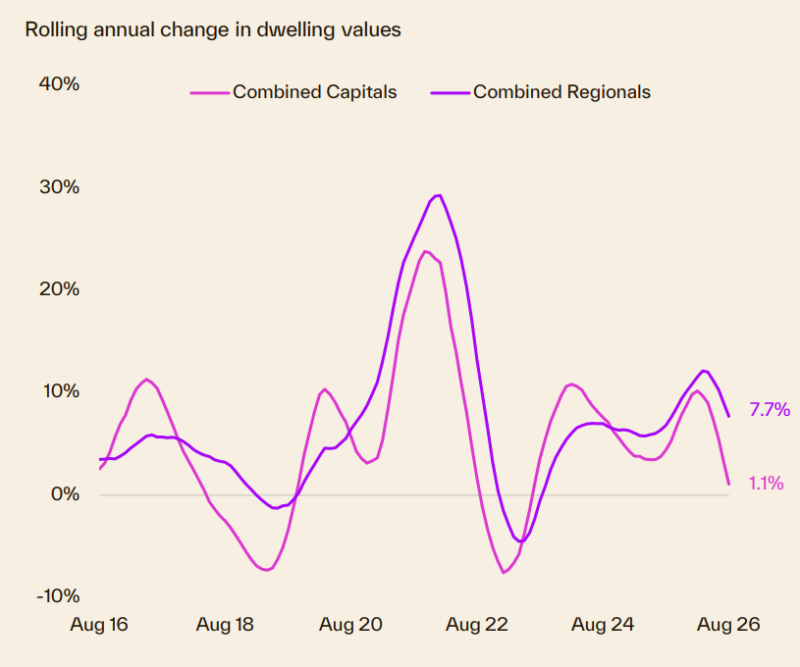
- Dwelling values across both the combined capitals and regional markets declined over the quarter, falling 3.7% and 1.2% respectively.
- However, as a property investor, you can always outperform the average.
Our capital city markets are fragmented
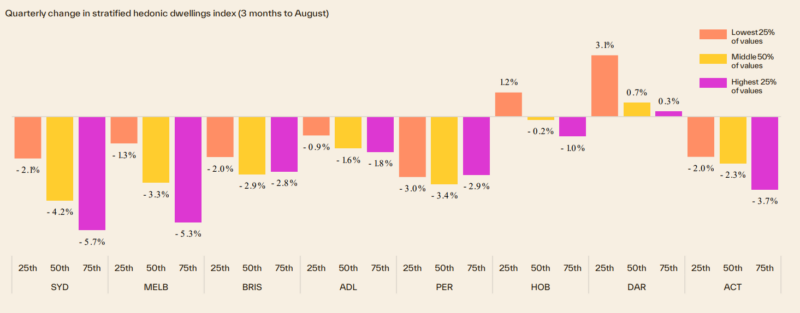
Our housing markets are fragmented, with each state performing differently depending on local economic and market factors.
The following chart shows how different price segments in each capital city market are performing.
Each State is running its own race
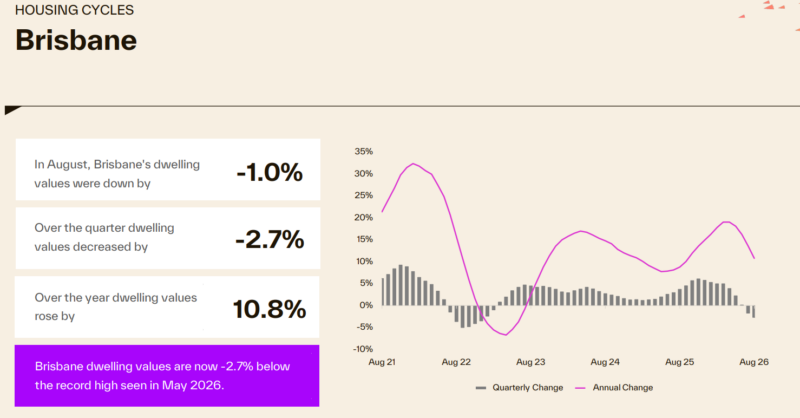
Brisbane property values are now -2.7% below the record high seen in May 2026.
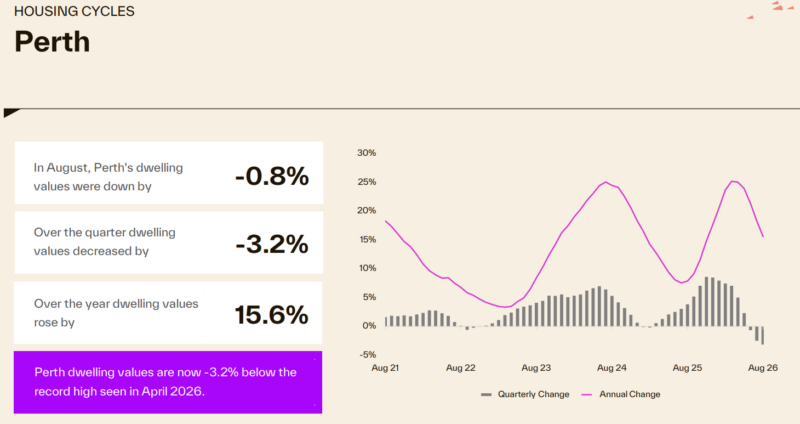
- Perth property values are also down -3.2% from the record high seen in April 2026.
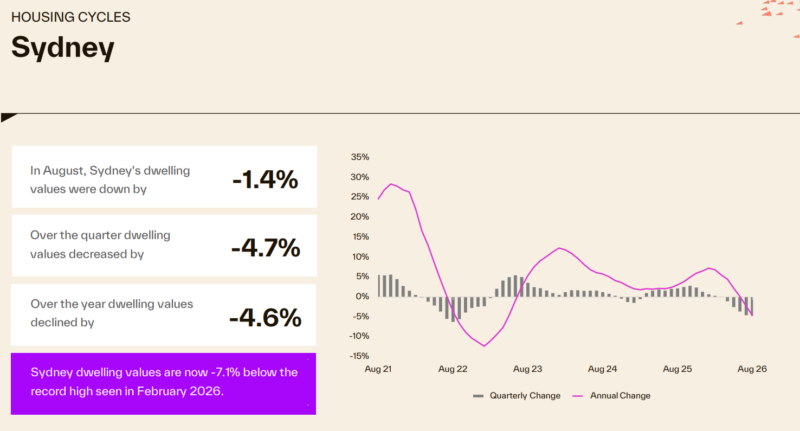
- Sydney property values are now -7.1% below the record high seen in February 2026.
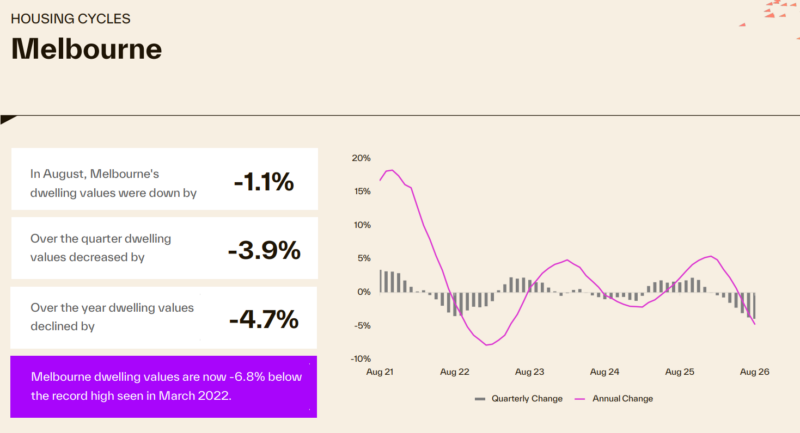
- Melbourne property values decreased -1.1% for August, also decreased -4.7% over the year, and are now -6.8% below the record high seen in March 2022.
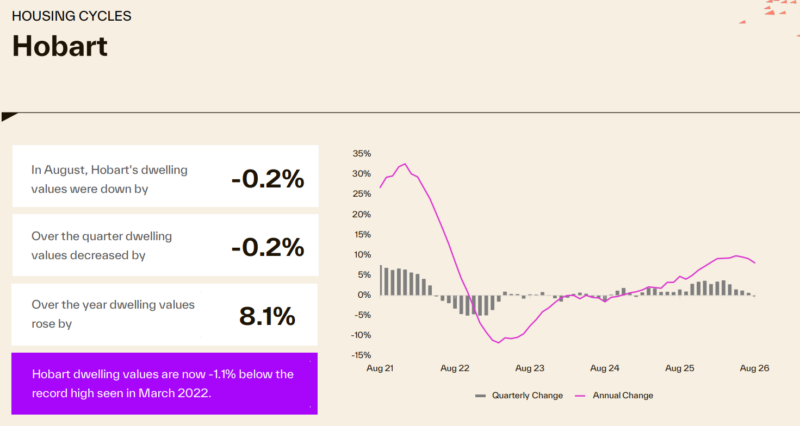
- Hobart house prices are -1.1 % below their record highs recorded in March 2022.
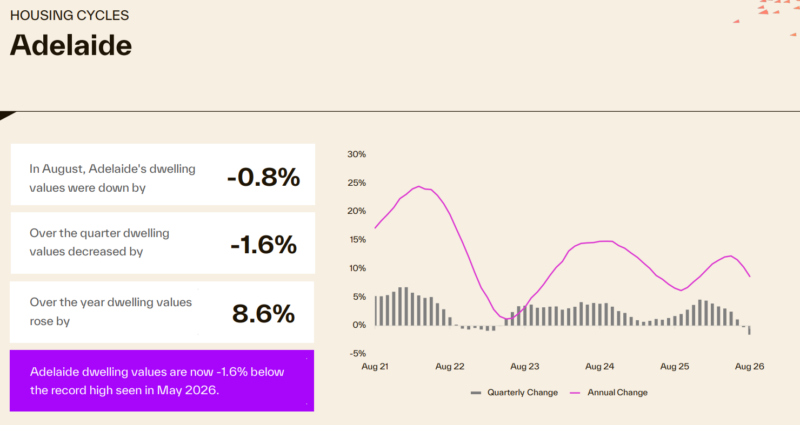
Here's how the Adelaide property market performed.
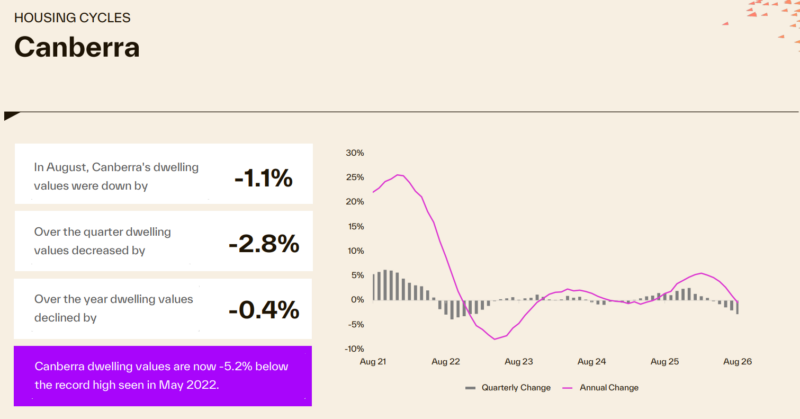
- Dwelling values in Canberra are down by -0.4% over the last year, and are also currently down - 5.2% below their record high seen in May 2022.
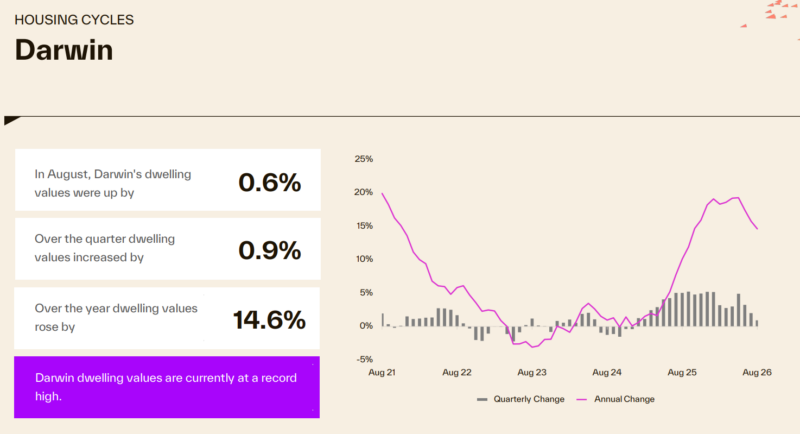
- The Darwin housing market has performed strongly, increasing 14.6% over the year and is currently at a new record high.
Here's how many properties are for sale at the moment
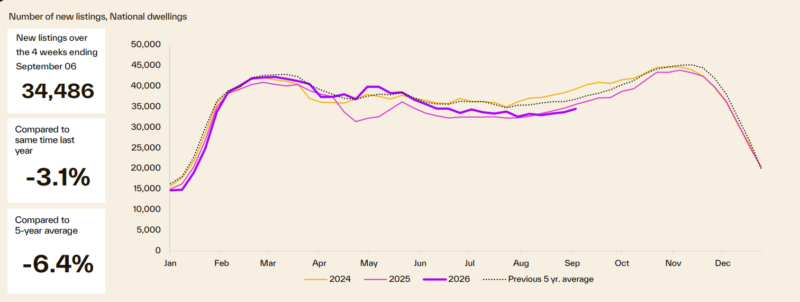
- The flow of new listings is 3.1% lower nationally than at the same time last year and 6.4% below the five-year average.
- New listing volumes have now fallen below the levels recorded over the past three years, reversing the trend seen earlier in the year, when listing activity was comparatively stronger, close to the five-year average and above year-ago levels.
- While listing volumes fluctuate in response to seasonal and cyclical factors, the recent slowdown in new listings may signal a cooler start to the spring selling season.
- The problem is that very few are A Grade homes or investment grade properties. Owners of quality properties are holding onto them.
- Total listings have risen to just over 139,100 in the four weeks ending 6 September, 2.2% above the five-year average after tracking well below the 5-year average and last year’s total listings since the start of the year (up 18.1%).
- The rise in total listings is attributable to several factors such as a reduction in buyer demand and longer selling times, with available housing stock accumulating as a result.
Transaction volumes
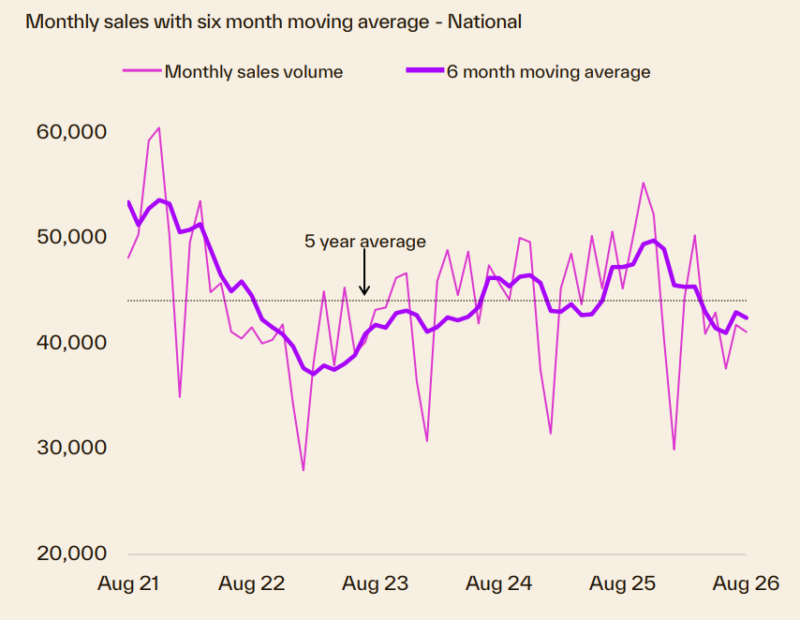
- According to Cotality, 41,118 homes were transacted through August, bringing the national 12-month rolling sales estimate to 527,173.
- Over the twelve months to August, national home sales fell 2.7%, with a clear divergence between the combined capital cities and the combined regional areas.
- Year-on-year sales volume fell 5.2% across the combined capital cities, while sales across the combined regional markets rose 1.8%.
Homes are taking slightly longer to sell
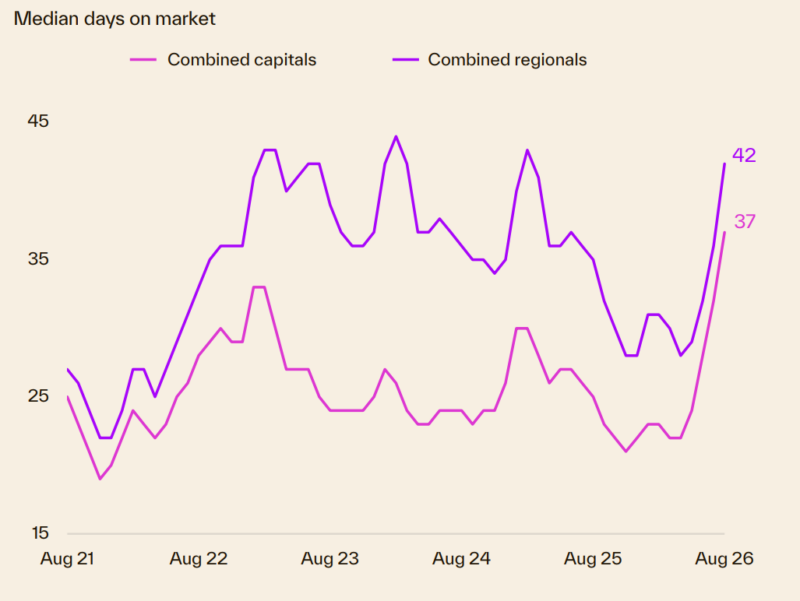
- Selling conditions continue to lose momentum, with homes taking a median of 39 days to sell, compared to 28 days a year earlier.
- Canberra is experiencing the longest median selling time at 51 days, while Sydney and Melbourne follow at 45 and 43 days, respectively.
- Perth is fastest at 22 days, though that is up from 12 days a year ago. Adelaide, Hobart, Darwin and Brisbane range from 31 to 35 days.
- The median time on market across regional areas has risen to 42 days, closely approaching the 43-day peak observed in February 2025.
Vendor Discounting
- Discounts have increased across the combined capitals, with the median vendor discount reaching 4.2% over the three months to August, the largest in at least two years.
- The median vendor discount for the combined regional areas increased from 3.3% in the first quarter of this year to 3.8%, the highest reading since January 2025.
- Nationally, the discount reached 4.0% from around 3.1% at the start of the year.
Auction clearance rates
- The four-week average auction clearance rate was tracking at 49.5% at the end of August, holding below 50% since early June.
- Clearance rates have risen slightly across Melbourne and Sydney but remain well below average, while Brisbane's four-week average clearance rate was the lowest at just 32.8%.
- The high share of properties being passed in suggests buyer and vendor price expectations remain misaligned.
- We update the weekly auction clearance results here each week.
We're still experiencing a rental market crisis in Australia.
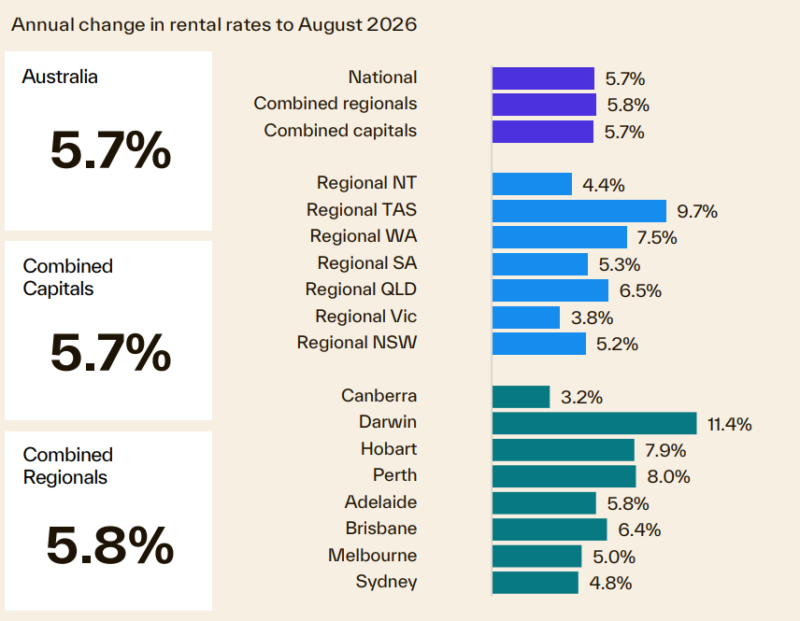
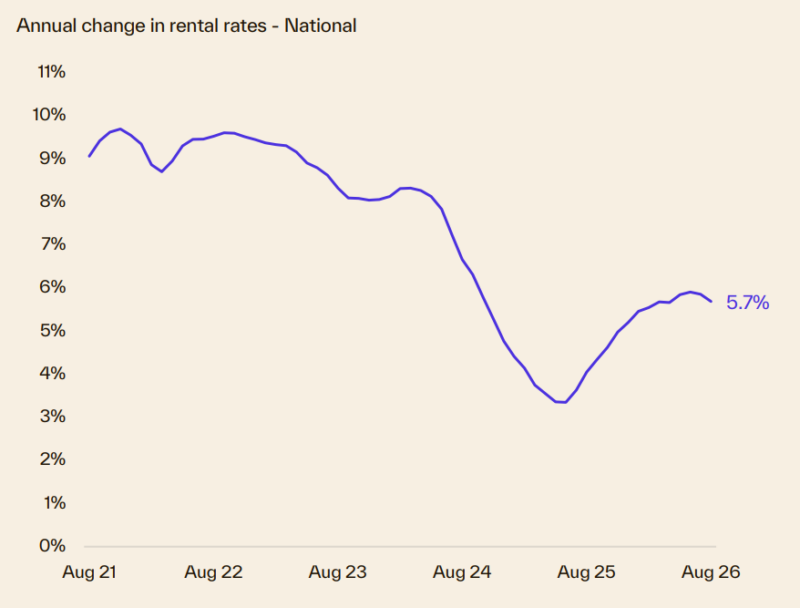
- The annual rate of growth in national rents was 5.7% in August, a slight easing from earlier months when the annual growth rate was 5.9%.
- Both the combined capitals (5.7%) and combined regionals (5.8%) are closely aligned, but rental growth differs a lot by city, with Darwin up 11.4% and regional Tasmania up 9.7%, while Canberra (3.2%), regional Victoria (3.8%), regional Northern Territory (4.4%) and Sydney (4.8%) are the weakest.
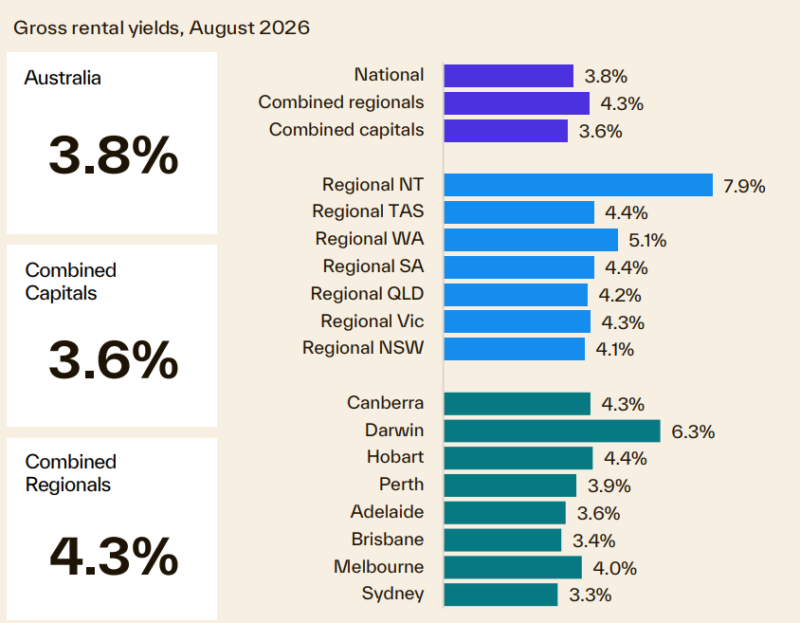
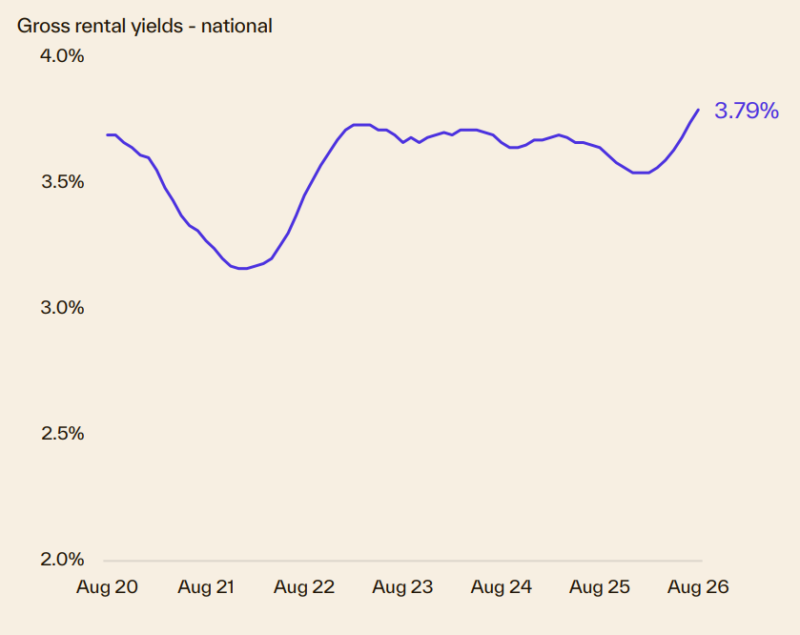
- Nationally, gross rental yields have risen to 3.8%, the highest since September 2019.
- Rental yields have increased every month since reaching a low of 3.5% in early 2026, having been around 3.7% through 2023 and 2024.
- The combined capitals have a gross yield of 3.6%, up from a low of about 3.3% in late 2025 and now at their highest since July 2019.
- Rental yields are likely to trend higher as home values fall and rents rise, but yields remain well below a cost neutral level, given high holding costs.
Dwelling approvals and housing credit
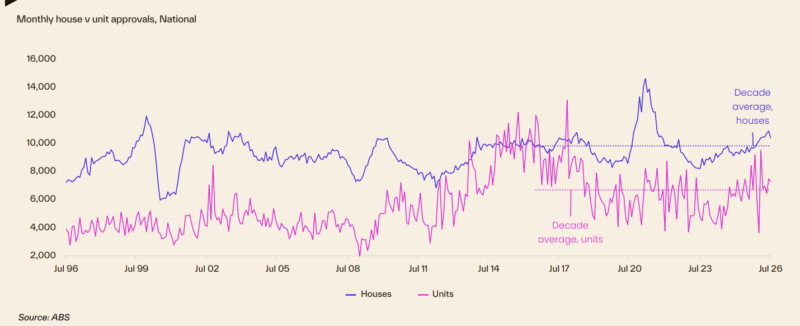
- Dwelling approvals have been on an upswing since early 2024, with total approvals in July up 9.0% on last year’s levels.
- House approvals have shown less volatility than units, but both sectors have recorded a sustained rise, with house approvals 5.9% above the decade average in July and unit approvals 9.1% higher than 10 year average levels.
Finance and Lending
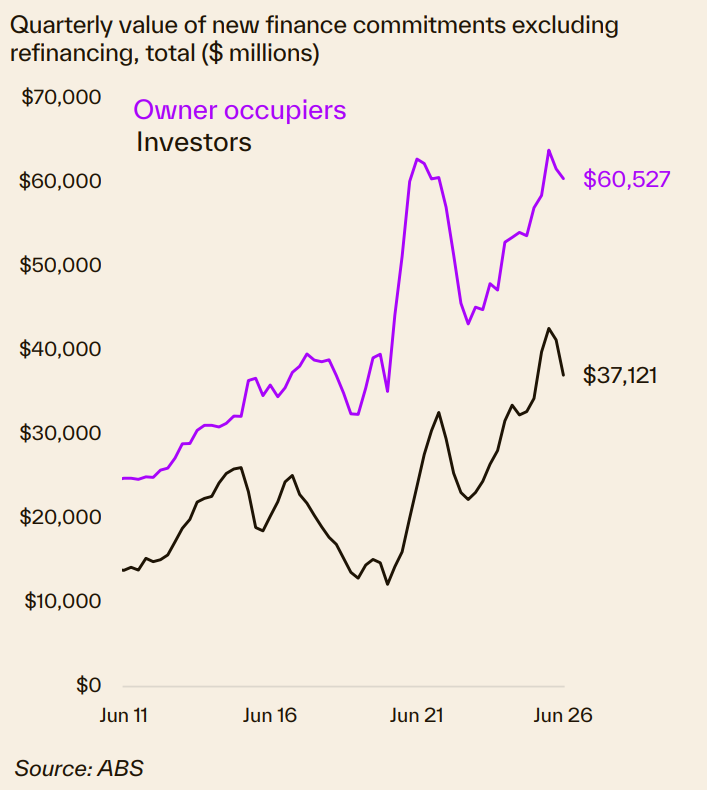
- The value of new housing finance commitments amounted to over $60 billion for owner occupiers and over $37 billion for investors during the June 2026 quarter, though both segments declined from their recent peaks.
- Most states are now recording an easing in the value of lending, with Tasmania the exception, where home lending has continued to trend higher.
- Home lending to investors fell sharply in the June quarter, down 10.2%.
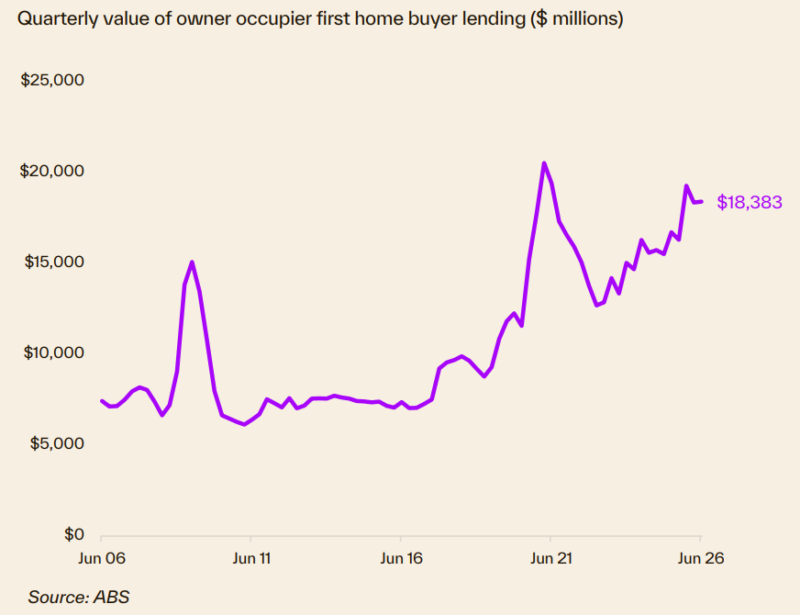
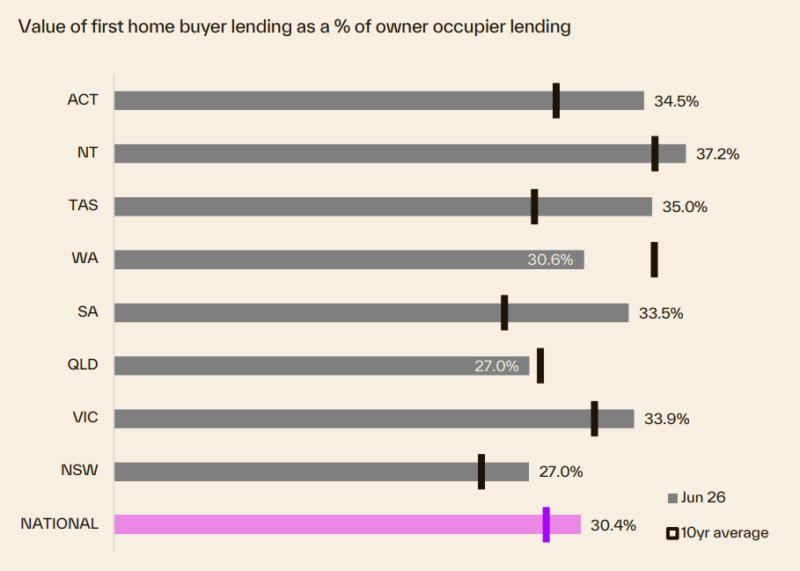
- First home buyer lending reached $18,383 million over the June quarter (30.4% of owner occupier lending).
- The NT, which is also the most affordable housing market, had the highest share (37.2%) of first home buyers lending, while NSW (27.0%) and Queensland (27.0%) were the lowest with Queensland below its ten-year average.
Source of charts: Cotality Monthly Housing Chart Pack, September 2026
- Also read:This week’s Australian Property Market Update – Latest Data, State by State September 22nd 2026

- Also read:Latest Property Price Forecasts. Australian Property Market Outlook 2026-2027: Navigating a Market Correction

- Also read:Brisbane Property Market Forecast [2026 & Beyond] – What The Olympics Decade Means for Investors.
- Also read:Sydney property market forecast for 2026 and 2027 | Why the short-term softness is a long-term opportunity

- Also read:Melbourne property market forecast for 2026 & 2027 | Separating the fundamentals from the sentiment