


Key takeaways
Cotality estimates the combined value of residential real estate rose to $11.7 trillion at the end of August.
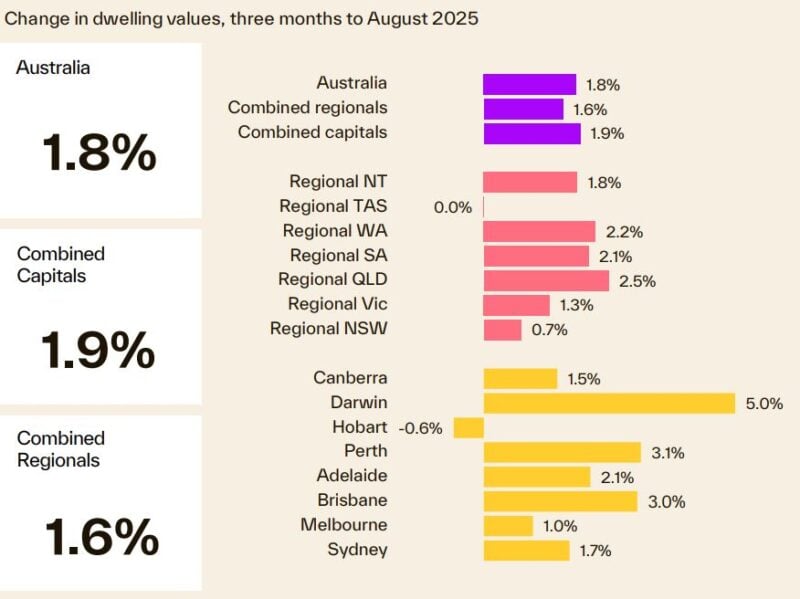
Momentum in national housing values has continued to build with dwelling values up 1.8% over the three months to August, the largest quarterly increase since Q2 2024 (2.0%).
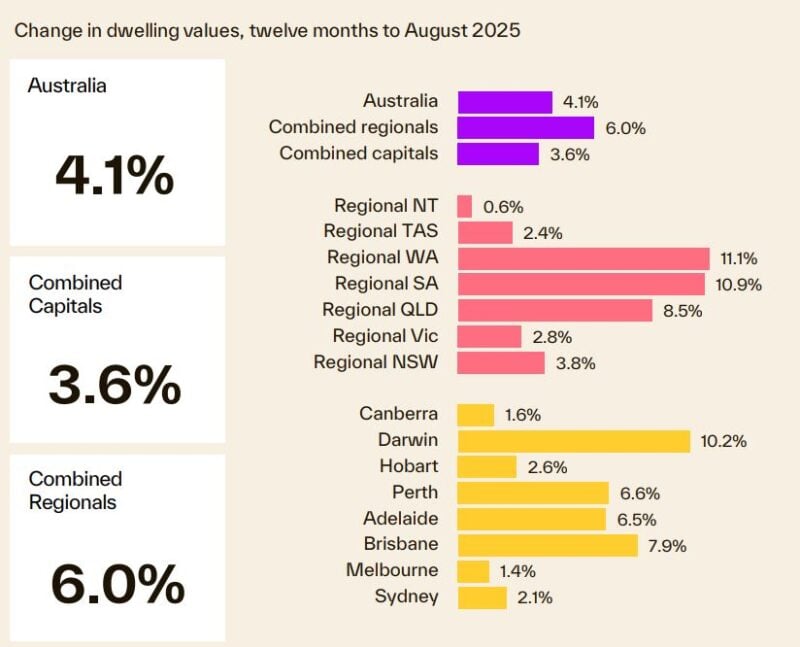
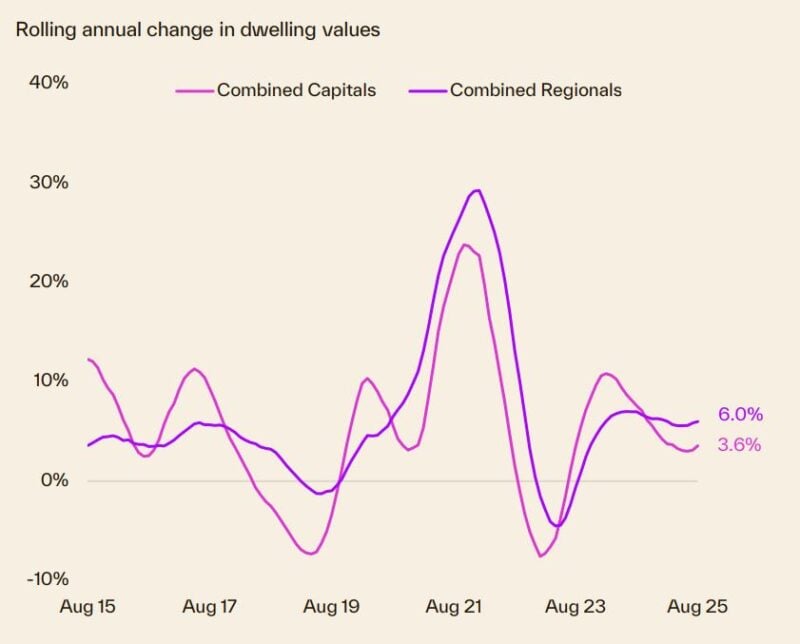
The annual growth trend also shifted higher for the second consecutive month, ramping up from a low of 3.6% over the 24/25 financial year to a 4.1% rise over the 12 months to August.
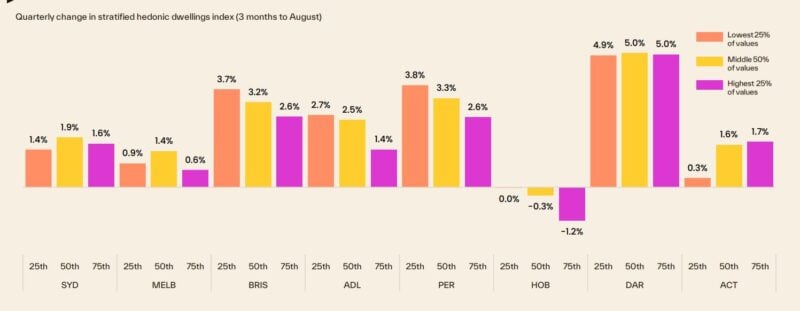
Growth in the most affordable 25% of combined capital city homes (2.1%) was outpaced by the middle 50% of market (2.2%) in the three months to August. This is significant because the bottom quartile has led market growth for almost two years.
The mid-sized capitals are once again driving growth, with values in Brisbane and Perth up 1.2% and 1.1% respectively in August. Darwin continues to lead the capitals for quarterly and annual growth, however, up 5.0% over the three months to August and 10.2% over the past 12 months.
Cotality estimates 43,436 sales occurred nationally in August, taking the rolling 12-month count to 538,329 — 2.0% higher than this time last year and 3.8% above the previous five-year average.
While down -10.3% from the level seen this time last year, and -1.3% shy of the previous five-year average, listing activity rose 9.4% in August, with easing interest rates, rising sentiment and stronger capital gain conditions setting the stage for a cracking spring selling season.
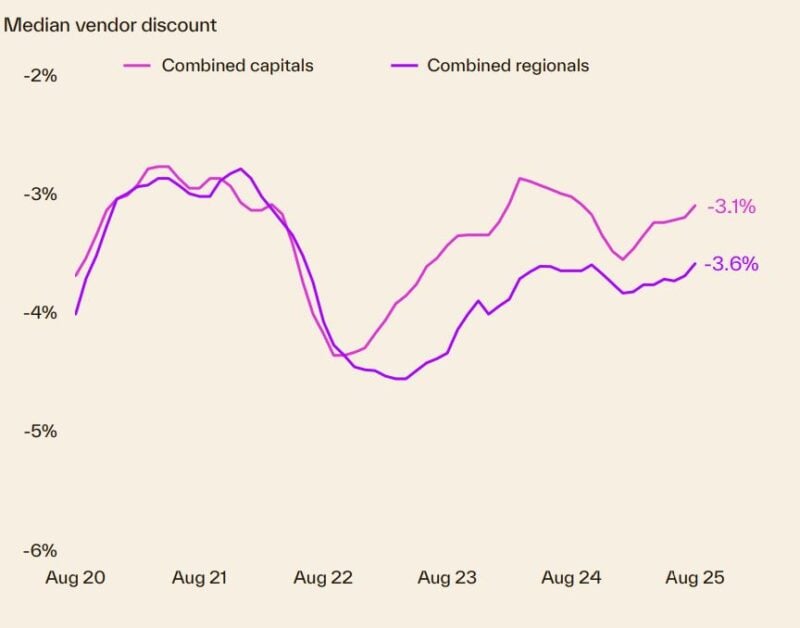
Both the combined capitals and regions have seen momentum build in rental trends. Since bottoming out in June, the 12-month change in capital city rents has lifted 70 basis points to 3.4%, while the change in regional rents shifted from 5.3% over the 24/25 Financial year, to 5.8% over the year to August.
Monthly dwelling approvals dropped -8.2% in July, following the massive 12.2% rise in June. The month-on-month decline was led by the unit segment, with approvals down -18.8%, while house approvals inched slightly higher over the month, up 0.6%.
Want to know what's happening to the housing markets around Australia?
Well... this monthly collection of charts from Cotality (formerly CoreLogic) paints an interesting picture.
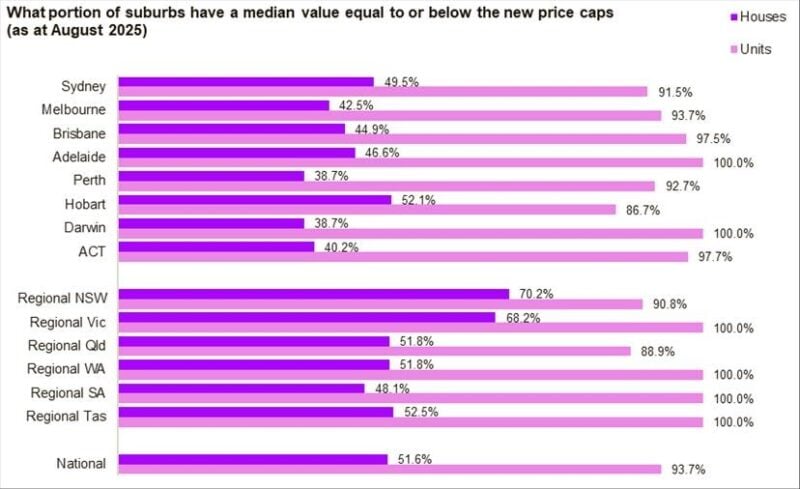
The fast-tracked expansion of the federal government's Home Guarantee Scheme, effective from October 1, is set to significantly increase the range of suburbs available to first home buyers, according to Cotality.
The scheme, which allows eligible first home buyers to avoid lenders mortgage insurance while purchasing a home with a 5% deposit, will now remove income and place limits, while also raising property price caps across most regions.
Under the old price caps, around a third of the 4,848 house and unit markets analysed nationally had a median value below the respective limits.
Under the expanded limits, this portion jumps to 63.1%, including 51.6% of house markets and 93.7% of unit markets.
Cotality Economist Kaytlin Ezzy says the new settings will empower first home buyers with greater choice, while helping to level the playing fields for those without access to the bank of mum and dad.
She further said:
“Previously, to qualify for the scheme, first home buyers were largely restricted to more affordable housing options, including units and houses in outer mortgage belts and regional markets
Under the old caps, first home buyers in Perth had access to just two suburbs with a median house value under the $600,000 limit, Medina ($590,786) and Mandurah ($589,965).
Choices in Brisbane and Adelaide were also largely limited to units, with only 36.9% and 41.3% of suburbs respectively falling under the old caps."
She further explained:
"Since the caps were last revised in 2022, values across the mid-sized capitals have grown significantly, which has seen first home buyers reliant on the scheme to purchase a house, essentially priced out.”
The new price caps represent a substantial increase for most regions and are designed to be more in line with each region's median house values.
For example, across Sydney and the Illawarra and Newcastle and Lake Macquarie regions, the cap has increased by $600,000 to $1.5 million. In Southeast Queensland and Adelaide, the caps have both increased by $300,000 to $1 million and $900,000 respectively."
Residential real estate underpins Australia's wealth
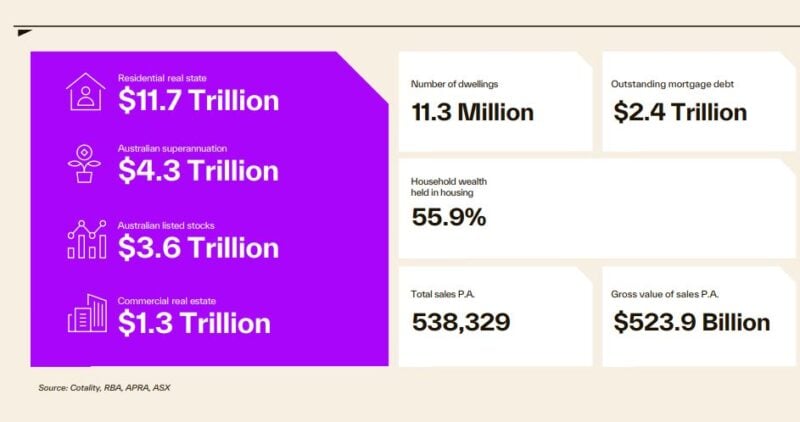
- The total value of Australian residential real estate was $11.7 trillion at the end of August 2025.
- Outstanding mortgages against all residential housing are only $2.4 trillion - a very comfortable 21% Loan to Value ratio.
- 55.9% of total Aussie household wealth is held in residential property - one of the many reasons neither the banks, the government nor the RBA wants a property crash.
Australian dwelling values
- Momentum in national housing values has continued to build with dwelling values up 1.8% over the three month to August, the largest quarterly increase since Q2 2024 (2.0%)
- The annual growth trend also shifted higher for the second consecutive month, ramping up from a low of 3.6% over the 24/25 financial year to a 4.1% rise over the 12 months to August.
- Growth in the most affordable 25% of combined capital city homes (2.1%) was outpaced by the middle 50% of market (2.2%) in the three months to August. This is significant because the bottom quartile has led market growth for almost 2 years.
- However, as a property investor you can always outperform the average.
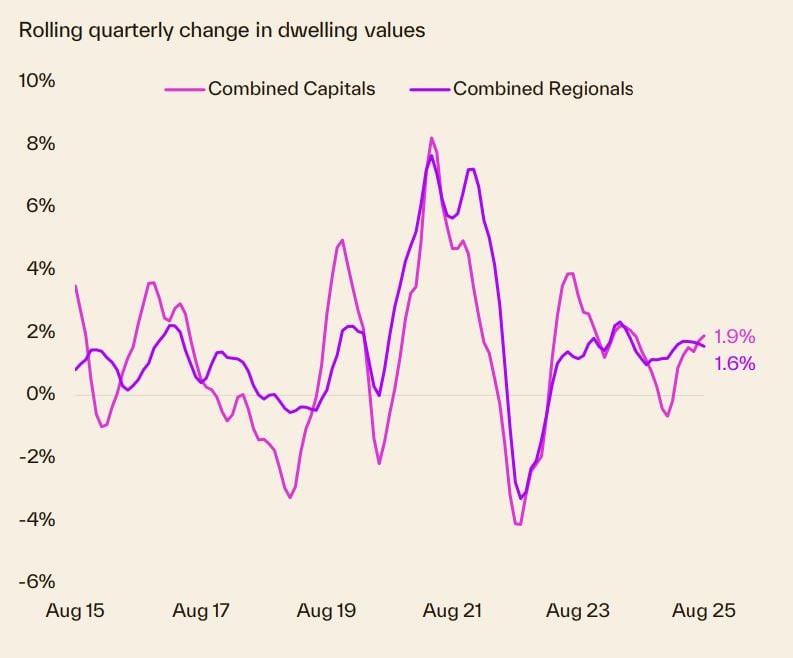
Our capital city markets are fragmented
Our housing markets are fragmented with each state performing differently depending on local economic and market factors.
At the beginning of this property cycle the upper quartile of the market lead the upswing in 2023, then for quite some time the lower quartile across every capital city has recorded a stronger outcome for housing values, now the middle 50% of the market is performing strongly.
The following chart shows how various price segments of each capital city market are performing differently.
Each State is running its own race
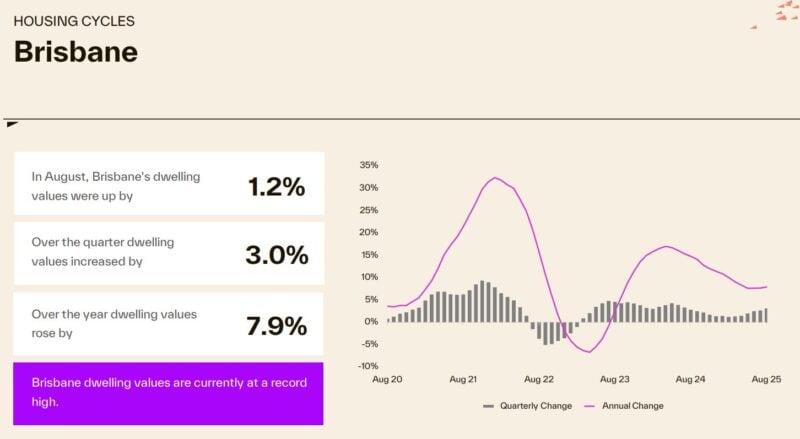
One star performer was Brisbane where property values increased 7.9% over the last year and are currently at a record high.
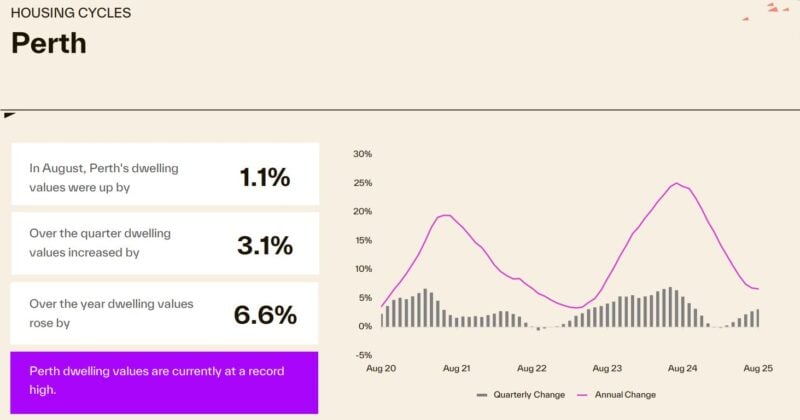
- Perth property values are up 6.6% over the year and are currently at a new record high.
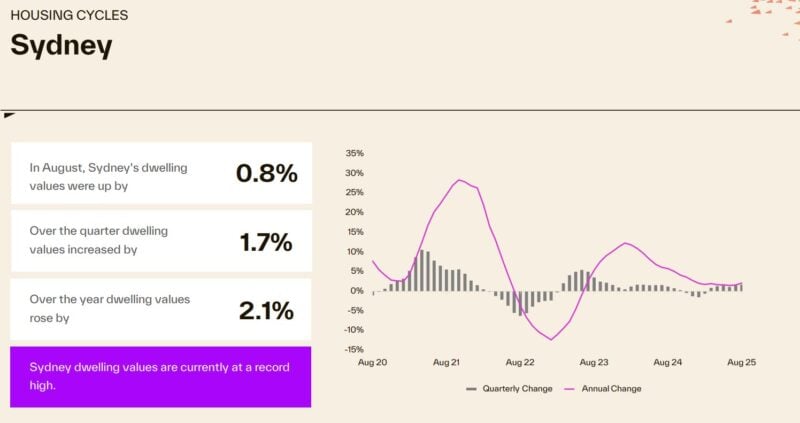
- Sydney property values increased 2.1% over the past year and are currently at a new record high.
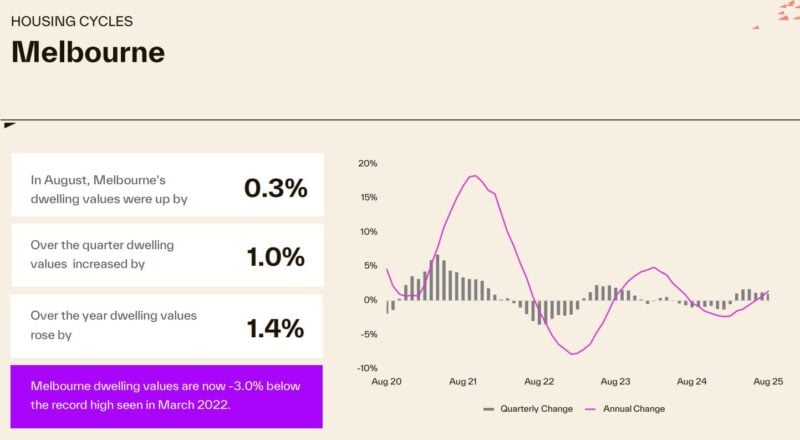
- Melbourne property values are up 0.3% in August, also rose 1.4% over the year, but are still -3% below its record high seen in March 2022.
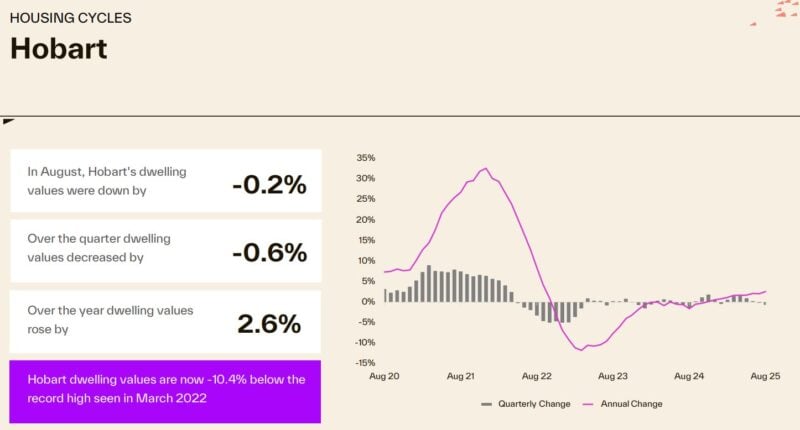
- In the previous darling of the housing markets, Hobart, house prices are -10.4 % below their record highs recorded in March 2022.
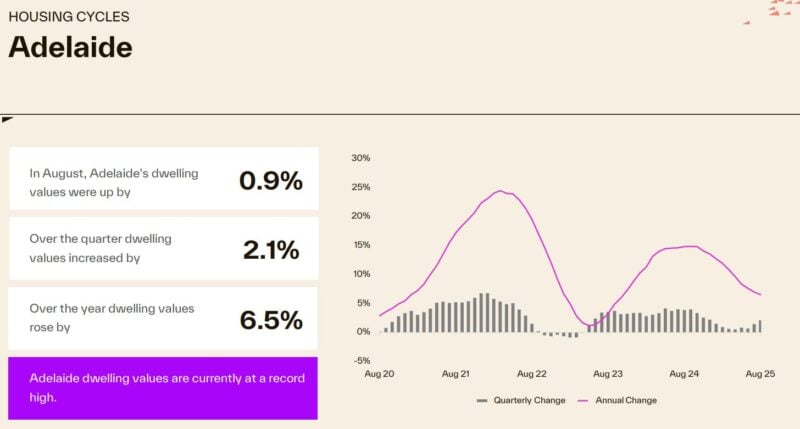
Here's how the Adelaide property market performed.
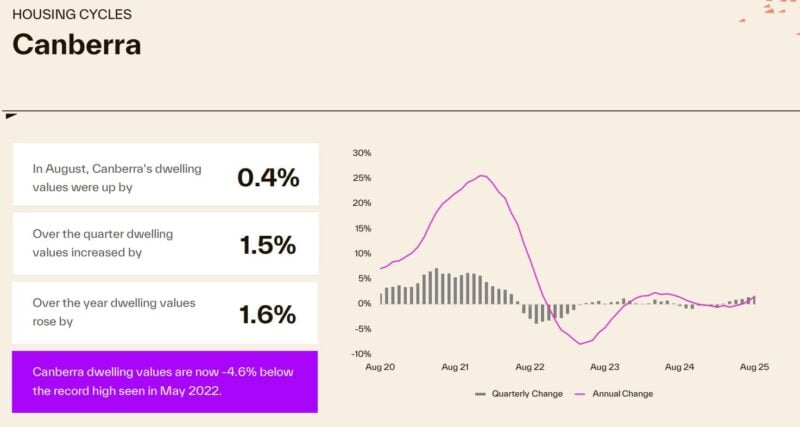
- Dwelling values in Canberra increased 1.6% over the last year.
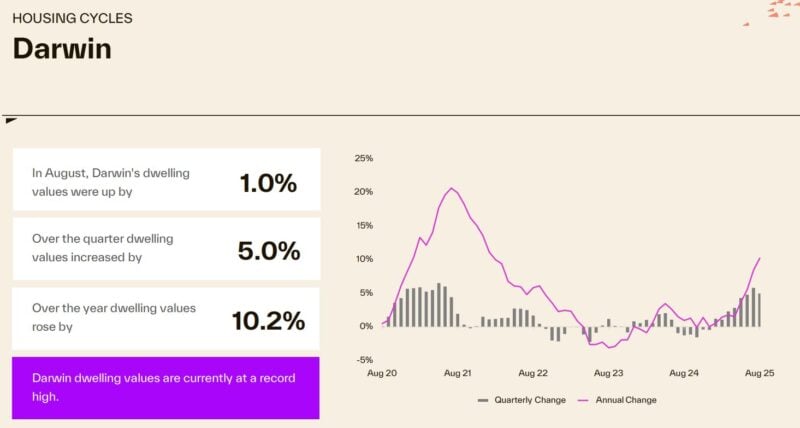
- The Darwin housing market has performed strongly increasing 10.2% last year and is currently at a new record high.
Here's how many properties are for sale at the moment
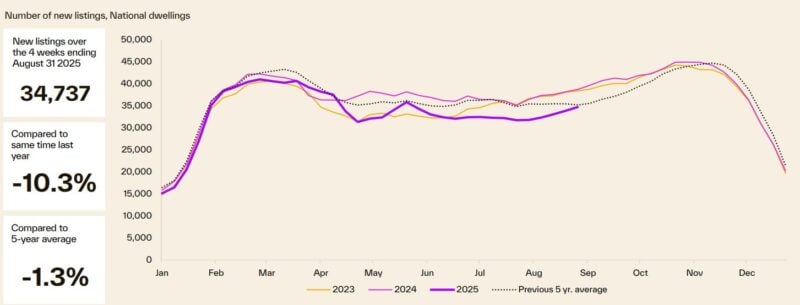
- The flow of new listings gained momentum in the final month of winter, with 34,737 newly advertised properties observed nationally over the four weeks to August 31st.
- While down -10.3% from the level seen this time last year, and -1.3% shy of the previous five-year average, listing activity rose 9.4% in August, with easing interest rates, rising sentiment and stronger capital gain conditions setting the stage for a cracking spring selling season.
- The problem is that very few are A Grade homes or investment grade properties. Owners of quality properties are still holding onto them.
- Despite freshly advertised stock shifting higher, total stock levels have continued to decline, with just 118,380 property observed for sale nationally, over the four weeks to August 31st.
- Since the start of winter, total listing levels have declined from -14.0% below the five-year average, to -20.2% below average, with properties being absorbed from the market faster from the market then they are added.
- Compared to this time last year, the 28-day count of listings is down -13.3%.
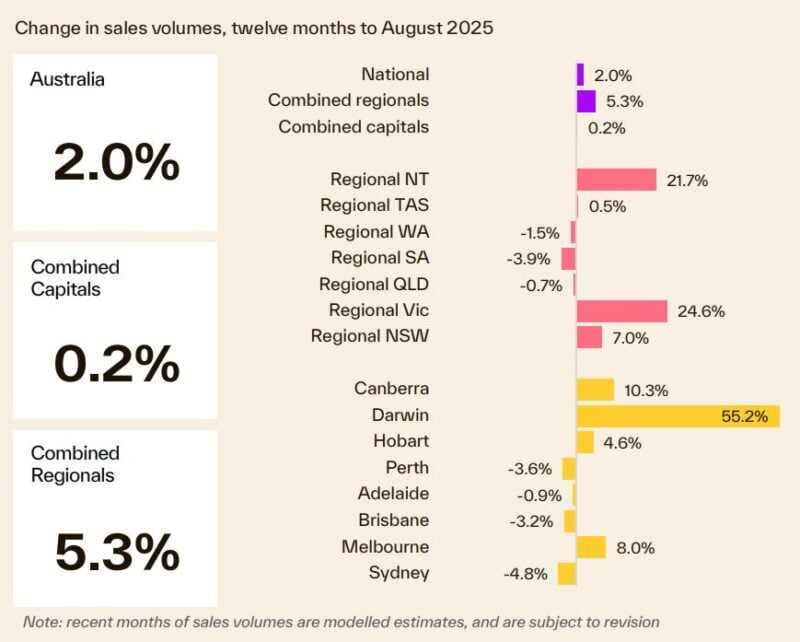
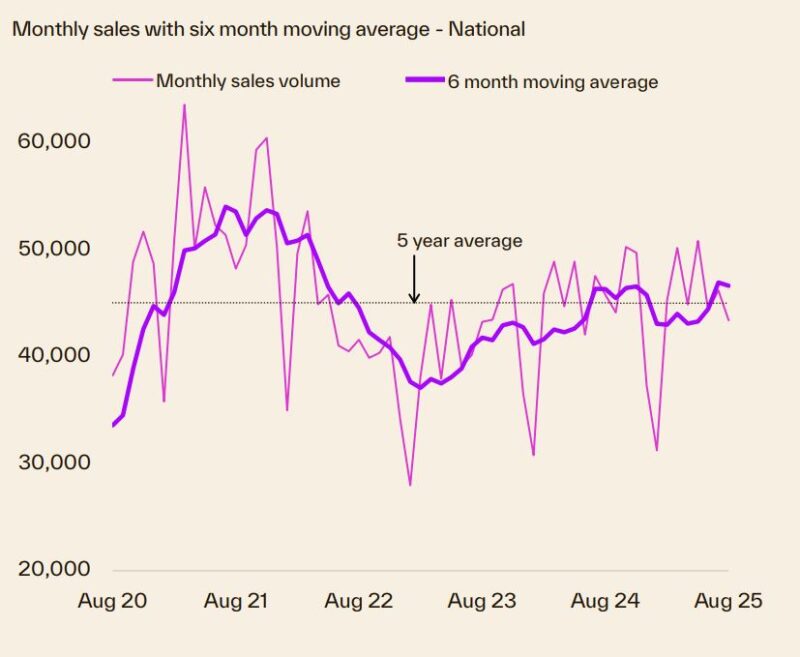
Transaction volumes
- Cotality estimates 43,436 sales occurred nationally in August, taking the rolling 12-month count to 538,329 — 2.0% higher than this time last year and 3.8% above the previous five-year average.
- Darwin remains the standout performer, with annual sales estimates almost 70% above the average, followed by regional WA (14.0%), Melbourne (13.5%) and regional Victoria (11.5%).
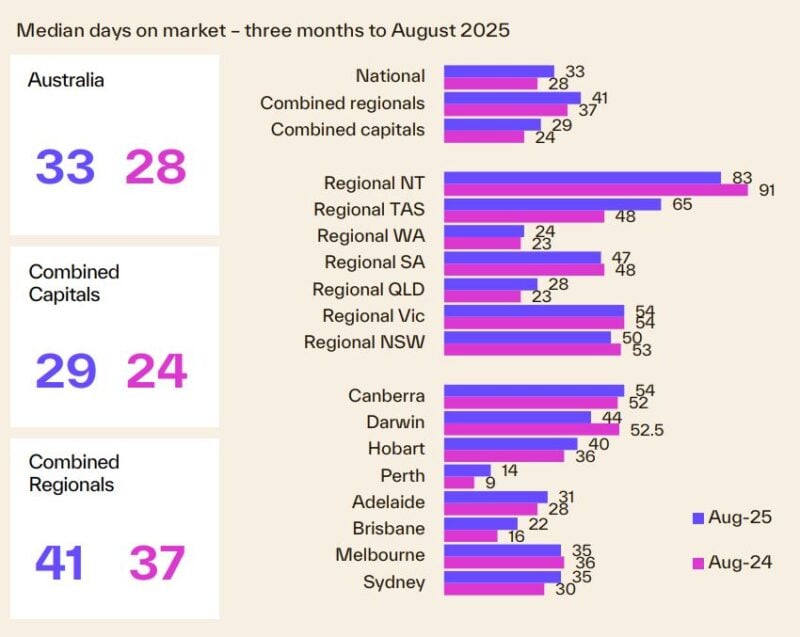
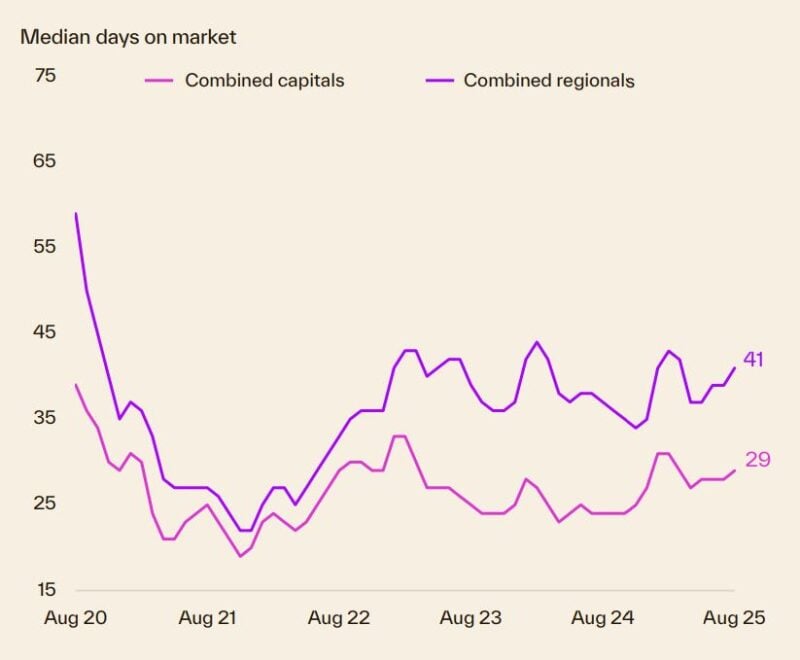
It's taking longer to sell a home
- Despite seeing favourable value growth and sales activity, properties are taking longer to sell with the median time on market rising from 29 days over the three months to April, to 33 days in the August quarter.
- Perth continues to see the shortest selling times with a median time on market of 14 days.
- Meanwhile properties in Canberra (54 days) have seen the longest selling times across the capitals, after overtaking Darwin (44 days) back in April.
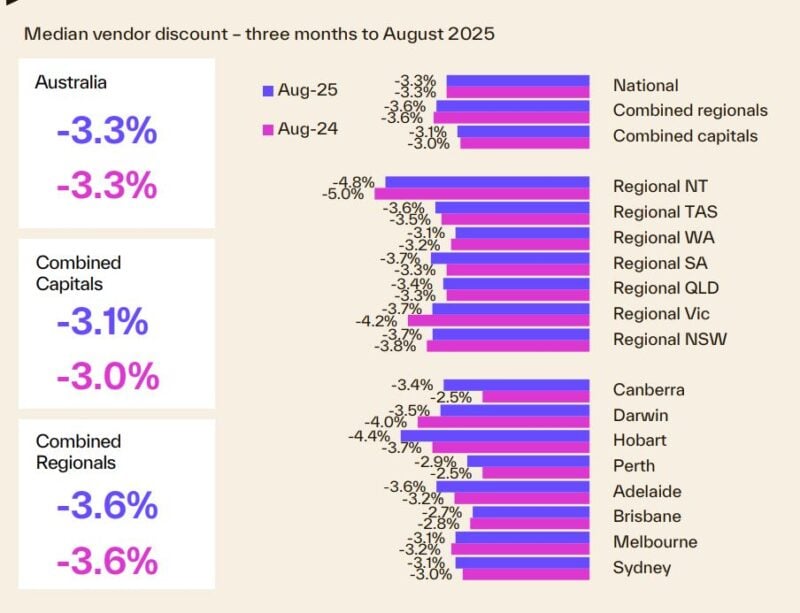
Vendor Discounting
- Since the start of the year vendor discounting rates have steadily reduced, with rate cuts and low supply levels shifting negotiating power back in favour of sellers.
- While roughly in line with the discounts on offer this time last year (3.3%), the national median discounting rate, at 3.3% is down from a recent high of 3.7% recorded over the three months to January 2025.
- Sellers in Hobart (4.4%) continue to offer the largest discounts across the capitals, followed by Adelaide (3.6%), while stronger selling conditions in Brisbane have seen the median vendor discount fall to 2.7%.
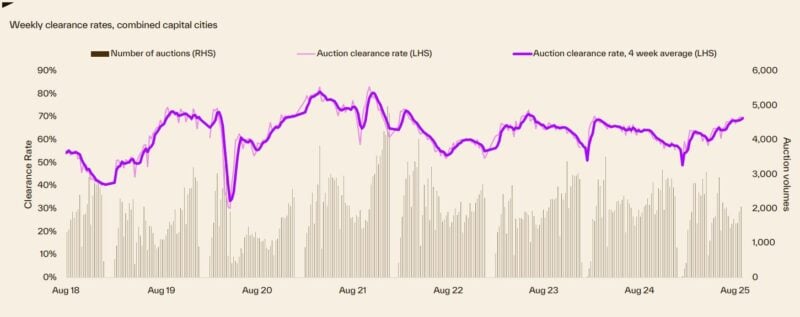
Auction clearance rates
- The last month of winter saw capital city auction activity ramp up, with weekly activity exceeding 2,000 in the final two weeks of August.
- Success rates have also trended higher over the month, with the four-week rolling average clearance rate reaching its highest point in more than two years at 69.5%.
- The week ending August 24th was particularly strong, with 70% of the 2,066 homes auctioned across the combined capitals reporting a positive result.
- We update the weekly auction clearance results here each week.
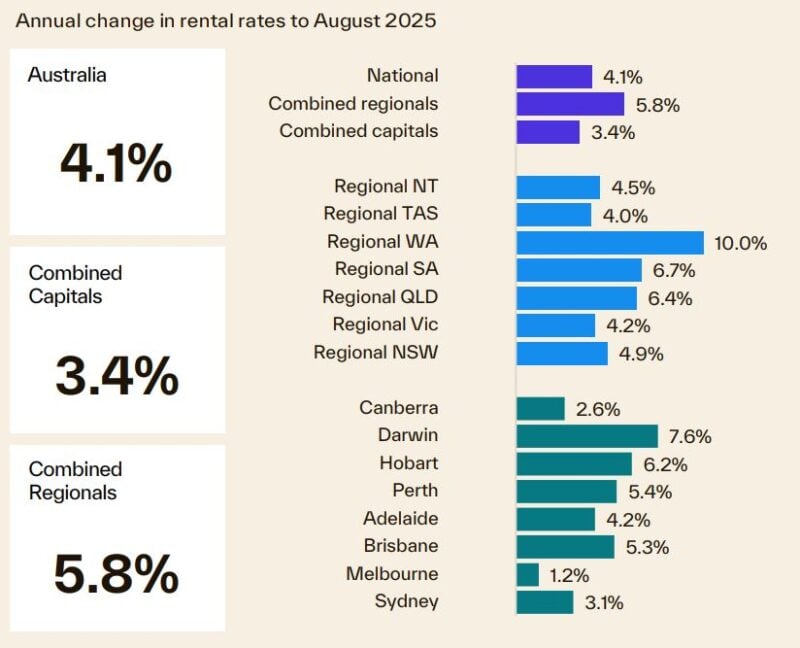
We're still experiencing a rental market crisis in Australia
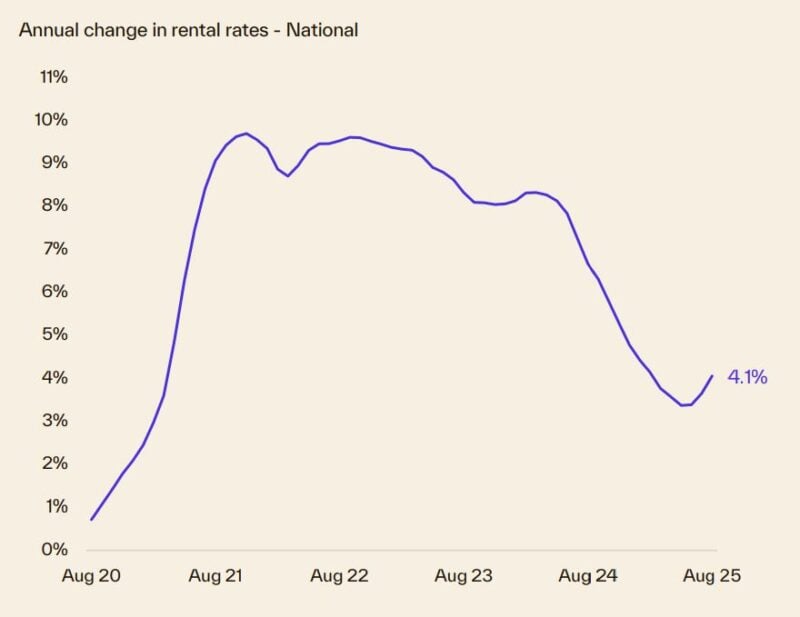
- The annual rate of growth in national rents continued to tick higher for the second consecutive month, with rents up 4.1% over the year to August. Both the combined capitals and regions have seen momentum build in rental trends.
- Since bottoming out in June, the 12 month change in capital city rents has lifted 70 basis points to 3.4%, while the change in regional rents shifted from 5.3% over the 24/25 Financial year, to 5.8% over the year to August.
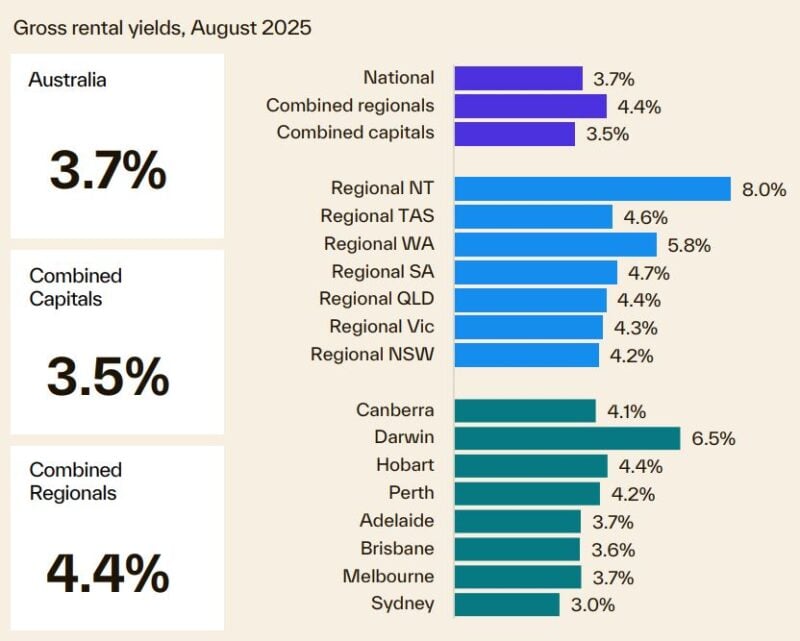
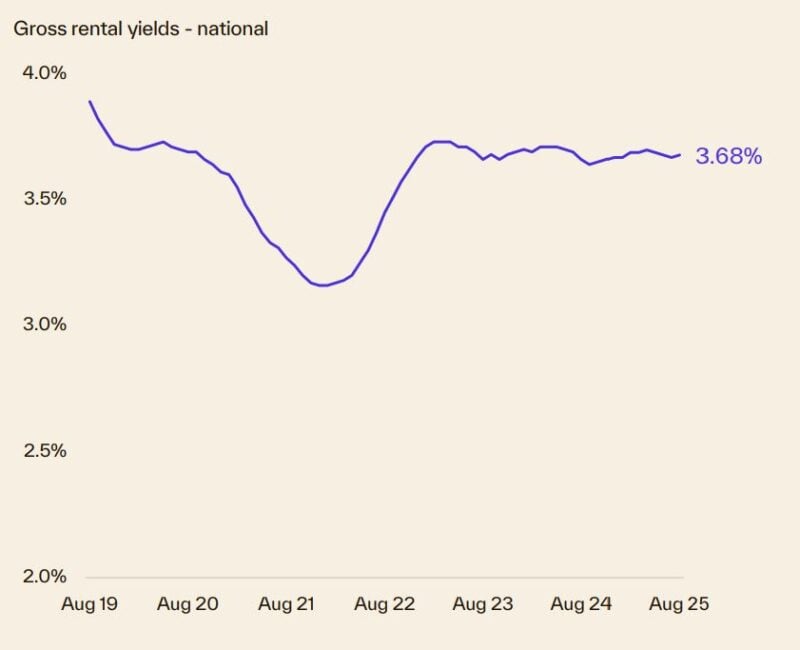
- National gross rent yields remained flat in August at 3.7%, with yields across the combined capitals and combined
regions also holding firm at 3.5% and 4.4%, respectively. - Compared to this time last year, rental dwelling yields have risen in Hobart (4.4%), Canberra (4,1%), Sydney (3.0%) and Melbourne (3.7%), while yields fell across Darwin (6.5%), Adelaide (3.7%) Brisbane (3.6%) and Perth (4.2%) are down relative to this time last year.
Dwelling approvals and housing credit
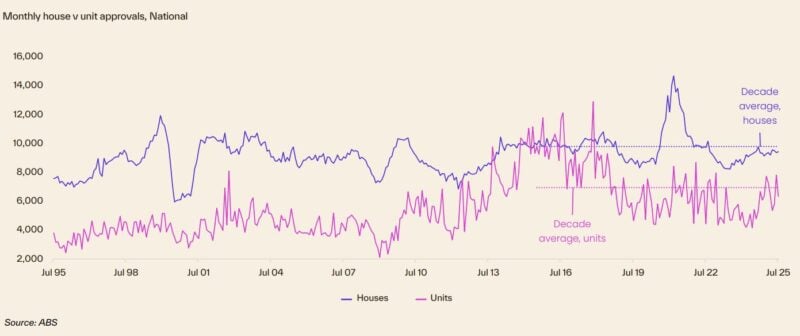
- Monthly dwelling approvals dropped -8.2% in July, following the massive 12.2% rise in June.
- The month-on-month decline was led by the unit segment, with approvals down -18.8%, while house approvals inched slightly higher over the month, up 0.6%.
- While approvals have generally been tracking higher since mid 2023, the average monthly approvals over the year to date remain -4.1% below the decade average and almost -20% down on the 20,000 per month needed to meet the national housing accord target.
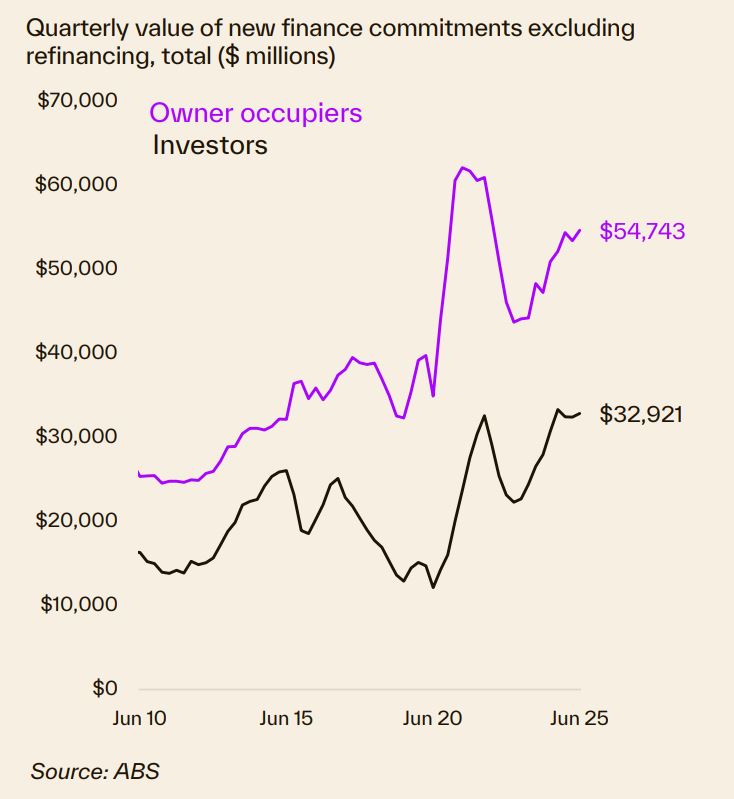
Finance and Lending
- The volume and value of new home loan commitments rose in the June quarter, up 1.9% and 2.0%, respectively.
- Investors drove the increase in volume, with loan commitments rising 3.5% over the quarter compared to the 0.9% lift for owner occupiers.
- For loan value, however, owner occupiers accounted for most of the rise, with the total value of commitments up 2.4%, versus a 1.4% increase in total investor loan value.
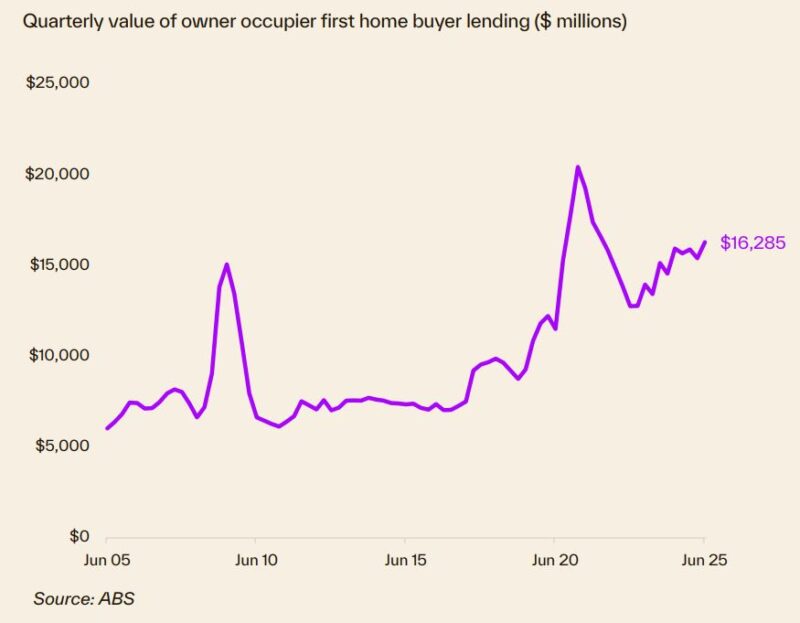
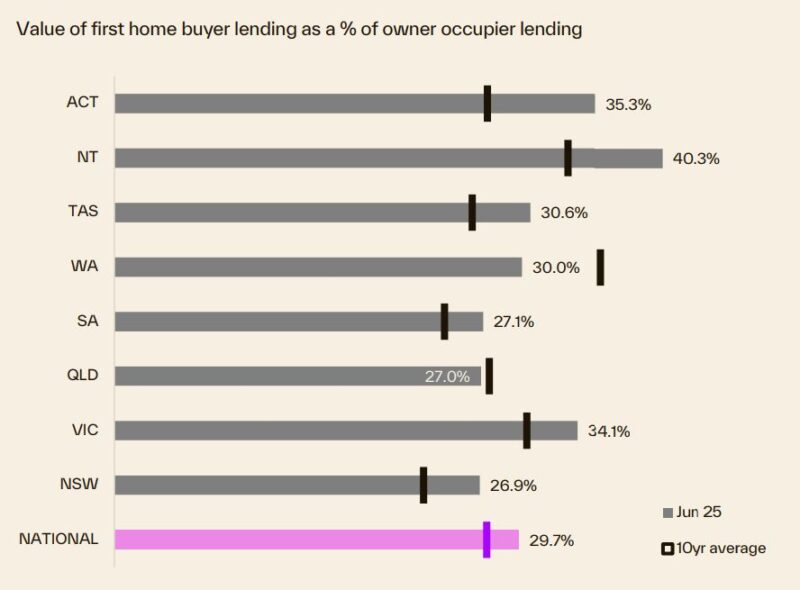
- First home buyer financing edged higher over the June quarter, helping to unwind some of the declines seen through the March quarter.
- FHB loan volumes rose 1.7% over the quarter, led by strong gains in TAS and the NT, up 15.4% and 13.6% respectively.
- At $16.3 billion, the total value of FHB loan commitments (5.7%) also climbed higher, with TAS (10.6%) and ACT (8.3%) posting the largest increases across the states and territories.
Source of charts:Cotality Monthly Housing Chart Pack, September 2025
- Also read:This week’s Australian Property Market Update – Latest Data, State by State September 16th 2025

- Also read:Melbourne property market forecast for 2026 | Is it a good time to invest in Melbourne?

- Also read:Latest Property Price Forecasts Revealed. Australian Property Market Outlook 2025–26: Where Prices Are Headed After Three Rate Cuts.

- Also read:Sydney property market forecast for 2026. Is it a good time to invest in Sydney?

- Also read:Brisbane Property Market Forecast [2026] – What’s Ahead & Where to Invest


