


Key takeaways
Rate hikes increased mortgage serviceability challenges and countered recent price drops in Sydney and Melbourne.
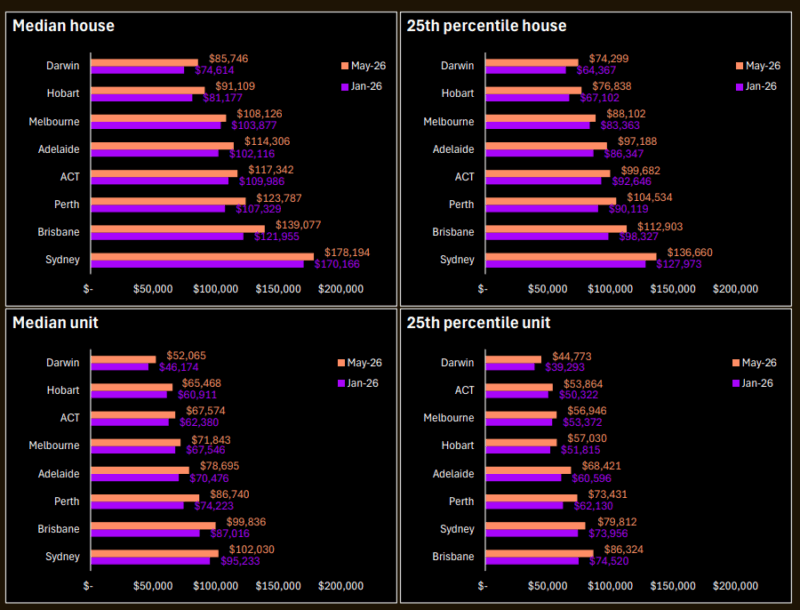
Brisbane median house buyers need an extra $17,000 in annual income since January, while Perth buyers require an extra $16,500.
Sydney median house buyers need $70,000 more in annual household income than Melbourne buyers, highlighting Melbourne’s significant affordability advantage.
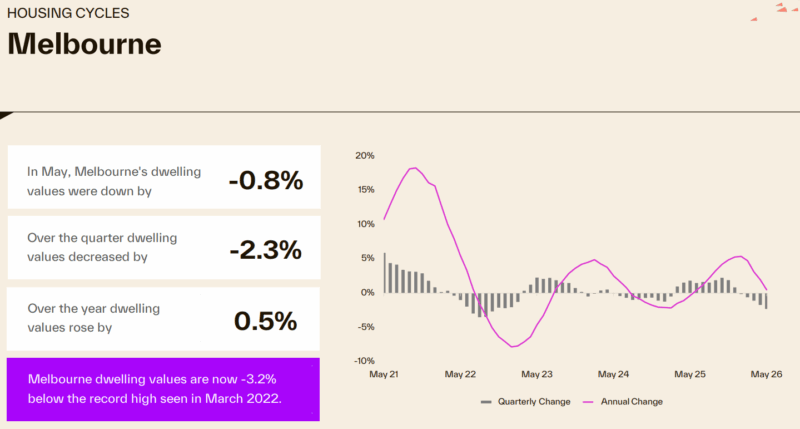
Sydney dwelling values fell 0.9% in May and are now 2.1% below their November 2025 peak, while Melbourne values declined 0.8% over the month and sit 3.2% below their March 2022 high.
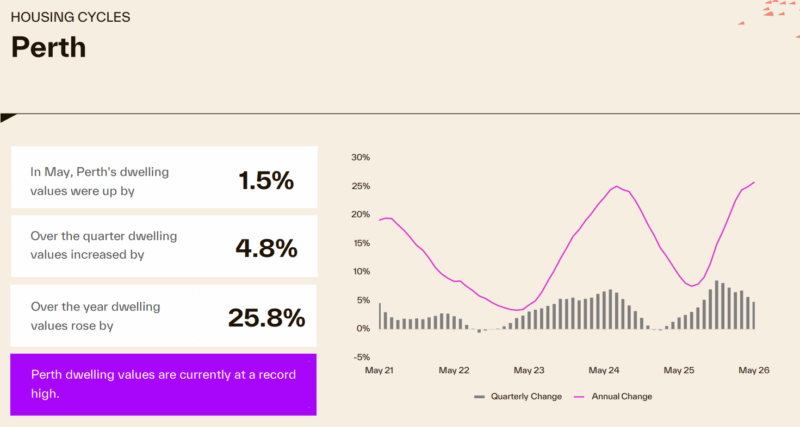
Perth values rose 25.8% over the past year compared to just 0.5% in Melbourne, with the gap in annual growth rates across the capital cities widening to 25 percentage points.
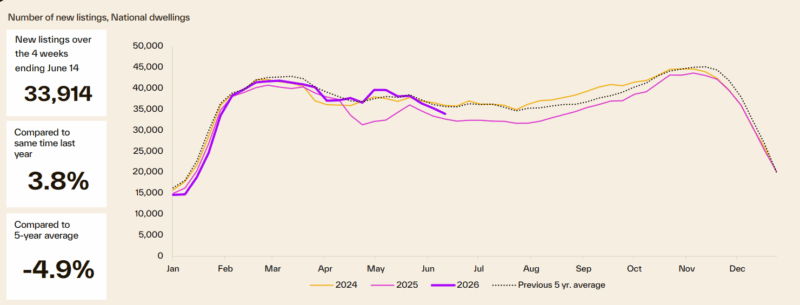
33,914 new listings over the four weeks ending 14 June, 4.9% below the five-year average.
Total listings at 129,010 over the four weeks ending 14 June, up 1.7% from a year ago and 6.5% below the five-year average.
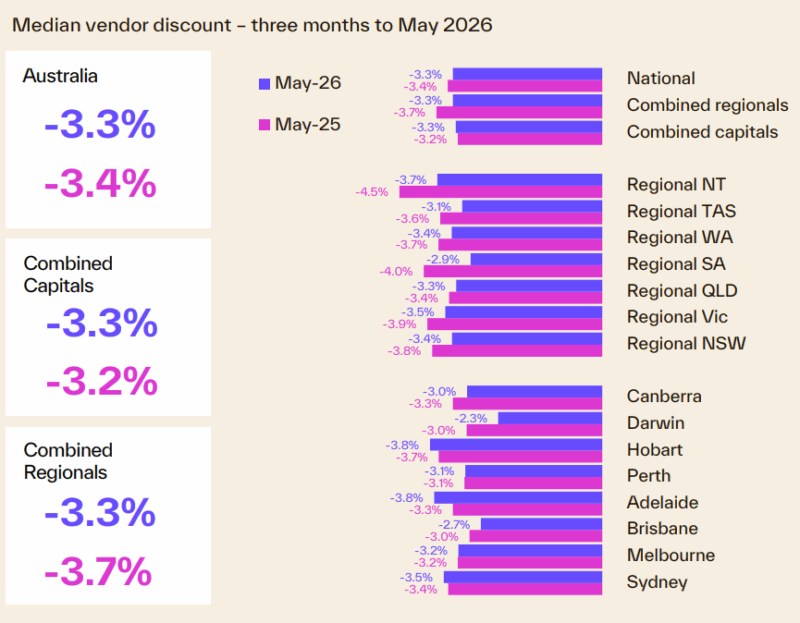
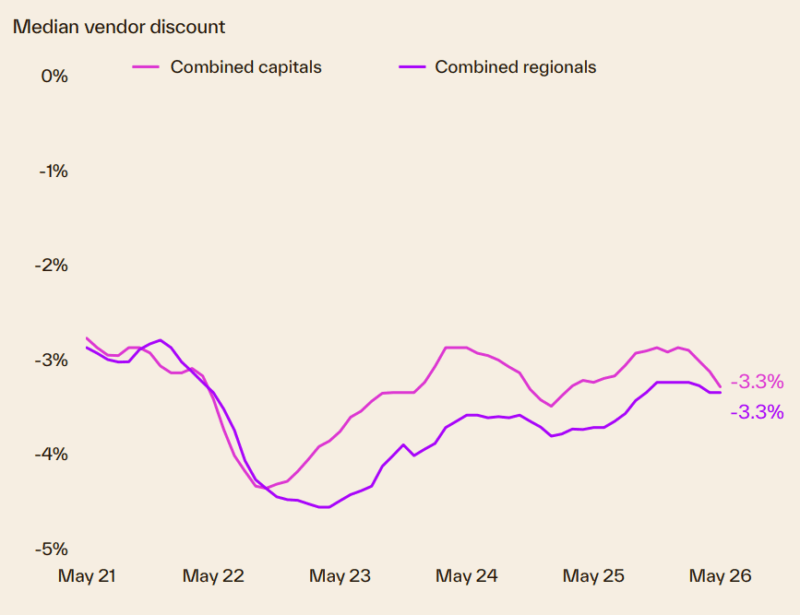
Vendor discounting has started to rise, with the median discount across the combined capital cities increasing to 3.3%, reflecting improved negotiating conditions for buyers.
There is no doubt that our housing markets are facing challenges from all directions, but clearly, they have remained resilient.
To better understand what's happening, this monthly collection of charts from Cotality paints an interesting picture.
Aspiring buyers looking to secure a median house in Brisbane must earn over $17,000 more in annual household income in May than they did in January just to service a typical mortgage, according to Cotality.
The data also reveals a rapidly escalating affordability hurdle in mid-tier cities, with Perth buyers facing a similar $16,500 income requirement spike over the same five-month period.
While home values in Sydney and Melbourne declined in recent months, higher interest rates mean properties have not become more affordable.
Instead, rate hikes have intensified mortgage serviceability constraints nationwide, completely offsetting the benefit of price drops in the largest capitals while continued value growth in mid-tier markets pushes entry requirements to unprecedented levels.
Cotality Head of Research, Gerard Burg, said:
"Rate hikes have significantly increased the challenges of servicing a mortgage across Australia.”
“In expanding markets like Brisbane and Perth, the compounding effect of rising property values and higher interest rates creates an aggressive income barrier for buyers, even at the lower end of the spectrum."
The lower end of the housing market offers little relief for budget-conscious buyers, with the minimum income required to service a lower quartile house surging by $14,500 in both Brisbane and Perth between January and May.
Supply and demand metrics
Driven by accelerating demand, the Brisbane unit market has witnessed dramatic shifts in recent months.
There is now a difference of just over $2,000 in the minimum household income necessary to purchase a median unit in Sydney compared to Brisbane.
Furthermore, intense competition for affordable housing has pushed Brisbane’s lower quartile units to officially become the most expensive entry-level apartments in the country.
"The acceleration of the Brisbane unit market highlights how compressed the affordability landscape has become," Mr Burg said.
"Buyers are redirecting their focus toward apartments, which is rapidly erasing the traditional price gap between Brisbane and Sydney units, and making Brisbane’s entry-level apartments the most expensive nationwide."
The Melbourne advantage
In contrast, limited home value growth in recent years, combined with recent monthly declines, leaves Melbourne with a sizeable affordability advantage over other major capital cities.
Buyers purchasing a median house in Sydney now require an additional $70,000 in annual household income compared to those buying an equivalent home in Melbourne.
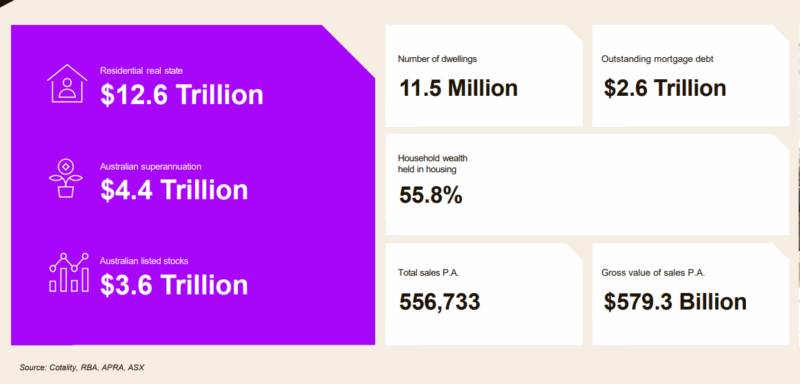
Residential real estate underpins Australia's wealth
- The total value of Australian residential real estate was $12.6 trillion at the end of May 2026.
- Outstanding mortgages against all residential housing are only $2.6 trillion - a very comfortable 20% Loan to Value ratio.
- 55.8% of total Aussie household wealth is held in residential property - one of the many reasons neither the banks, the government nor the RBA wants a property crash.
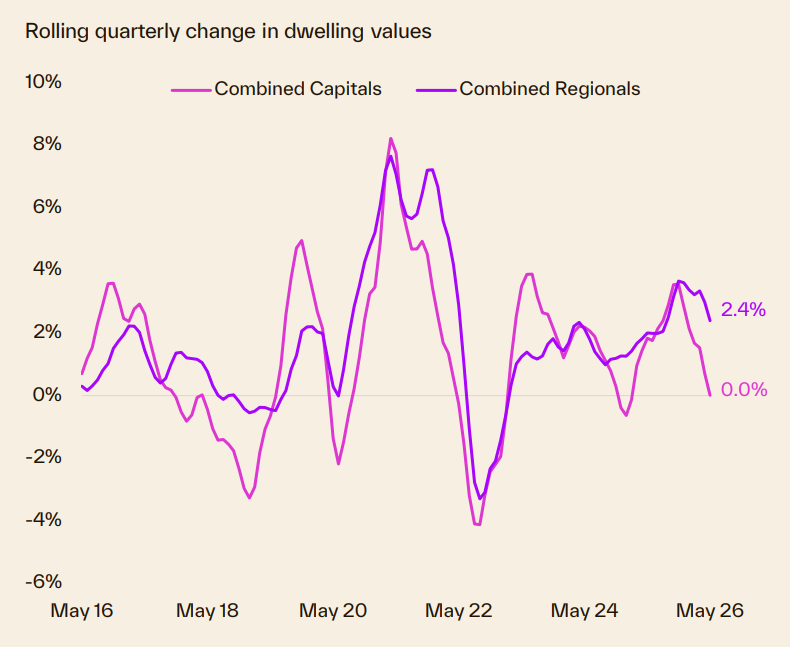
Australian dwelling values
- Australian home values rose just 0.6% over the three months to May, a further step down from the 1.6% recorded in April.
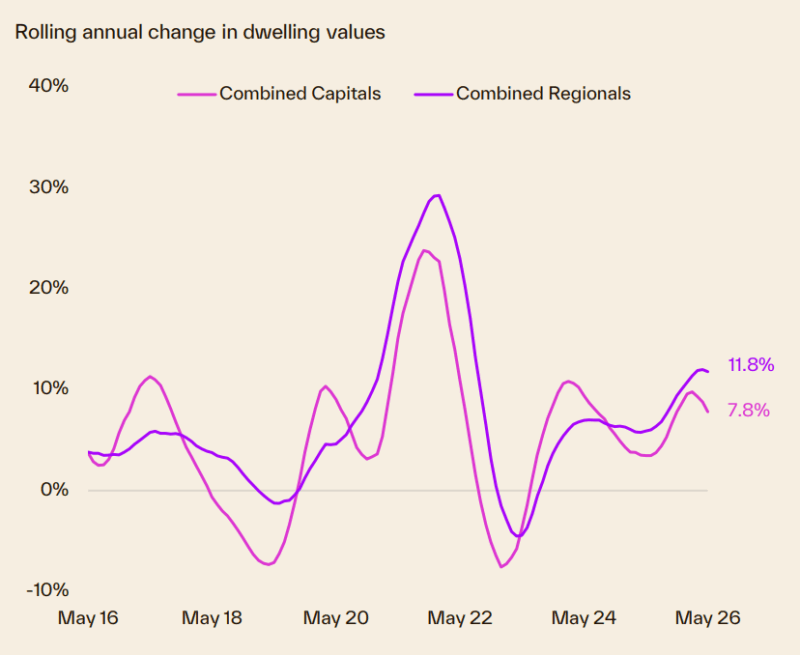
- The annual growth trend continues to moderate from its February peak of 10.0%, reducing to 8.8%.
- With buyer demand and monthly gains losing momentum, the annual trend is likely to keep drifting lower through the second half of the year.
- Unit values are now rising faster than home values across Perth, Brisbane, Adelaide and Sydney.
- The strongest unit performance was Brisbane (21.8% vs 18.6%), followed by Perth (27.8% vs 25.6%).
- However, as a property investor, you can always outperform the average.
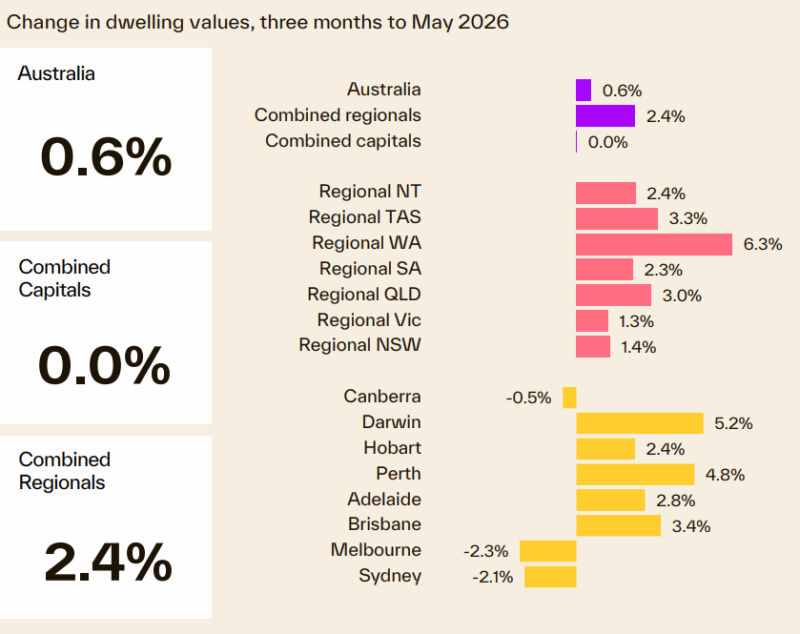
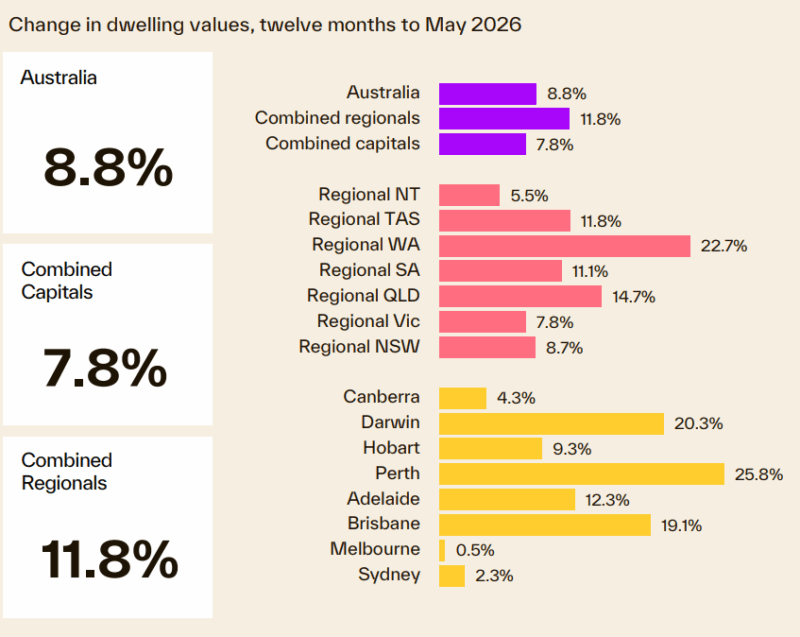
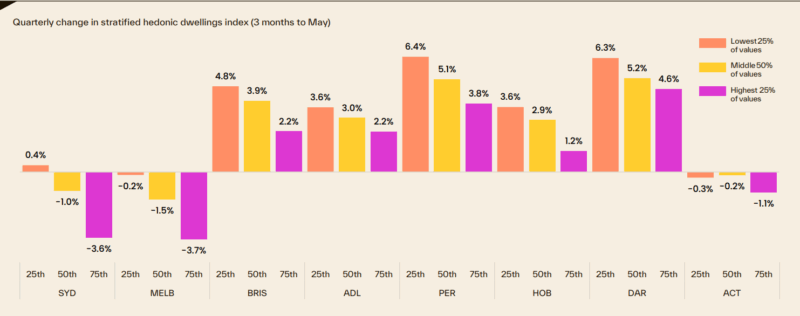
Our capital city markets are fragmented
Our housing markets are fragmented, with each state performing differently depending on local economic and market factors.
The following chart shows how different price segments in each capital city market are performing.
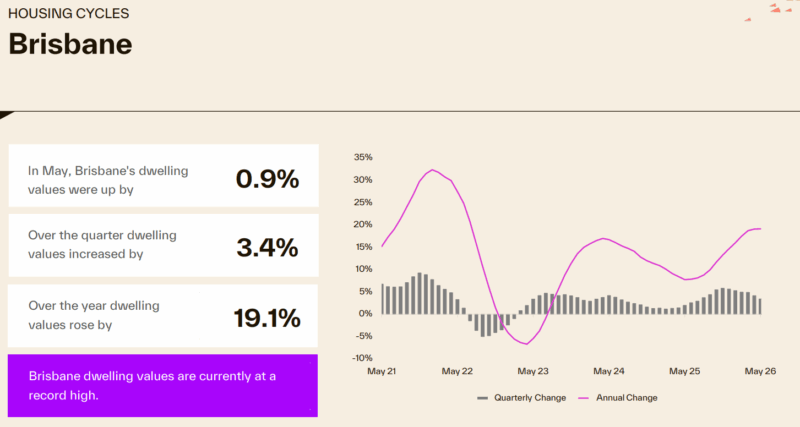
Each State is running its own race
One star performer was Brisbane, where property values increased 19.1% over the last year and are currently at a record high.
- Perth property values are up 25.8% over the year and are currently at a new record high.
- Sydney property values increased only 2.3% over the past year but are now -2.1% below their record high in November 2025.

- Melbourne property values decreased -0.8% for May, rose 0.5% over the year, but are now -3.2% below the record high seen in March 2022.
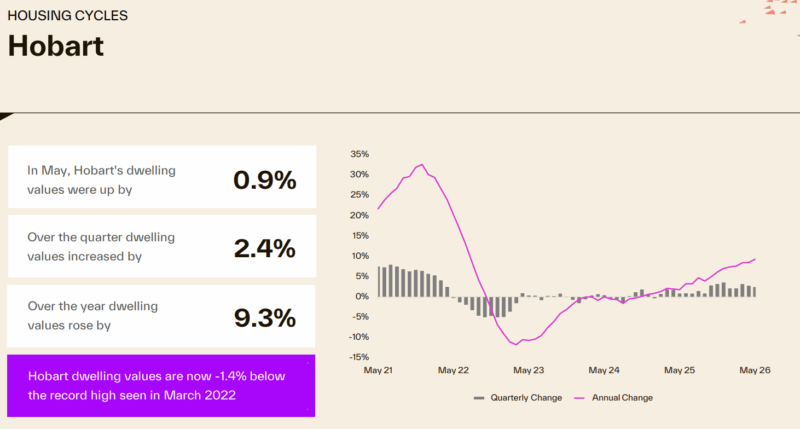
- In the previous darling of the housing markets, Hobart, house prices are -1.4 % below their record highs recorded in March 2022.
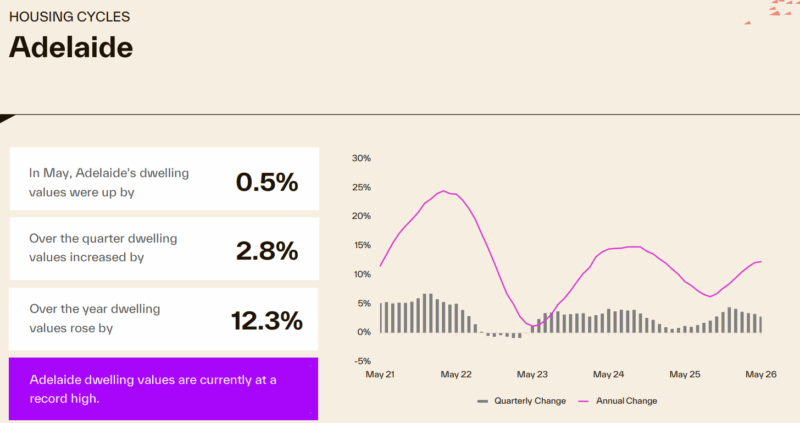
Here's how the Adelaide property market performed.
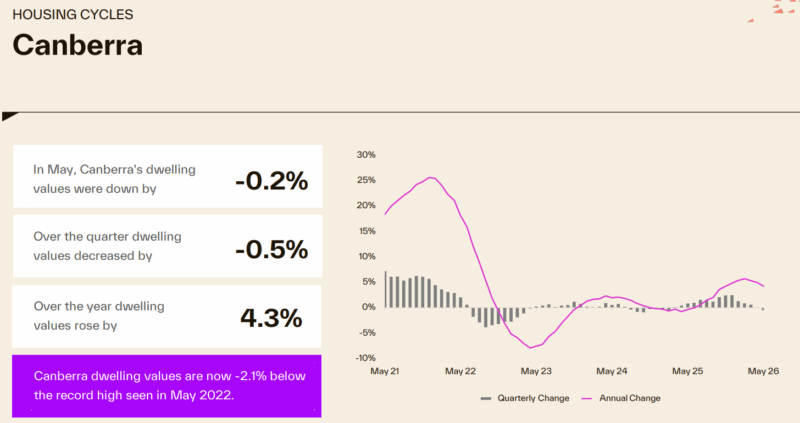
- Dwelling values in Canberra increased 4.3% over the last year.
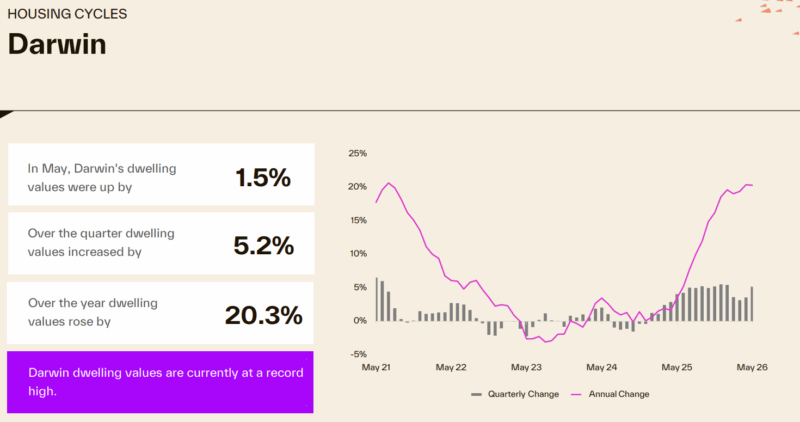
- The Darwin housing market has performed strongly, increasing 20.3% over the year and is currently at a new record high.
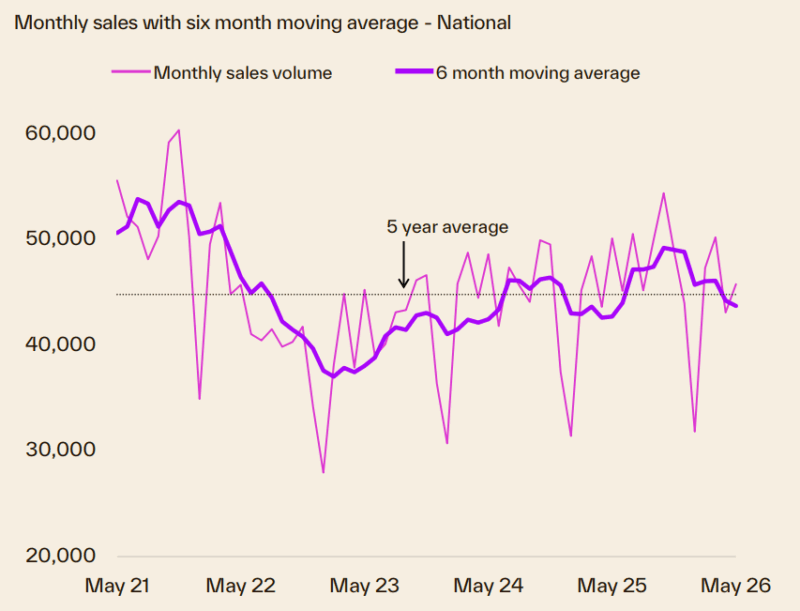
Here's how many properties are for sale at the moment
- After tracking below last year and the five-year average for most of 2026, new listings increased through May to converge with seasonal norms, ending the period 3.8% above year-ago levels but still 4.9% below the five-year average.
- The problem is that very few are A Grade homes or investment grade properties. Owners of quality properties are holding onto them.
- Advertised stock levels are experiencing upward pressure as a steady rise in new listings coincides with a decline in consumer demand, leading to fewer home purchases.
- Listings are only marginally ahead of last year and tracking 1.7% above the same time last year but remain 6.5% below the 5-year average.
Transaction volumes
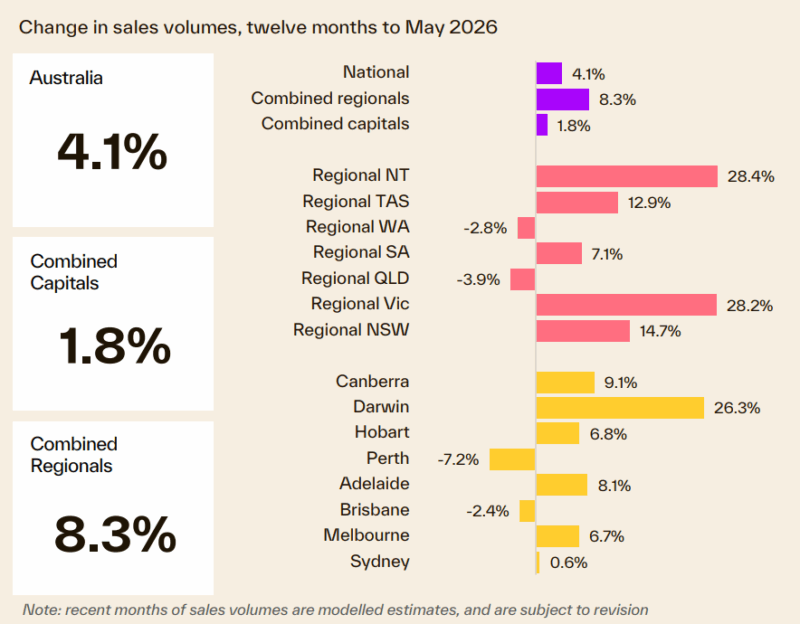
- Strong demand fundamentals drove 2025's annual growth in home sales.
- More recently, the quarterly trend is showing some weakness, with estimates over the three months to May tracking 2.2% lower than a year ago nationally and 4.1% lower than the previous five-year average.
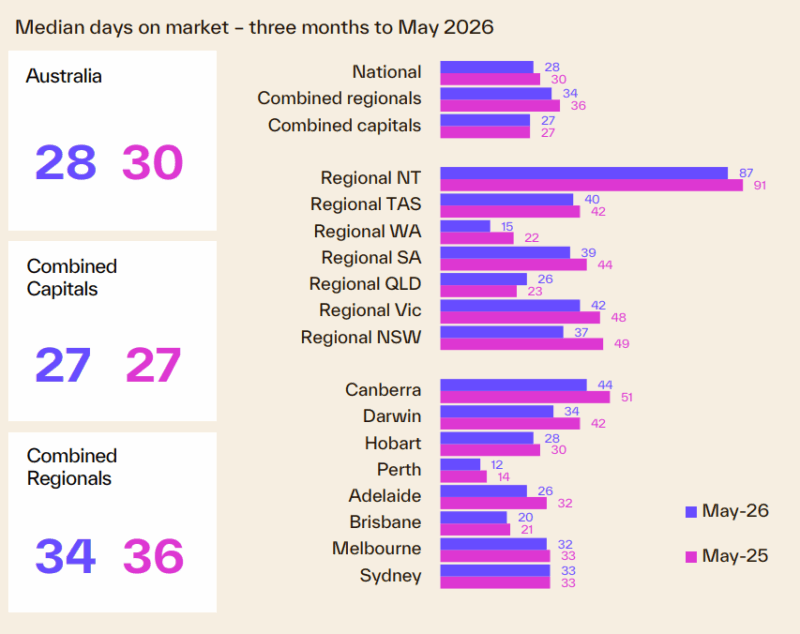
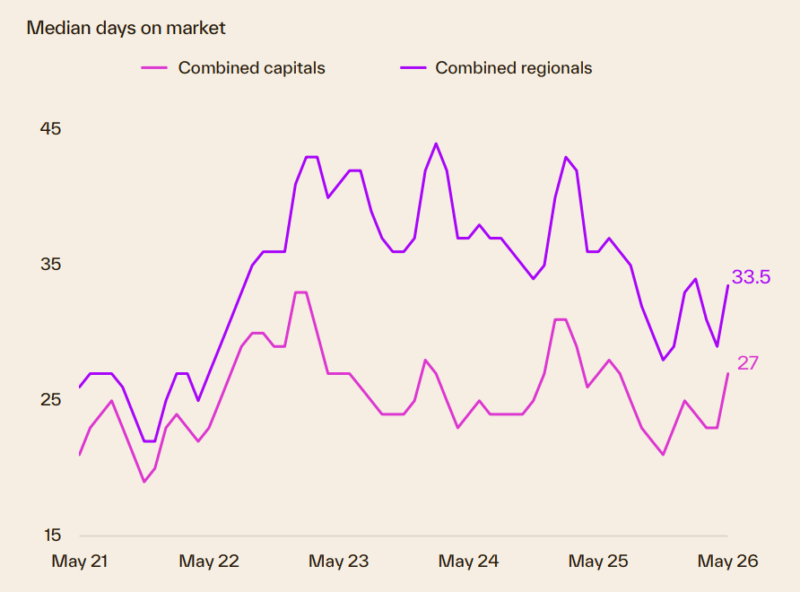
Compared to a year ago, homes are selling faster.
- Nationwide, homes sold in a median of 28 days during the three months leading up to May 2026, a slight improvement from the 30-day median recorded in May 2025.
- However, this momentum appears to be reducing as selling times have begun to rise in early 2026, a shift that suggests softening housing demand in the face uncertainty and macroeconomic pressures.
Vendor Discounting
- Discounting rates are building further as rising listings give buyers better negotiating power.
- The median discount across the combined capitals has increased from 3.1% to 3.3% in the early months until May, while the regional market remains steady at 3.3%.
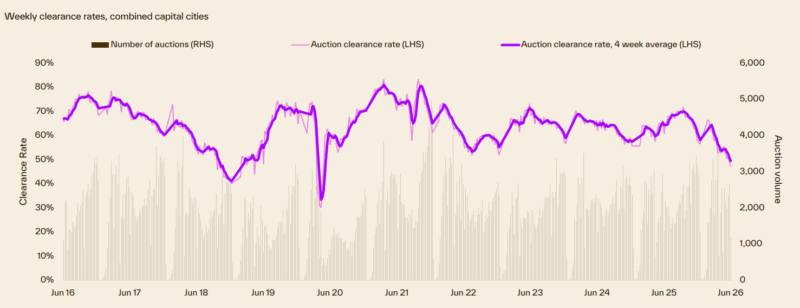
Auction clearance rates
- Auction markets have lost momentum after a strong second half of 2025.
- From a cyclical peak of 72% in September, clearance rates eased to the decade average of 64% by mid-November, before dropping below the 60% threshold in mid-March.
- With these results weighted towards Sydney and Melbourne, this reflects deteriorating demand and improving supply in these markets.
- We update the weekly auction clearance results here each week.
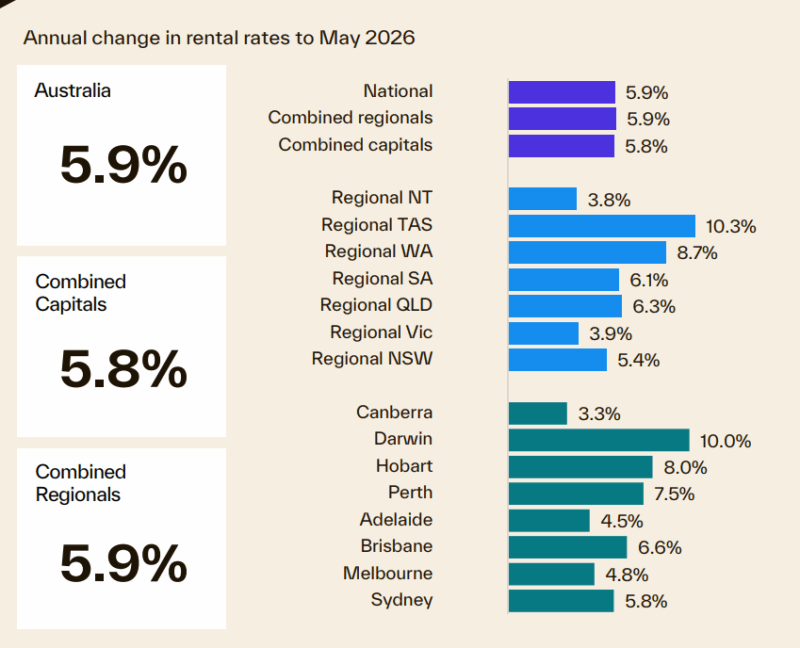
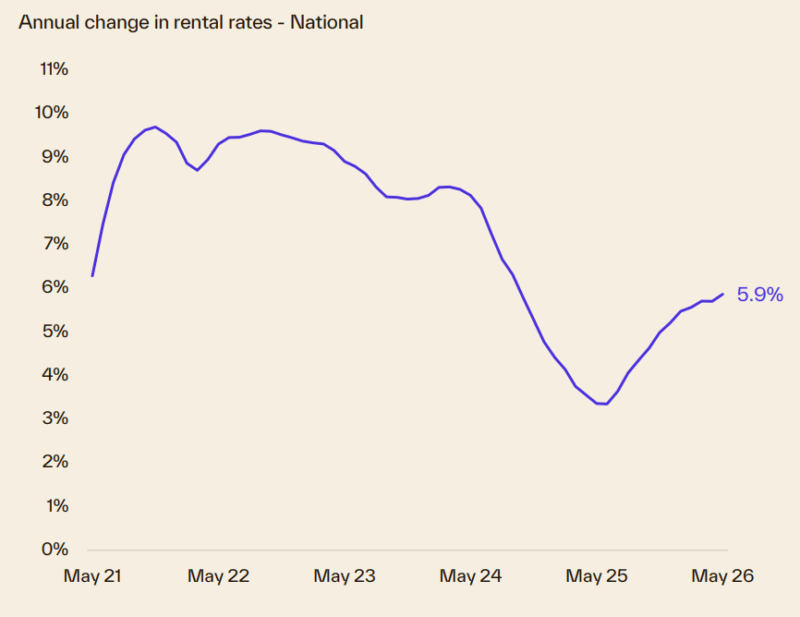
We're still experiencing a rental market crisis in Australia.
- Rental markets remain tight, with the national vacancy rate at 1.5%, down 0.2 percentage points from last month and well below the decade average of 2.5%.
- Annual rental growth has accelerated since mid-2025, up 5.9% yoy in May. Rental growth has been broad based across the combined capitals and regional markets.
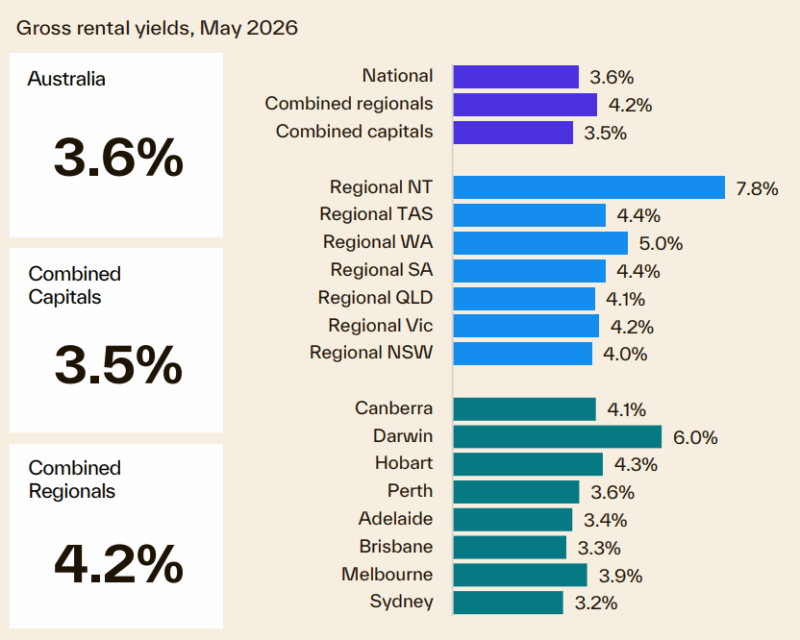
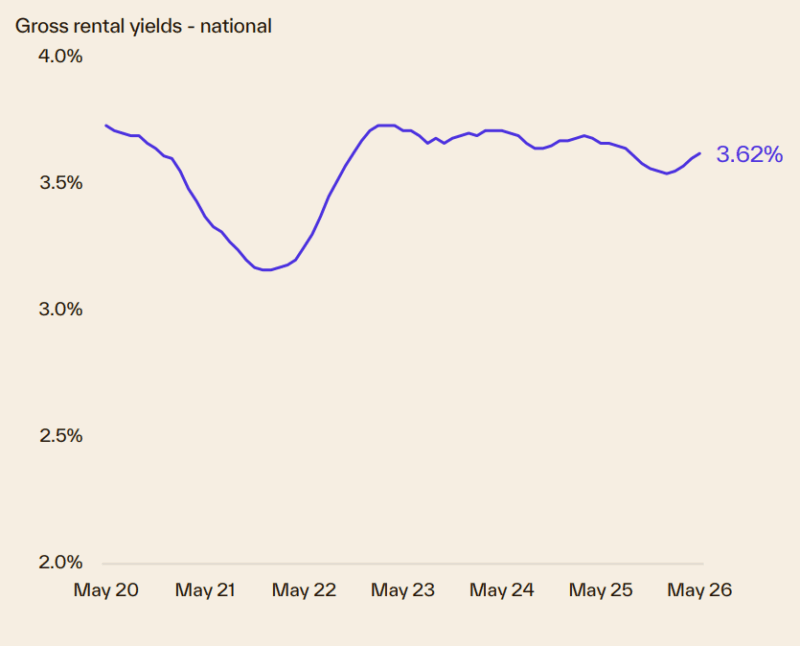
- With rental growth accelerating and home value growth moderating, upward pressure on gross rental yield has risen.
- Nationally, the gross rental yields rose to 3.62 % in May.
- Regional markets continue to offer materially stronger returns (4.2%) rather than capitals (3.5%), with regional NT (7.8%) the standout.
- Darwin has the highest gross yields at 6.0% while Sydney (3.2%), Brisbane(3.3%) and Adelaide (3.4%) sit at the lower end.
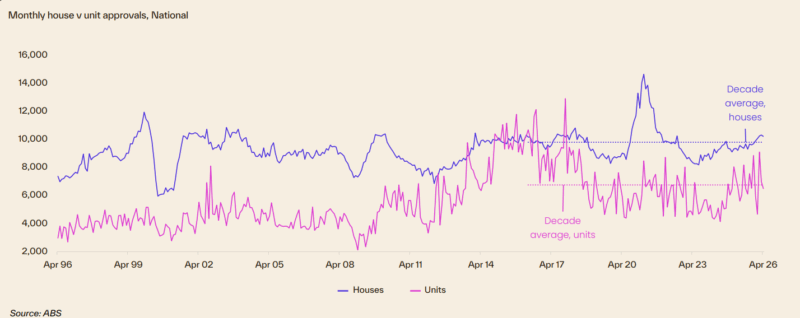
Dwelling approvals and housing credit
- The volume of dwelling approvals fell 3.4% in April, driven by the more volatile units category (which dropped by 7.2%).
- House approvals eased by 0.9%, but still sits 4.3% above the decade average.
- On a trend basis, approvals remain stronger in QLD, WA and SA but lag in NSW and VIC.
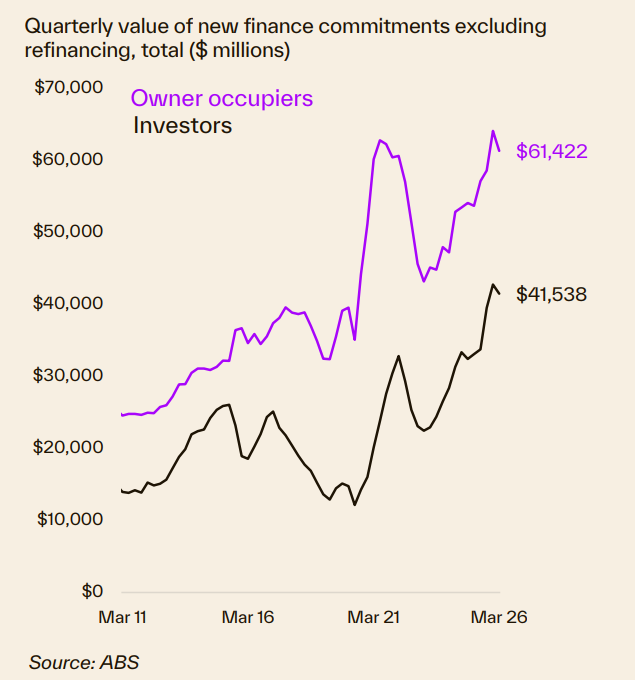
Finance and Lending
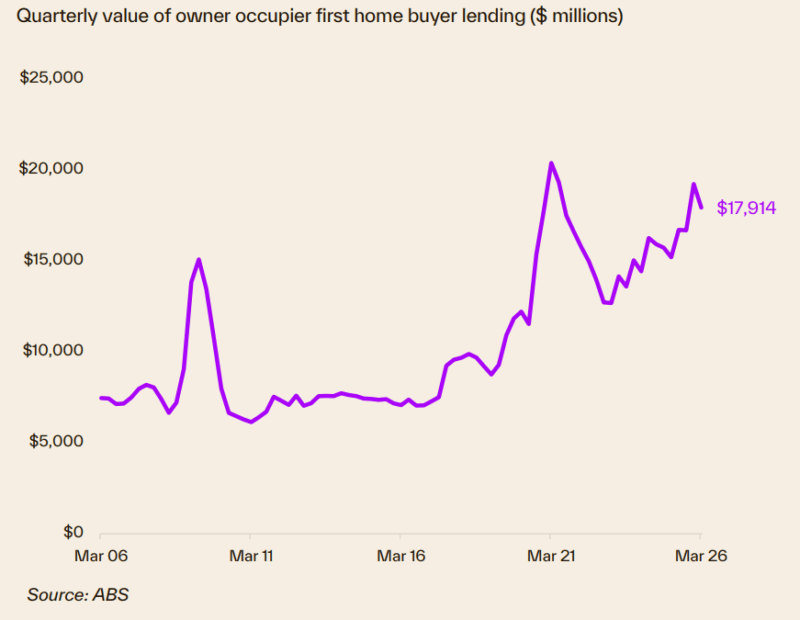
- From a peak in December 2025, the value of home lending fell 3.8% in the March quarter.
- The decline was broad based across borrower types but led by owner-occupiers (down 4.3%) ahead of investors (down 3.0%).
- This saw the investor share of lending rise to its highest rate since September 2016.
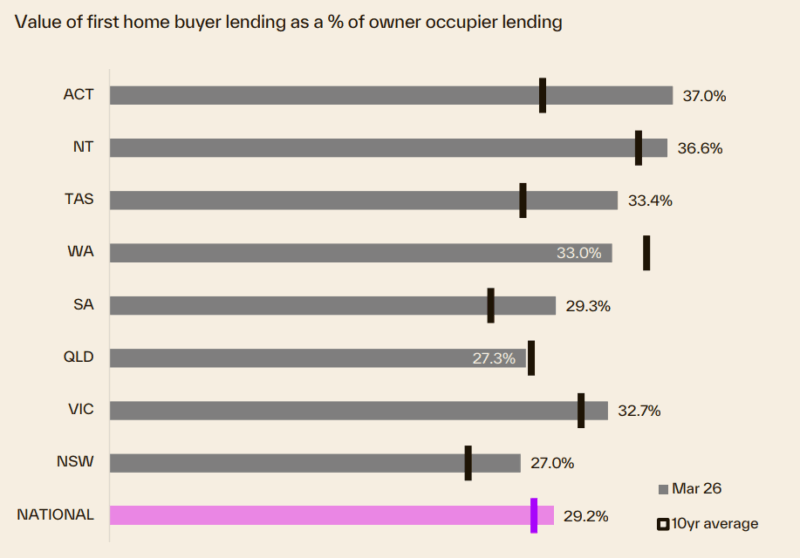
- First-home buyer lending as a proportion of owner-occupier lending reached 29.0%, slightly exceeding the decade average of 27.6%.
- This increase highlights a rise in first-home buyer activity following the expansion of the 5% deposit guarantee.
- ACT remains the strongest market for first-home buyers at 37.0%, followed by the NT (36.6%) and TAS (33.4%), with all three regions sitting significantly above their respective ten-year averages.
- Conversely, QLD and NSW continue to represent the smallest shares at 27.0%.
- Specifically, QLD's share remains below its ten-year average of 27.3%.
Source of charts: Cotality Monthly Housing Chart Pack, June 2026
- Also read:This week’s Australian Property Market Update – Latest Data, State by State July 14th 2026

- Also read:Melbourne property market forecast for 2026 & 2027 | Separating the fundamentals from the sentiment

- Also read:Brisbane Property Market Forecast [2026 & Beyond] – What The Olympics Decade Means for Investors.

- Also read:Sydney property market forecast for 2026 and 2027 | Why the short-term softness is a long-term opportunity

- Also read:Latest Property Price Forecasts. Australian Property Market Outlook 2026-2027: Navigating a Market Correction


