


Key takeaways
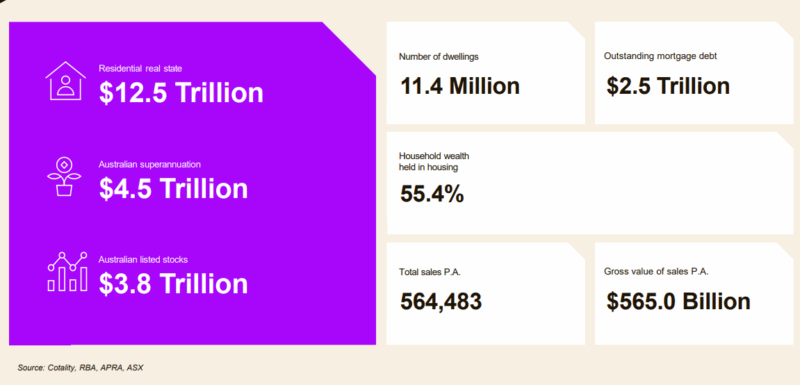
Australia's residential real estate market is now worth over $12.5 trillion, with only $2.5 trillion worth of debt against this.
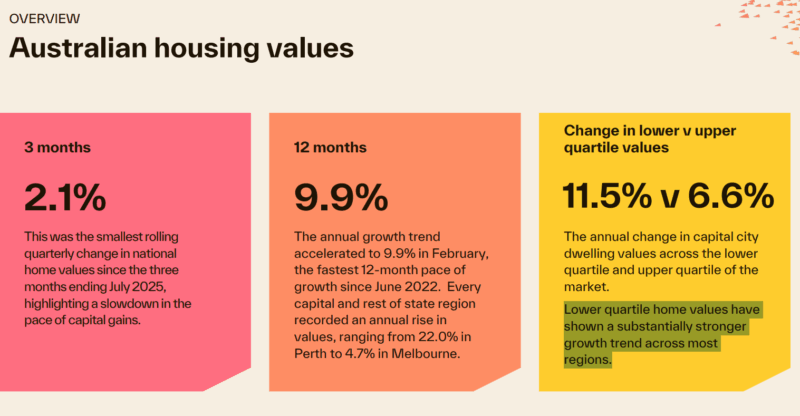
Capital city dwelling values across the lower quartile rose 11.5% over the past year compared with 6.6% across the upper quartile.
Inner Melbourne units are estimated to cost $322 per month less to service a new mortgage than the equivalent median rent.
Total listings are 11.4% lower across the combined capitals and 17.5% lower across the combined regionals compared with a year ago.
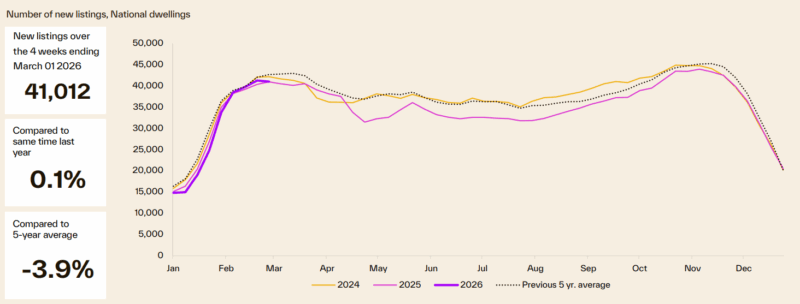
New listings are 0.1% higher than a year ago but almost 4% below the five-year average.
Vendor discounting is close to record lows at 2.9% across the combined capital cities.
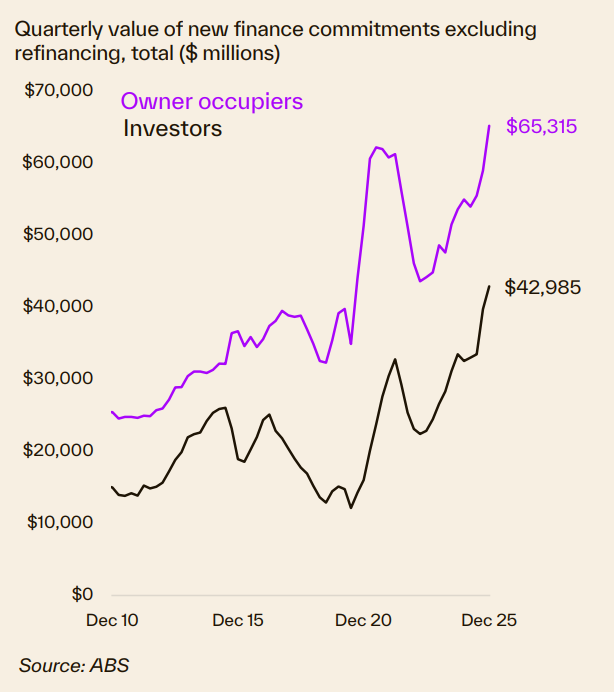
Investor lending increased 7.9% over the December quarter and 31.8% over the year, with investors accounting for 39.7% of lending.
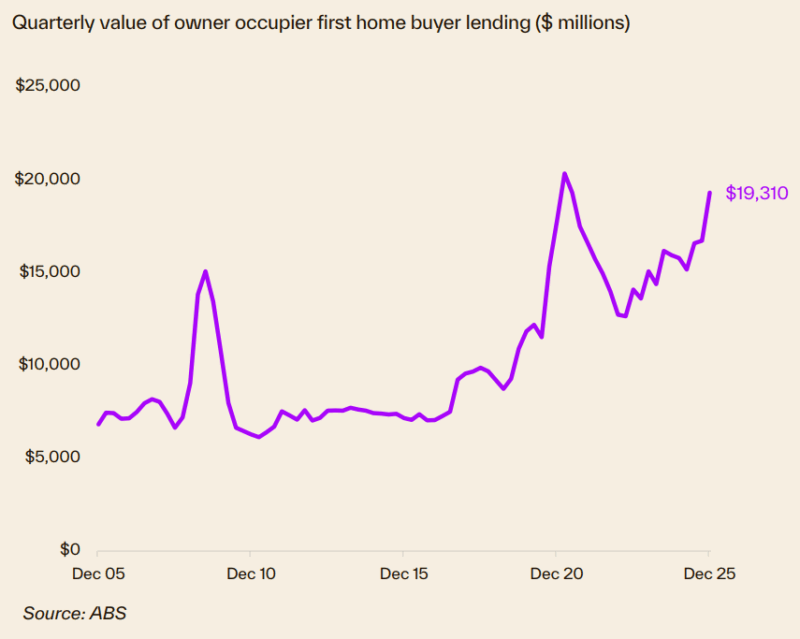
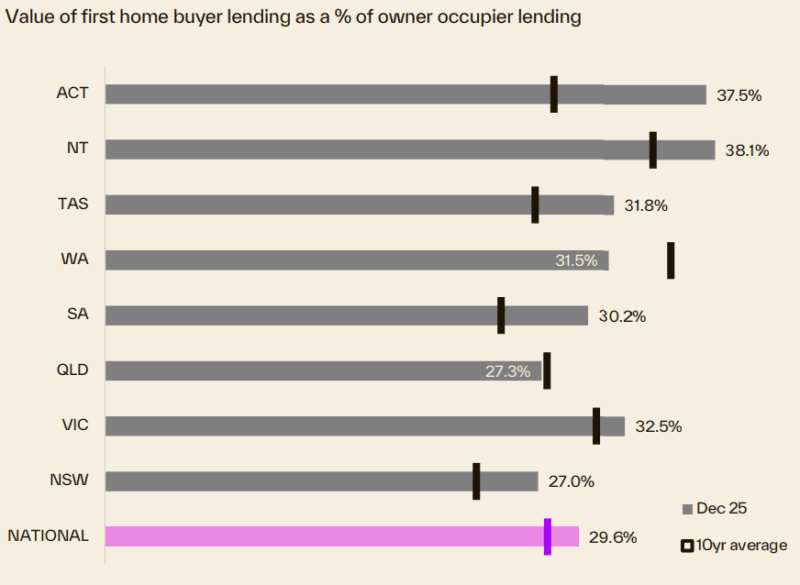
First home buyer lending rose 6.8% by volume and 15.5% by value in the December quarter, accounting for 29.6% of owner occupier lending.
There is no doubt that our housing markets are facing challenges from all directions, but clearly, they have remained resilient.
To better understand what's happening, this monthly collection of charts from Cotality (formerly CoreLogic) paints an interesting picture.
Buying a home for roughly the same cost as renting might sound unlikely in Australia’s current housing market, but new analysis shows it is still possible in a handful of apartment markets.
Cotality’s Monthly Housing Chart Pack for March identifies several capital city unit markets where mortgage repayments on a median-priced unit are now similar to, or in some cases less than, the cost of renting.
Cotality Head of Research, Gerard Burg said the result reflects the speed of rental growth compared with more moderate gains in unit values.
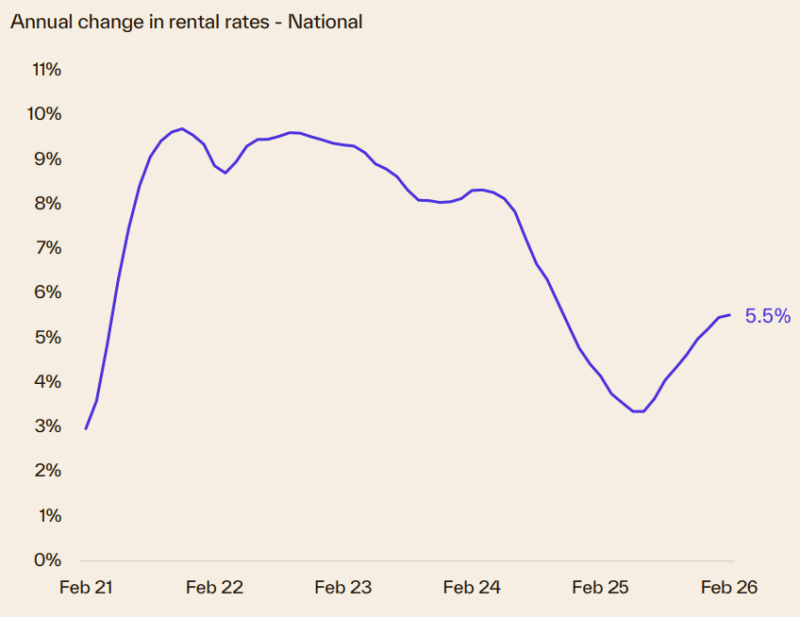
“Rents have risen rapidly over the past few years and we’re seeing that growth pick up again, with the national rental index up 5.5% over the past year and vacancy rates around 1.5%,” Mr Burg said.
“At the same time, some apartment markets have seen additional supply come online, which has helped keep a lid on value growth even as rents continued to rise. When rents rise faster than property values, the cost gap between renting and buying naturally narrows.”
Inner Melbourne is one of the few markets where mortgage repayments on the median unit are estimated to be around $322 per month lower than the equivalent median rent.
Parts of inner-city Darwin and Canberra’s Woden Valley also show a minimal gap exists between median rents and unit mortgage repayments.
Despite the narrowing gap in some locations, Mr Burg said most markets still favour renting once the broader costs of ownership are considered and detached housing remains significantly more expensive to purchase than rent across all capital city regions.
“Even where mortgage repayments appear similar to rents, buyers still need to factor in additional costs such as deposits, rates, insurance, body corporate fees and maintenance,” he said.
“Even after the significant double-digit growth in some of the smaller capital cities in the past few years, the smallest differences were generally seen across Darwin, Hobart and some outer areas of Adelaide and Perth, but renting remains the cheaper option for houses.”
“The financial downside to renting is that renters don’t see the wealth benefits most homeowners experience, especially over the past five years where Australian home values have surged almost 44% higher, adding approximately $280,000 to the median dwelling value.”
Lower-priced housing recorded substantially stronger value growth than higher-priced properties in the past year, with capital city values across the lower quartile rising 11.5% compared with 6.6% across the upper quartile.
Mr Burg said affordability constraints were pushing buyers towards more accessible price points.
“The most affordable segment of the market is attracting the largest pool of buyers, particularly when borrowing capacity is stretched and investors are competing with a pickup in first home buyer demand,” he said.
“That competition tends to support stronger value growth at the lower end of the market while higher price brackets are seeing more moderate conditions.”
Residential real estate underpins Australia's wealth
- The total value of Australian residential real estate was $12.5 trillion at the end of February 2026.
- Outstanding mortgages against all residential housing are only $2.5 trillion - a very comfortable 20% Loan to Value ratio.
- 55.4% of total Aussie household wealth is held in residential property - one of the many reasons neither the banks, the government nor the RBA wants a property crash.
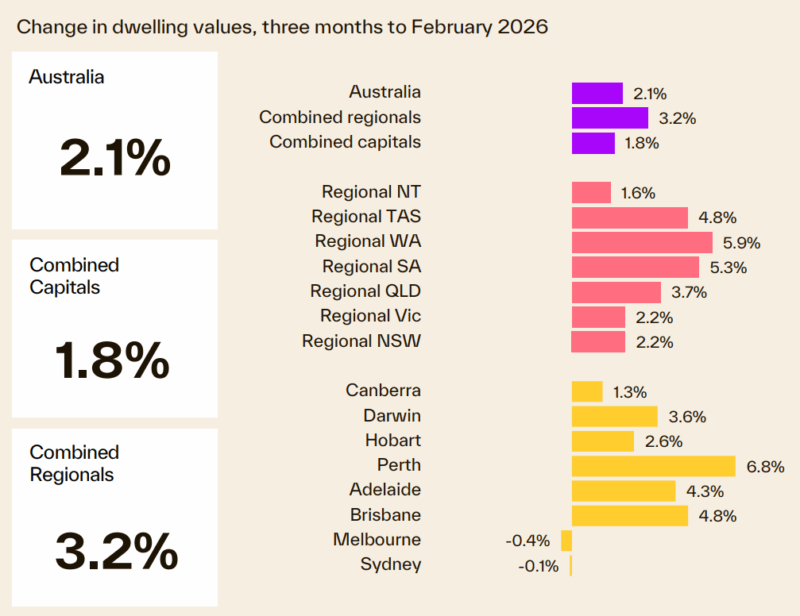
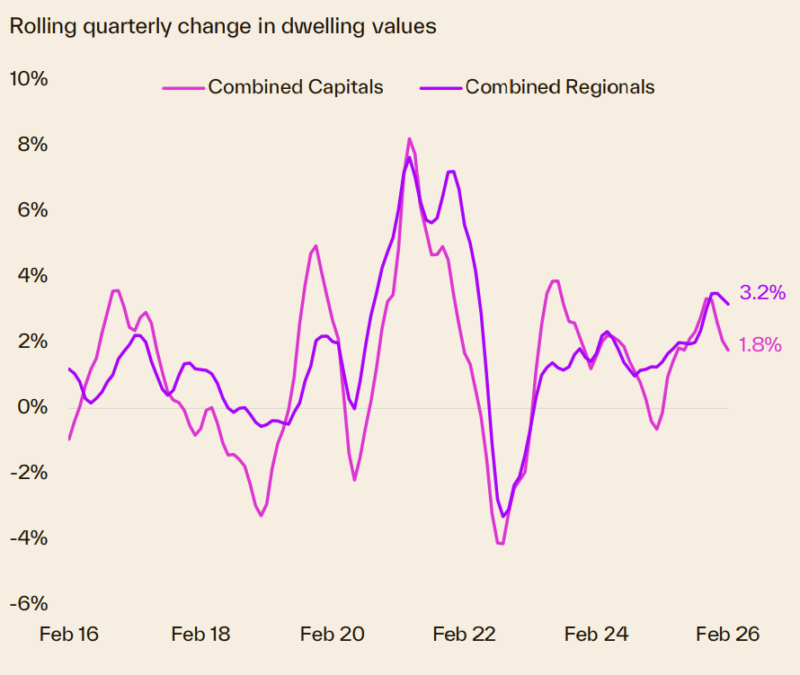
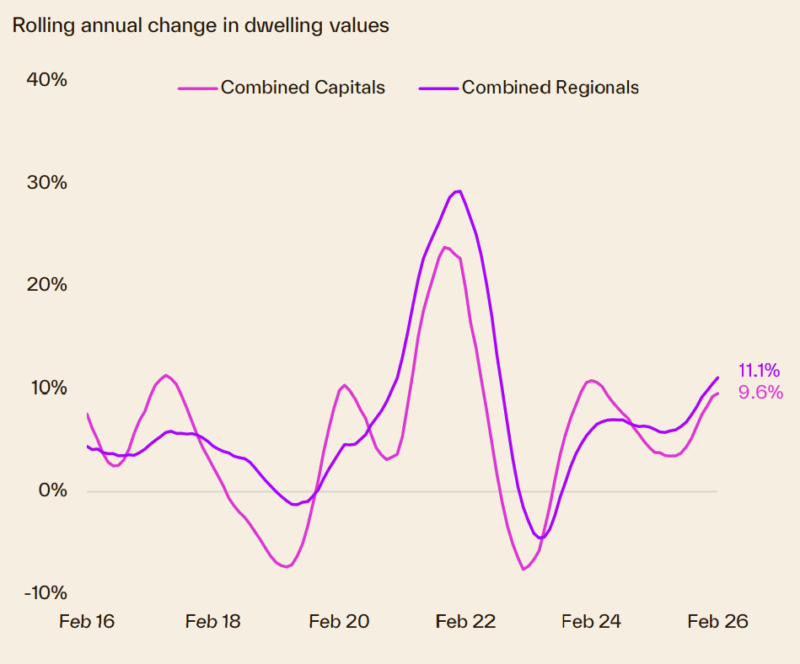
Australian dwelling values
- This was the smallest rolling quarterly change in national home values since the three months ending July 2025, highlighting a slowdown in the pace of capital gains.
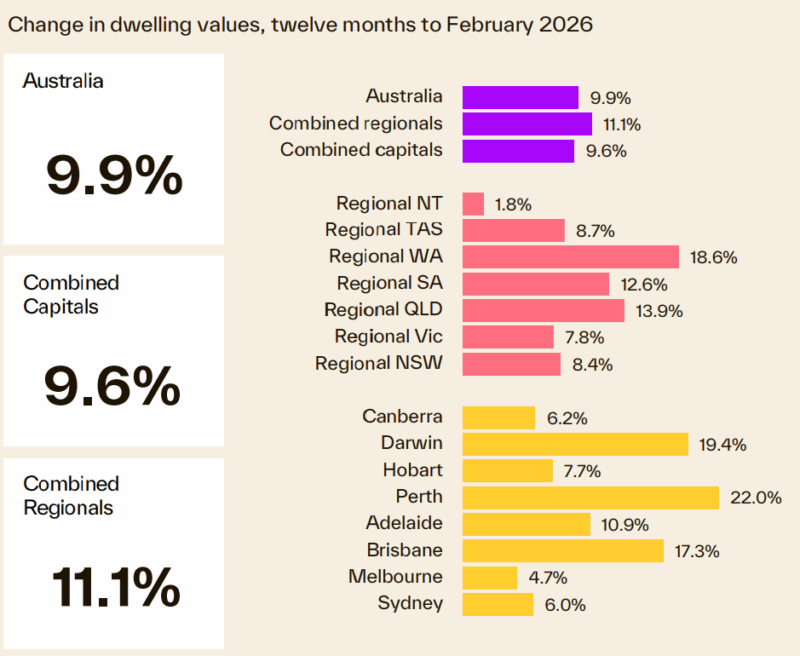
- The annual growth trend accelerated to 9.9% in February, the fastest 12-month pace of growth since June 2022.
- Every capital and rest of state region recorded an annual rise in values, ranging from 22.0% in Perth to 4.7% in Melbourne.
- The annual change in capital city dwelling values across the lower quartile and upper quartile of the
market. - Lower quartile home values have shown a substantially stronger growth trend across most regions.
- However, as a property investor, you can always outperform the average.
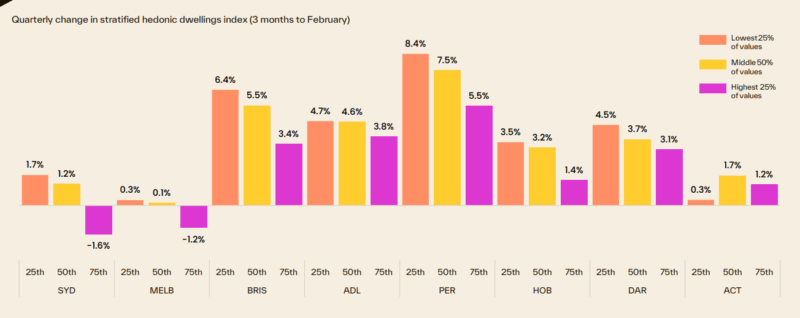
Our capital city markets are fragmented
Our housing markets are fragmented, with each state performing differently depending on local economic and market factors.
The following chart shows how various price segments of each capital city market are performing differently.
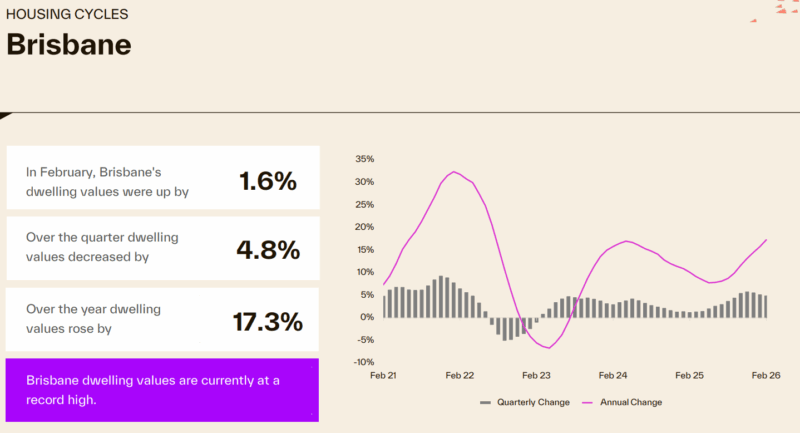
Each State is running its own race
One star performer was Brisbane, where property values increased 17.3% over the last year and are currently at a record high.
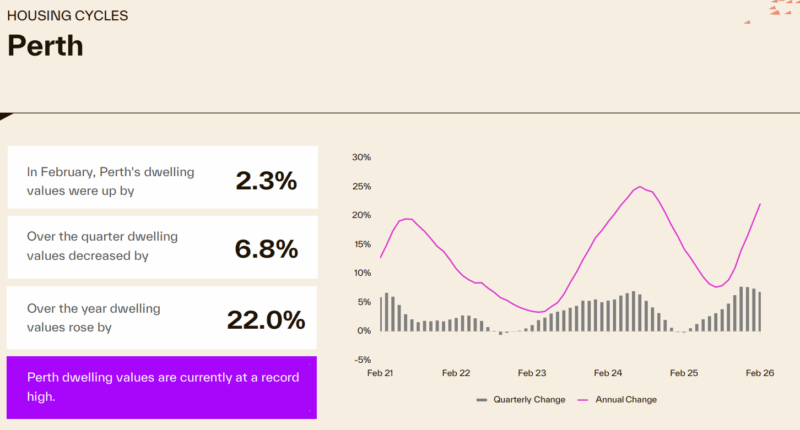
- Perth property values are up 22% over the year and are currently at a new record high.
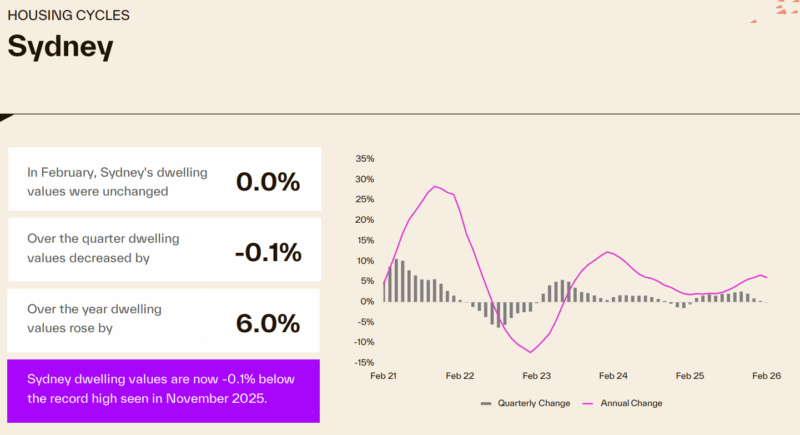
- Sydney property values increased 6% over the past year but are still -0.1% below their record high in November 2025.
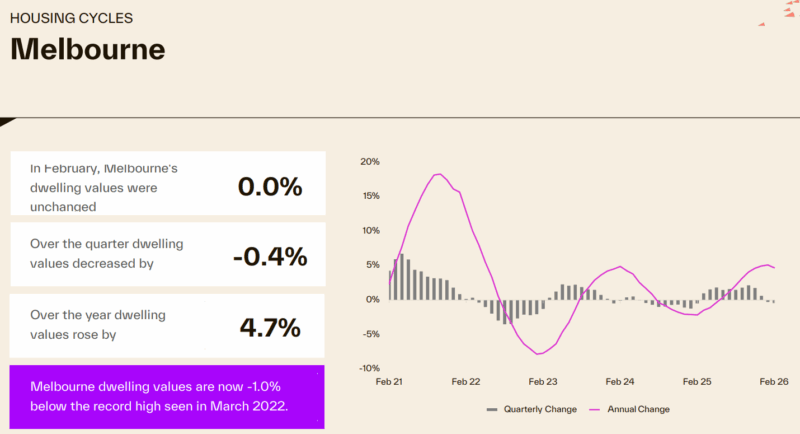
- Melbourne property values remained flat in February, rose 4.7% over the year, but are still -1% below the record high seen in March 2022.
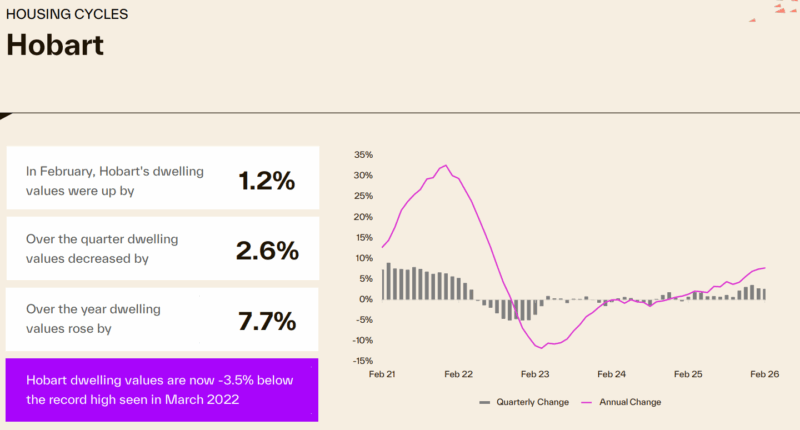
- In the previous darling of the housing markets, Hobart, house prices are -3.5 % below their record highs recorded in March 2022.
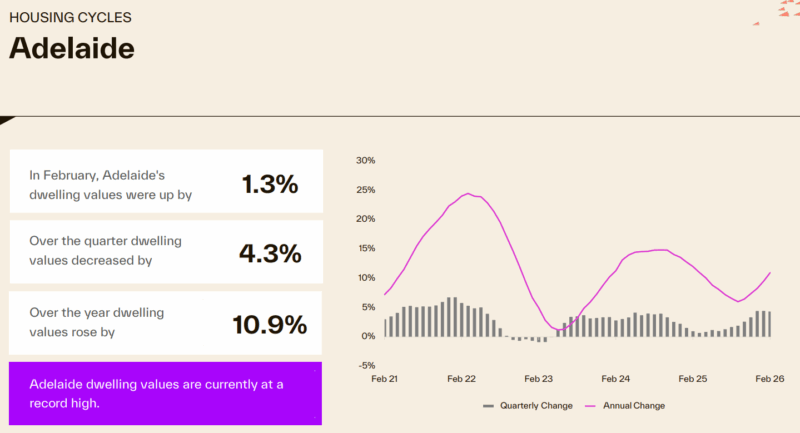
Here's how the Adelaide property market performed.
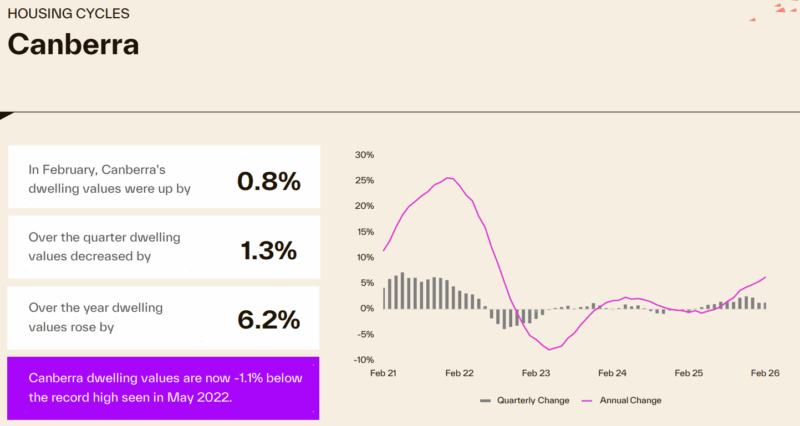
- Dwelling values in Canberra increased 6.2% over the last year.
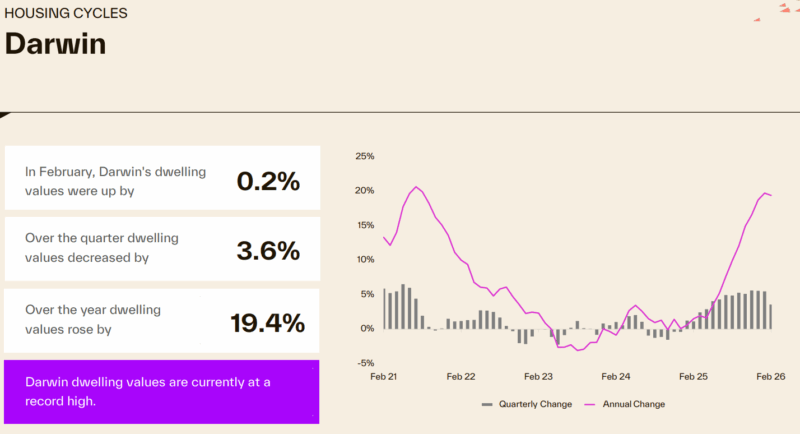
- The Darwin housing market has performed strongly, increasing 19.4% over the year and is currently at a new record high.
Here's how many properties are for sale at the moment
- Vendors remain less active than average. Although the seasonal rise in new listings has played out through late January and February, with freshly advertised listings tracking roughly in line with a year ago (+0.1%), the flow of new listings is down almost 4.0% compared with the five-year average.
- The problem is that very few are A Grade homes or investment grade properties. Owners of quality properties are holding onto them.
- With a softer than average flow of new listings to market, alongside higher levels of purchasing activity relative to a year ago, the volume of advertised stock remains well below average.
- Nationally, inventory levels were 14% lower than at the same time last year, ranging from more than a 30% drop in Perth and Darwin to a 3.2% decrease across the ACT.
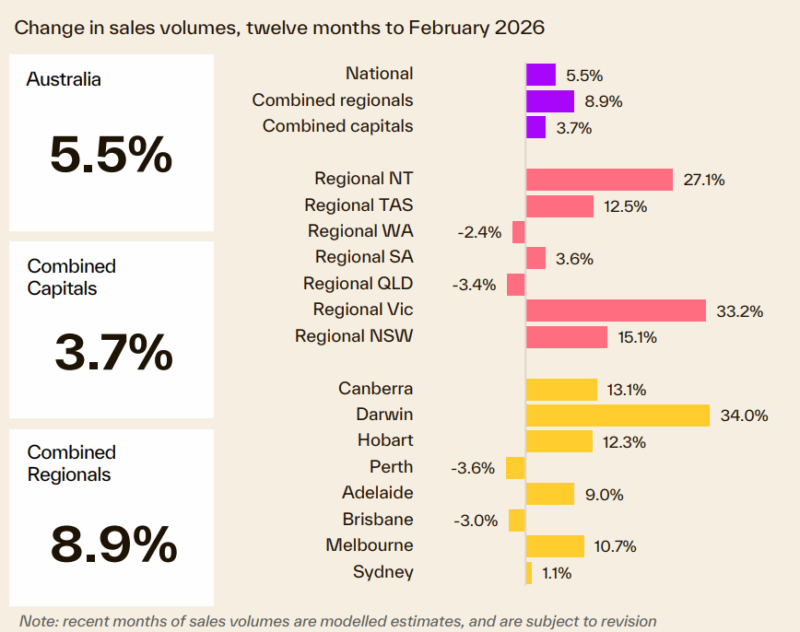
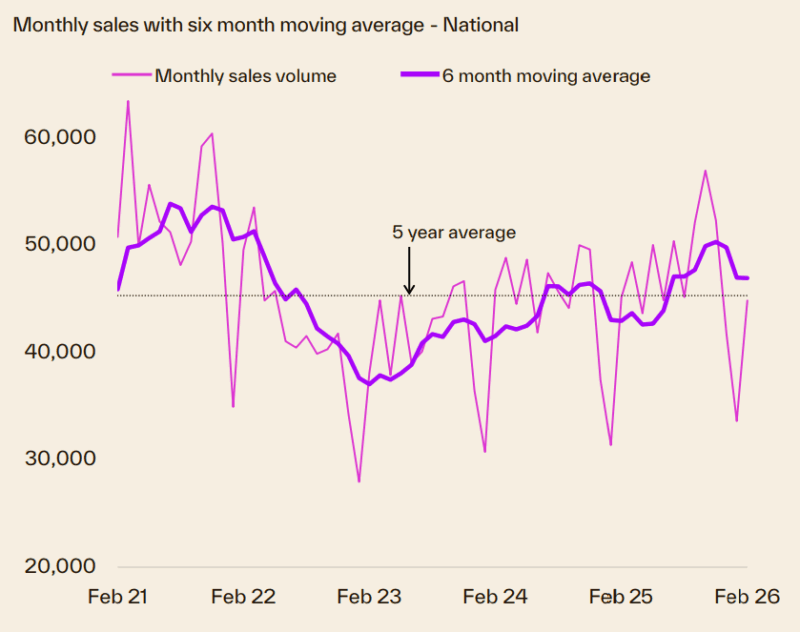
Transaction volumes
- The monthly trend in home sales is moving out of the seasonally weak months of December and January, with estimates of settled sales tracking 5.5% higher than a year ago over the rolling quarter to be slightly above the five-year (+0.7%).
- In annual terms, estimated sales are up 5.5% year on year, with regional markets leading the trend, up 8.9% compared with a 3.7% rise across the combined capitals.
- Across the capitals, Darwin has recorded the largest increase in estimated annual sales, jumping 34.0% compared with the same time in 2025.
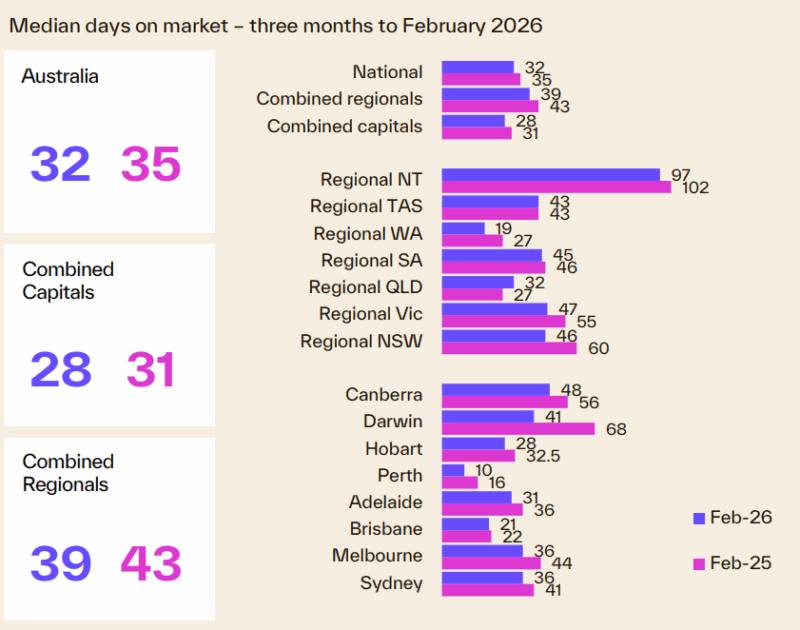
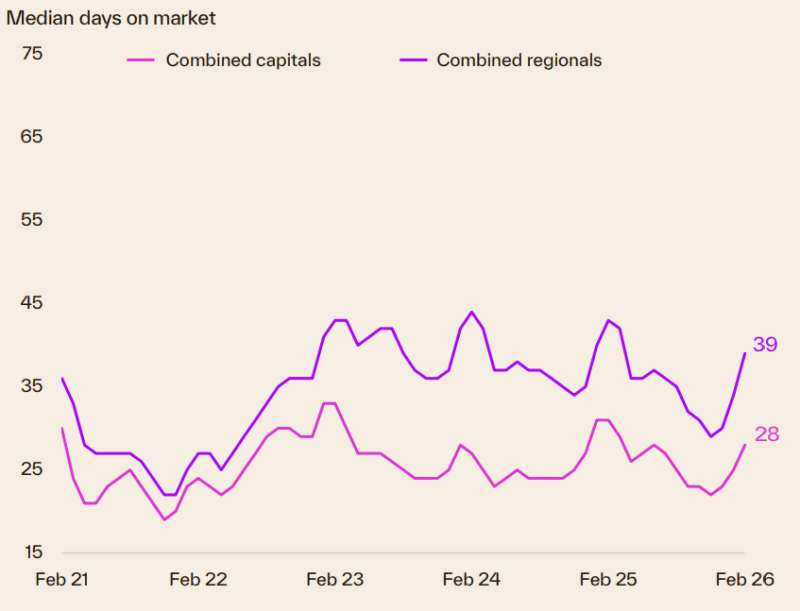
Compared to a year ago, homes are selling faster.
- The median number of days on market has shown a rise over recent months, at least partially due to seasonal factors, where selling time lifts through December and January.
- Capital city homes sold with a median of 28 days, three days faster than at the same time last year.
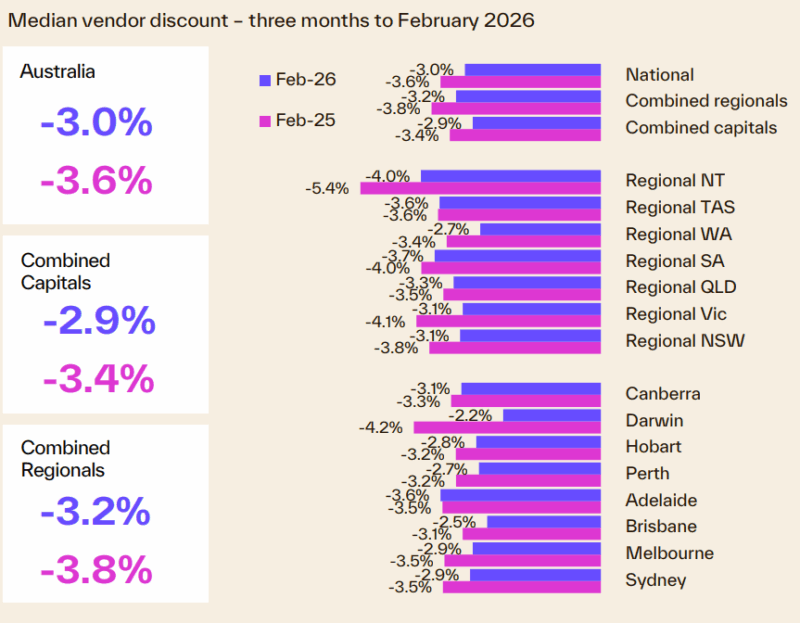
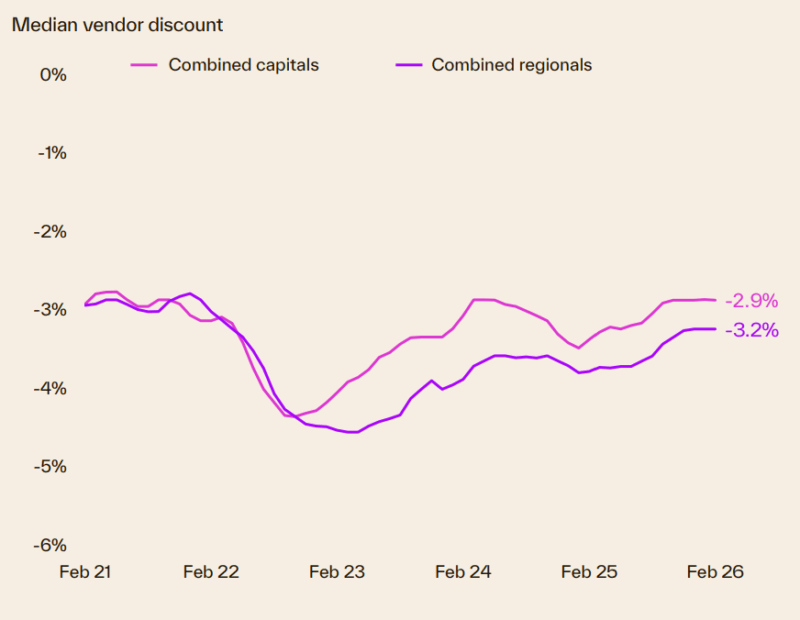
Vendor Discounting
- Discounting rates are holding close to record lows, but the trend has levelled.
- Capital city vendors are reducing their asking prices by a median of 2.9% to reach the contract price.
- Negotiation levels are more substantial across regional Australia, but also holding level since December 2025, with a median of 3.2%.
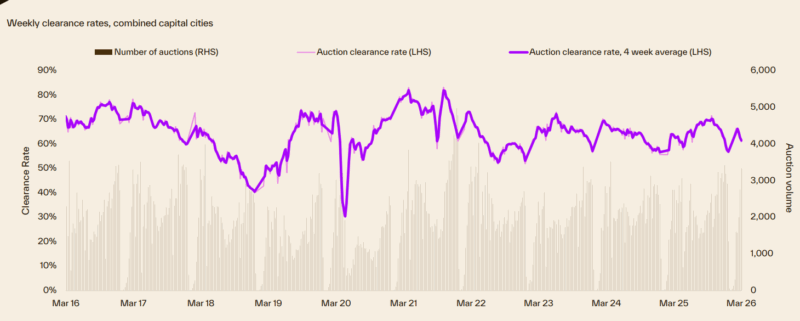
Auction clearance rates
- Auction clearance rates moved through a cyclical peak in late September 2025 at 72%, trending lower since that time to be below the decade average of 64% by mid-November.
- The early 2026 trend saw a partial recovery in auction trends, but the combined capitals clearance rate was once again trending lower from mid-February to reach 60.9% over the week ending March 1st.
- We update the weekly auction clearance results here each week.
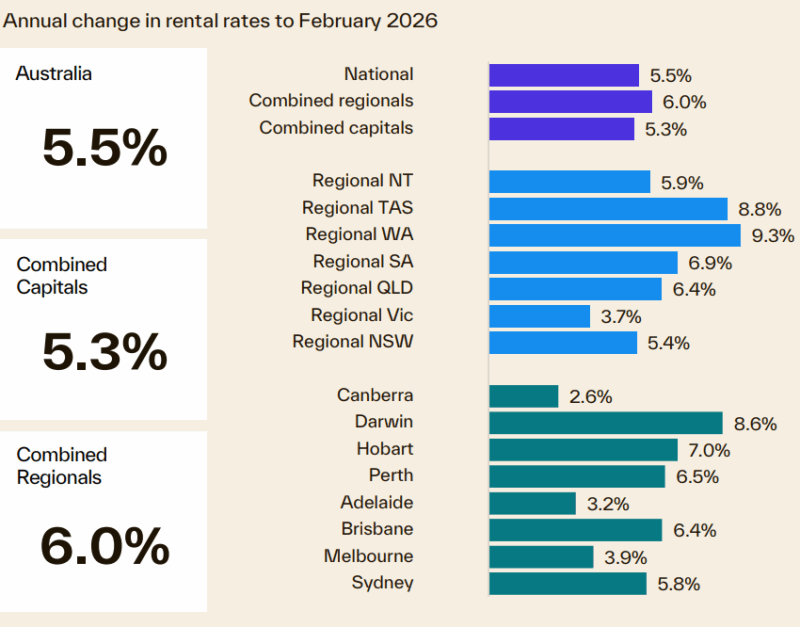
We're still experiencing a rental market crisis in Australia.
- The rental vacancy rate fell back to 1.5% in February tracking around record lows, supporting a reaccelerating trend in rental growth that has been evident mid-2025.
- The national rental index is up 5.5% over the 12 months to February, rising from a recent cyclical low of 3.4% mid-last-year.
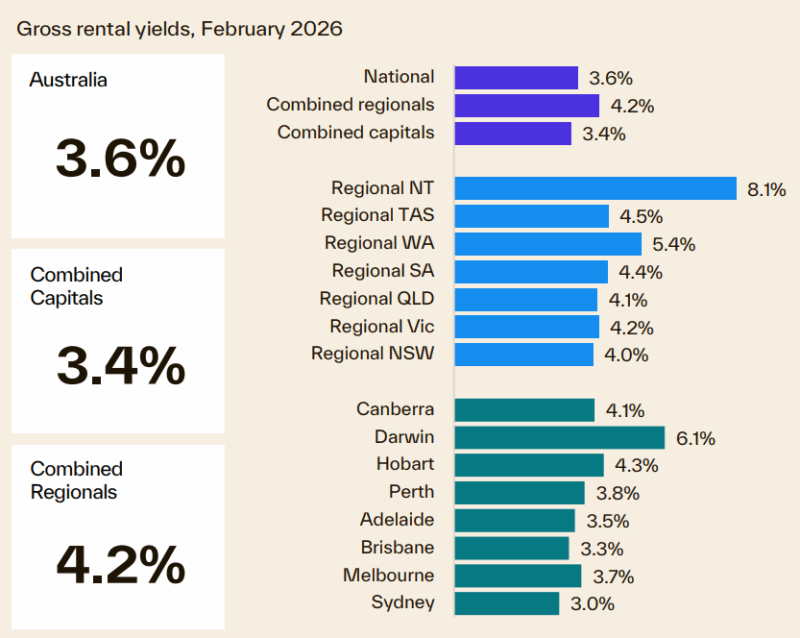
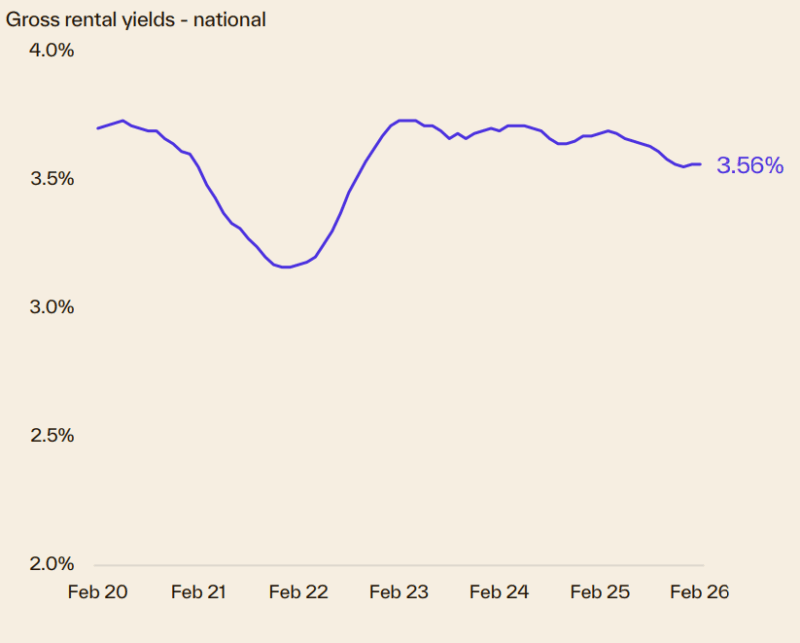
- Gross rental yields have been gradually easing since 2023 as growth in home values outpaces growth in rents.
- Nationally, the gross rental yield hasn’t been this low since September 2022.
- Gross yields vary substantially across the broad regions of Australia but tend to be higher across regional markets.
- Darwin stands out with stronger yields, recoded at 6.1% gross in February.
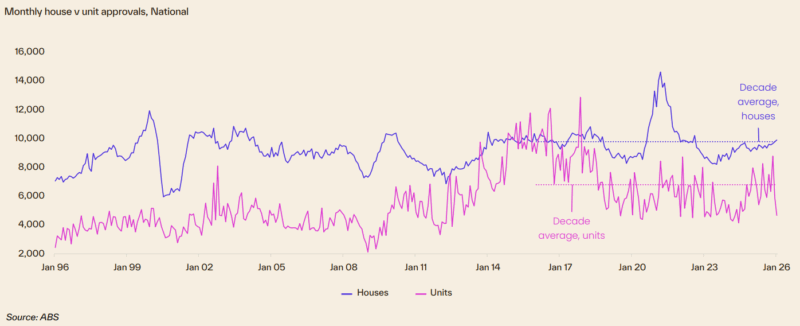
Dwelling approvals and housing credit
- Dwelling approvals recorded a 7.2% fall in January, attributable to a sharp 21.0% drop in unit approvals, offset by a 1.2% rise in house approvals.
- The steep fall in approvals across the unit sector comes after a 32% decline in December and a volatile run-up since mid-2024.
- Momentum is clearer across the detached housing sector, where approvals are 6.5% higher compared with a year ago and 1.2% above the decade average.
Finance and Lending
- The volume of home lending was 5.1% higher in the December quarter of 2025, easing from a 5.7% rise in Q3.
- Similarly, growth in the value of home lending eased from 10.9% in Q3 last year to 9.5%.
- Investors continue to drive lending indicators, with the volume of home lending for investment purposes up 5.5% over the quarter and 23.6% higher over the year, while owner occupier lending was 4.8% higher over the quarter and up 7.4% compared with a year ago.
- First home buyer lending was up sharply in Q4, increasing 6.8% by volume and 15.5% by value, coinciding with the expansion of the 5% deposit guarantee.
- First home buyers as a share of the value of home lending rose to 29.6% over the quarter, slightly above the decade average of 27.4%.
- First home buyers held the largest share of owner occupier demand in the Northern Territory (also the most affordable housing market), comprising 38.1% of lending.
- Firsts home buyers in NSW (27.0%) and Qld (27.3%) recorded the smallest share owner occupier lending.
Source of charts: Cotality Monthly Housing Chart Pack, March 2026
- Also read:This week’s Australian Property Market Update – Latest Data, State by State March 24th 2026

- Also read:Melbourne property market forecast for 2026 | Is it a good time to invest in Melbourne?

- Also read:Latest Property Price Forecasts Revealed. Australian Property Market Outlook 2026: Where To Now After The Rate Rise.

- Also read:Brisbane Property Market Forecast [2026] – What’s Ahead & Where to Invest

- Also read:Sydney property market forecast for 2026. Is it a good time to invest in Sydney?


