

Key takeaways
Cotality’s national home value index rose 0.7% in March, taking dwelling values 2.1% higher over the first quarter of the year.
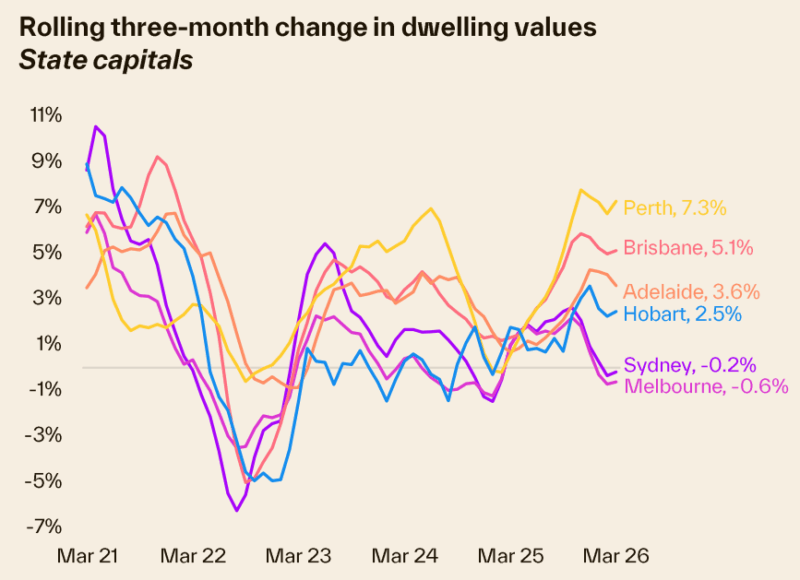
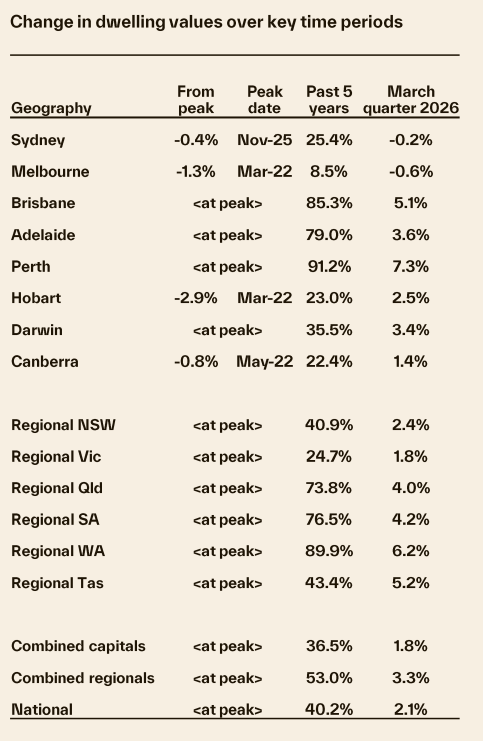
Perth surged 7.3% over the quarter, while Melbourne values are down -0.9% from the November high and the Sydney market is down -0.4%.
The median house price in Australia’s combined capital cities is now $1,171,294
The median unit price in Australia’s capital cities is $766,561
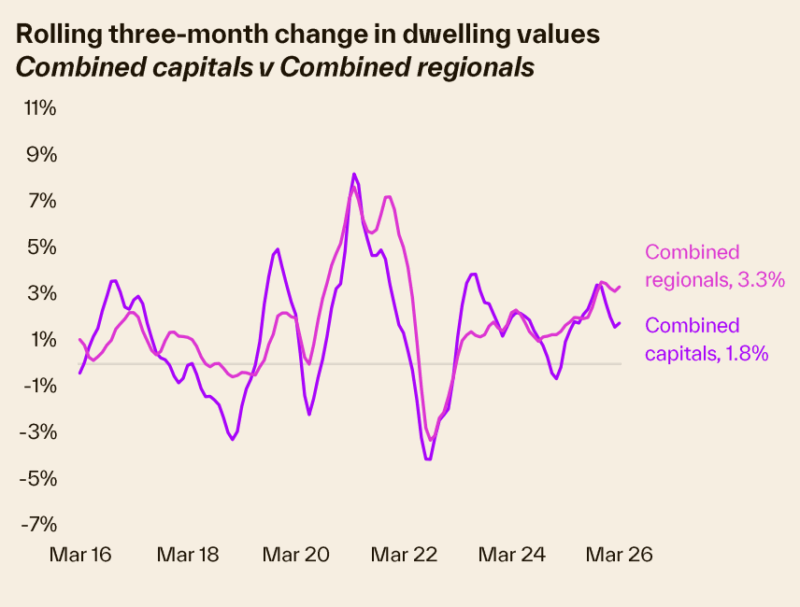
The median dwelling value in Australia’s combined regional areas is $758,788
But of course, there are markets within markets, so we detail the median prices for each capital city in this article.
National home prices increased in March to a new high, with Cotality’s national home value index rising by 0.7%, taking dwelling values 2.1% higher over the first quarter of the year.
Perth surged 7.3% over the quarter, while Melbourne values are down -0.9% from the November high and the Sydney market is down -0.4%.
Every month, investors, homeowners, and would-be buyers turn to the latest median property price data, hoping to make sense of what’s happening in our housing markets.
And while the numbers give us important clues, they don’t tell the full story.
You see...Australia’s property markets are being pulled in different directions.
On the one hand, there is continued demand driven by strong population growth, tight rental markets, a surge of first-time buyers taking advantage of government incentives and a chronic undersupply of new homes.
On the other hand, there is all the economic uncertainty at the moment, as well as the geopolitical pressures, relatively high interest rates, borrowing constraints, and affordability challenges are keeping some buyers on the sidelines.
That’s why it’s never been more important to look beyond the headlines.
In this update, I’ll break down what’s really going on behind the median price figures in each of our major capital cities.

Remember—there’s not one “Australian property market,” but many sub-markets moving at different speeds.
The mid-sized capitals, as well as Darwin, are all recording growth of 1.2% or more on a month-to-month basis, while Sydney and Melbourne experienced a subtle declining trend.
Since the end of November 2025, Melbourne values have retreated by -0.9%, and the Sydney market is down -0.4%.
The softer trend in values coincides with falling auction clearance rates and a pickup in advertised supply, providing buyers with more choice and less urgency at the negotiation table.
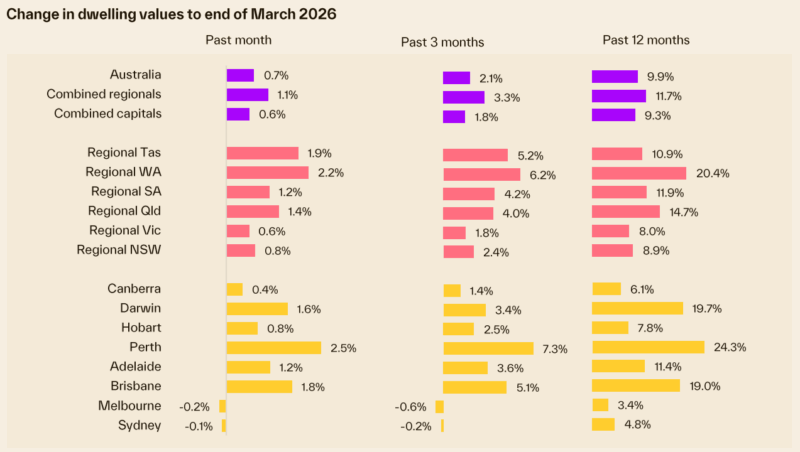
Change in dwelling values around Australia.
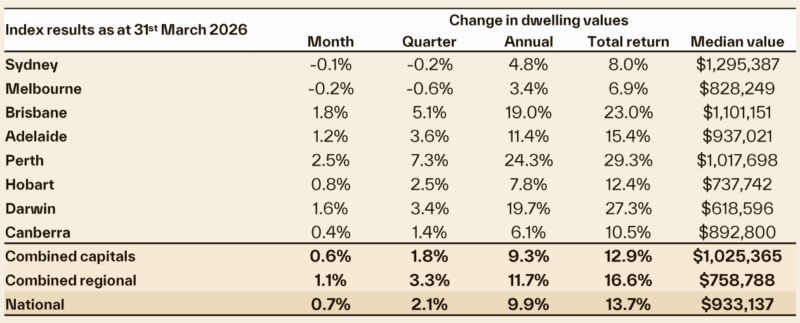
Source: Cotality 1st April 2026
- The median dwelling price for Australia now sits at $933,137
- The median dwelling price for our combined capital cities now sits at $1,025,365
- The median dwelling price for our combined regional towns sits at $758,788
Be careful how you interpret this data!

Note: The media keeps telling us that Perth, Brisbane and Adelaide have overtaken Melbourne in median values, but this is a little misleading.
They are quoting the "dwelling prices", but as you can see from the table below, Melbourne has double the number of units (apartments) relative to houses when compared to these other capitals, and this obviously skews the median ‘all dwellings’ values.
Percentage of Units in the Market
| City / Region | % units |
|---|---|
| Greater Sydney | 39.3% |
| Greater Darwin | 36.4% |
| ACT | 33.8% |
| Greater Melbourne | 33.0% |
| Greater Brisbane | 25.3% |
| Greater Hobart | 18.3% |
| Greater Adelaide | 16.3% |
| Greater Perth | 15.8% |
| Regional NT | 25.8% |
| Regional Qld | 25.0% |
| Regional NSW | 14.8% |
| Regional Vic. | 11.2% |
| Regional Tas. | 10.5% |
| Regional WA | 7.9% |
| Regional SA | 5.8% |
| Combined capitals | 30.0% |
| Combined regionals | 16.4% |
| National | 25.5% |
Source: CoreLogic
Current Australian house price trends
The following chart clearly shows that there is not "one property market" around Australia.
The following chart shows how our housing markets have performed over the last few years
What you need to know about median house prices
I’ve written a detailed article explaining why not to trust median property prices here.
However, understanding median house prices can be helpful because they give investors a rough guide about the locations they can afford.
Yet they should never be considered the Holy Grail of property data, because median prices tend to jump around from quarter to quarter, reflecting properties recently sold rather than what a particular property is worth.
In many locations, understanding the median house price is almost worthless because of the wide variation in sale prices, which means the area does not have a homogeneous housing style. For example, you could get a significant variation in property value for similar properties when you compare the more desirable locations within a particular suburb, such as a property having water views with less desirable ones such as on a busy road or even on a secondary main road or too near the train or with views of the service station across the street.
As you can see, if a suburb has housing of variable quality, the median house price is not very useful because some properties are simply more valuable than others.
However, if a suburb has very similar housing, such as renovated older homes on large blocks or a newer suburb where most of its housing stock was built over a few years, the median house price would be more relevant.
Melbourne's median property price
Here is the latest data on the median property prices for Melbourne.
| Property | Median price | Δ MoM | Δ QoQ | Δ Annual |
|---|---|---|---|---|
| All dwellings | $828,249 | -0.2% | -0.6% | 3.4% |
| Capital city houses | $982,876 | -0.4% | -0.9% | 4.0% |
| Capital city units | $644,074 | 0.3% | 0.1% | 2.0% |
| Regional dwellings | $633,838 | 0.6% | 1.8% | 8.0% |
Source: Cotality, 1st April 2026
Melbourne property values have risen 8.5% over the past 5 years and dropped -0.6% for the March 2026 quarter, and still -1.3% below their March 2022 peak.
Melbourne buyers have consistently enjoyed more choice than in other markets, and construction rates relative to Victoria's population growth have been somewhat balanced, unlike other parts of the country, where we are not building enough dwellings.
At the same time, the Victorian government has created uncertainty among investors and businesspeople, and local economic conditions are a significant factor in the health of the property market.
The result is that the Melbourne housing market has not performed as strongly as most other capitals over the last couple of years.However, there is currently a window of opportunity for strategic property investors as Melbourne property values still have significant upside potential.
The average price of a Melbourne standalone house is the lowest it has been relative to its Sydney equivalent in around 20 years.
Why the underperformance of the Melbourne market?
Partly, it might reflect the greater stock of housing available for sale in the Melbourne market relative to other states.
Also, investor demand has been lower in Melbourne due to discontent with the Victorian government's treatment of investors and its favouring of tenants.
However, this has changed over the last six months, with many investors now buying properties in Melbourne as they anticipate rising property values.
Also, one of the biggest short-term influences on the property market's performance is each city’s economy, and there is no doubt that there is plenty of negative sentiment about how the Victorian government is handling it.
However, the Melbourne housing markets are fragmented and not surprisingly, there is currently a flight to quality properties in Melbourne, with A-grade homes and "investment grade" properties still in short supply for the prevailing demand, but B Grade properties are taking longer to sell and informed buyers are avoiding C Grade properties.
Moving forward, strong immigration and a lack of property supply will continue to push Melbourne property prices higher.
Melbourne's auction results show the market depth experienced over the last few months, with virtually "boom time" results, with multiple buyers vying for good properties.
Sydney's median property price
Here is the latest data on the median property prices for Sydney.
| Property | Median price | Δ MoM | Δ QoQ | Δ Annual |
|---|---|---|---|---|
| All Capital city dwellings | $1,295,387 | -0.1% | -0.2% | 4.8% |
| Capital city houses | $1,601,782 | -0.3% | -0.6% | 5.3% |
| Capital city units | $911,743 | 0.3% | 0.8% | 3.5% |
| Regional dwellings | $833,540 | 0.8% | 2.4% | 8.9% |
Source: Cotality, 1st April 2026
The price of both Sydney houses and apartments had been rising for months, with a 25.4% increase over the past 5 years, but they are now -0.4% below their November 2025 peak.
Brisbane's median property price
Here is the latest data on the median property prices for Brisbane.
| Property | Median price | Δ MoM | Δ QoQ | Δ Annual |
|---|---|---|---|---|
| All Capital city dwellings | $1,101,151 | 1.8% | 5.1% | 19.0% |
| Capital city houses | $1,207,718 | 1.7% | 4.9% | 18.5% |
| Capital city units | $865,548 | 2.0% | 6.1% | 21.5% |
| Regional dwellings | $839,458 | 1.4% | 4.0% | 14.7% |
Source: Cotality, 1st April 2026
Brisbane's housing market has skyrocketed over the past 5 years, with a 85.3% trough-to-peak price growth, and is currently at a new peak.
Brisbane has remained one of the strongest-performing markets over the past few years, and our on-the-ground experience at Metropole Brisbane shows that there is still strong demand from both home buyers and property investors for A-grade homes and investment-grade properties, even though the rate of price increases is moderating.
Supply is struggling to keep up with rising demand, further supporting higher home values and apartment prices.
Adelaide's median property price
Here is the latest data on the median property prices for Adelaide.
| Property | Median price Δ | MoM Δ | QoQ Δ | Annual Δ |
|---|---|---|---|---|
| All Capital city dwellings | $937,021 | 1.2% | 3.6% | 11.4% |
| Capital city houses | $998,933 | 1.2% | 3.7% | 11.3% |
| Capital city units | $684,698 | 1.2% | 3.2% | 12.3% |
| Regional dwellings | $539,024 | 1.2% | 4.2% | 11.9% |
Source: Cotality, 1st April 2026
The Adelaide property market was one of the country's top performing markets and, after stalling a little in early 2025, Adelaide property values have kept increasing, now reaching new peaks.
The city’s homes were comparatively affordable, helping prices defy the period of rising interest rates, but this affordability gap is now disappearing.
Cotality data shows Adelaide values recorded a 5-year "trough to peak" growth of 79.0 per cent.
As in most capital cities, low stock levels are helping insulate home values, with increased competition among potential buyers.
The strong Adelaide auction clearance rates are an indication of the depth of the Adelaide property market, and while they are a little lower this year than last, the depth of buyer demand has kept Adelaide auction clearance rates high.
Perth's median property price
Here is the latest data on the median property prices for Perth.
| Property | Median price Δ | Δ MoM | Δ QoQ | Δ Annual |
|---|---|---|---|---|
| All Capital city dwellings | $1,017,698 | 2.5% | 7.3% | 24.3% |
| Capital city houses | $1,062,538 | 2.5% | 7.1% | 24.1% |
| Capital city units | $746,779 | 2.9% | 8.9% | 26.1% |
| Regional dwellings | $694,015 | 2.2% | 6.2% | 20.4% |
Source: Cotality, 1st April 2026
Perth’s housing market continues to stand out nationally, remaining the strongest market in the country for monthly and annual home price growth.
But remember...Perth housing values remained flat for most of the last decade, and over the last couple of years, house and unit values in Perth enjoyed their most significant increases and are currently at a new peak.
The relative affordability of the city’s homes, population growth, and very tight rental markets are also supporting home values.
Hobart's median property price
Here is the latest data on the median property prices for Hobart.
| Property | Median price | Δ MoM | Δ QoQ | Δ Annual |
|---|---|---|---|---|
| All Capital city dwellings | $737,742 | 0.8% | 2.5% | 7.8% |
| Capital city houses | $790,566 | 1.0% | 3.1% | 8.5% |
| Capital city units | $570,428 | 0.2% | -0.5% | 4.4% |
| Regional dwellings | $585,023 | 1.5% | 4.8% | 8.7% |
Source: Cotality, 1st April 2026
Hobart was once the darling of speculative property investors and the best-performing property market in 2017- 2018.
After rising 23% over the past 5 years, Hobart dwelling values have fallen and are still 2.9% below their March 2022 peak.
Hobart remains the weakest capital city market when comparing annual price growth, as well as the change from peak.
Darwin's median property price
Here is the latest data on the median property prices for Darwin.
| Property | Median price Δ | Δ MoM | Δ QoQ | Δ Annual |
|---|---|---|---|---|
| All Capital city dwellings | $618,596 | 1.6% | 3.4% | 19.7% |
| Capital city houses | $732,035 | 1.3% | 2.8% | 19.8% |
| Capital city units | $451,147 | 2.4% | 4.7% | 19.6% |
| Regional dwellings | n/a | n/a | n/a | n/a |
Source: Cotality, 1st April 2026
Darwin remains the most affordable capital city to purchase a house.
The city’s famously relaxed, laid-back lifestyle and its low-density population were a bonus in the post-pandemic era, driving interest in Darwin property.
After rising 35.5% over the past 5 years, Darwin is at a new peak price after rising 1.6% through March 2026.
Canberra's median property price
Here is the latest data on the median property prices for Canberra.
| Property | Median price | Δ MoM | Δ QoQ | Δ Annual |
|---|---|---|---|---|
| All Capital city dwellings | $892,800 | 0.4% | 1.4% | 6.1% |
| Capital city houses | $1,048,285 | 0.5% | 1.5% | 7.7% |
| Capital city units | $598,702 | 0.2% | 0.9% | 1.0% |
| Regional dwellings | n/a | n/a | n/a | n/a |
Source: Cotality, 1st April 2026
Home prices in Canberra rose in February and also 6.1% higher than their March 2025 levels.
Overall Canberra’s median house prices recorded 22.4% growth over the past 5 years but are still 0.8% below their peak in May 2022.
The subdued Canberra auction clearance rates throughout the last year are a sign of the weakness of the Canberra property market.
What should you do now as a property buyer?
Now that you’ve got the latest property price data at your fingertips, and hopefully a better understanding of what’s really happening on the ground, you’re already ahead of most buyers and investors.
But remember, data is only part of the picture. In my mind property investment is part science and part art.
The data is the science, but perspective is the art, and so it's important how you interpret the information and what you do with it.
If you’re serious about building wealth through property and want expert guidance to cut through the noise and avoid costly mistakes, why not organise a free Wealth Discovery Chat with the team at Metropole? Just click here to organise that.
We’ve been helping Australians grow, protect, and pass on their wealth for over 26 years, and we’d love to help you too.
Because while the market will keep moving, your financial future doesn’t have to be left to chance.
- Also read:This week’s Australian Property Market Update – Latest Data, State by State April 15th 2026

- Also read:Melbourne property market forecast for 2026 & 2027 | Why the opportunity is bigger than it looks

- Also read:Latest Property Price Forecasts Revealed. Australian Property Market Outlook 2026: Where To Now After The Rate Rise.

- Also read:Brisbane Property Market Forecast [2026] – What’s Ahead & Where to Invest

- Also read:Sydney property market forecast for 2026 and 2027 | Why the short-term softness is a long-term opportunity


