Key takeaways
New unemployment figures paint an uncertain picture for borrowers, businesses, and investors, but one key question continues to confound many commentators: Why isn’t our jobless rate higher?
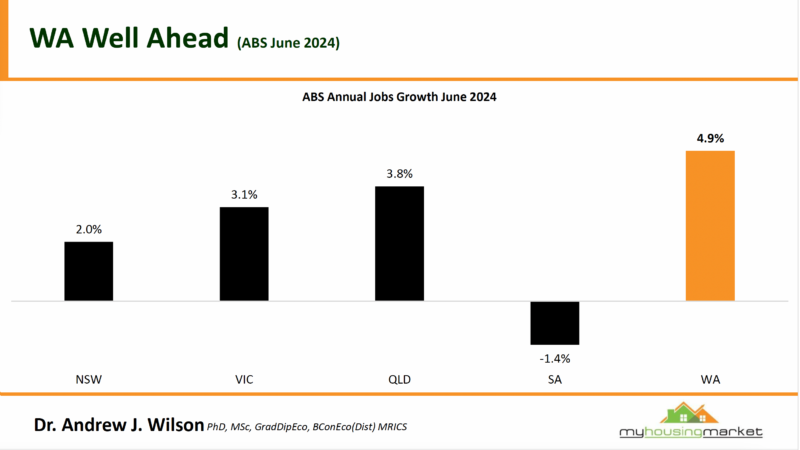
Job growth varied considerably amongst the various states, with Victoria surprisingly having strong annual job growth despite its slightly higher unemployment rate.
Regional property markets are performing strongly. Watch this week’s Property Insider chat as Dr. Andrew Wilson explains how the regional housing markets are performing around Australia.
New unemployment figures paint an uncertain picture for borrowers, businesses, and investors, but one key question continues to confound many commentators:
Why isn’t our jobless rate higher?
For the five years before the pandemic, Australia’s national unemployment rate ranged between 5 and 6 per cent. It spiked to 7.5% in mid-2020 but has been between 3.5 and the current 4.1% since 2022.
According to the Australian Bureau of Statistics, June’s jobless rate was up just 0.1 per cent to 4.1 per cent. So why has our unemployment remained relatively low despite so many more people coming to live in Australia, business collapses, rising mortgage stress, and an economy that has been shrinking on a per-person basis for most of the past two years?
And what do these latest figures mean for interest rates?
These are some of the questions I ask Dr. Andrew Wilson, chief economist of My Housing Market, in this week’s Property Insider chat. We also discuss the state of our regional housing markets and the weekend auction results.

Unemployment Rate Trends Higher
Watch this week’s Property Insider video as Dr. Andrew Wilson and I explain how the seasonally adjusted unemployment rate rose by less than 0.1 per cent to 4.1 per cent in June.
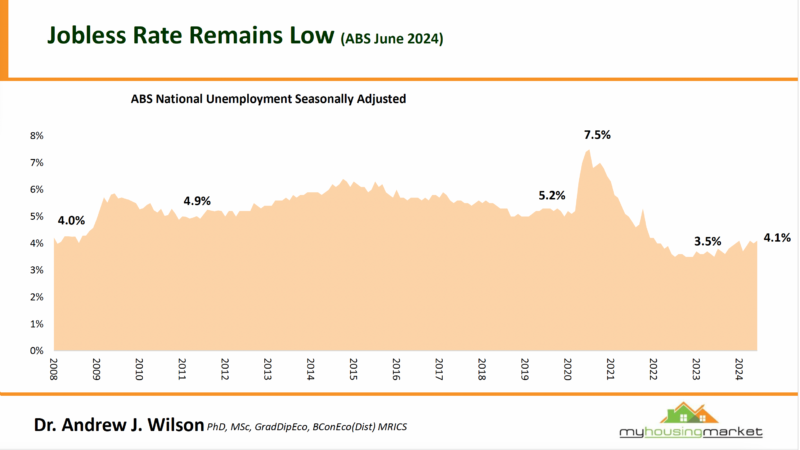
With employment rising by around 50,000 people and the number of unemployed growing by 10,000 people, the unemployment rate rose slightly to 4.1% and the participation rate rose to 66.9%.
The June participation rate is still very high and was only 0.1% points lower than the historical high of 67% in November 2023, meaning we are not having any challenges employing all the people entering the jobs market.
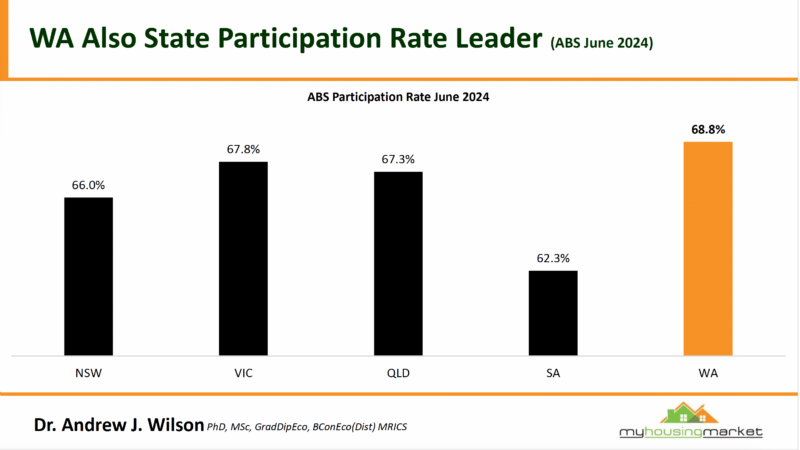
This, along with the continued high level of job vacancies, suggests the labour market remains relatively tight.

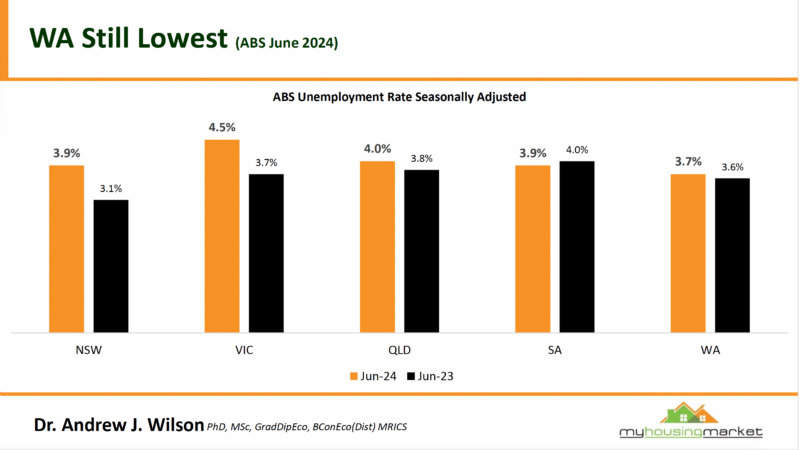
Note: WA and NSW were the states with the lowest jobless figures.
Unemployment rose by 10,000 people in June following a fall of 9,000 in May.
While it has increased from a low of 491,000 people in October 2022 to 608,000 in June, it is still around 100,000 people or 14.2% lower than just prior to the COVID-19 pandemic.
The unemployment rate was 0.5% points higher than June last year and 1.1% points lower than March 2020.
As you can see from the following chart, job growth varied considerably amongst the various states, with Victoria surprisingly having strong annual job growth despite its slightly higher unemployment rate.
- Also read:Perth housing market update | July 2024

- Also read:Australian housing market update [CoreLogic’s video] | July 2024
- Also read:Unemployment Uptick: What It Means for Interest Rates and the Housing Markets | Property Insiders
- Also read:Vacancy Rates Increased to 1.3% | SQM Research
- Also read:Latest Asking Prices State by State | Winter Lull takes Affect with Huge falls in Home Listings


Regional Property Markets
Regional property markets are performing strongly.
Watch this week’s Property Insider chat as Dr. Andrew Wilson explains how the regional housing markets are performing around Australia.
Beneath the national headline numbers, regional property markets are running at different speeds, but most regions are trending higher with regional Victoria and Tasmania being the exceptions.
Top 2024 Regions (June) - NSW:
| Region | Median | Year |
|---|---|---|
| Tweed | $1,091,250 | 18.6% |
| Ballina | $1,050,000 | 13.5% |
| Wollongong | $1,050,000 | 8.8% |
| Shellharbour | $912,500 | 6.7% |
| Wagga Wagga | $610,000 | 6.6% |
| Newcastle | $897,500 | 5.6% |
| Maitland | $755,000 | 4.9% |
| Shoalhaven | $802,500 | 4.2% |
| Dubbo | $586,250 | 3.8% |
| Port Macquarie-Hastings | $815,000 | 3.5% |
| Albury | $495,000 | 2.1% |
| Coffs Harbour | $787,500 | -1.3% |
Top 2024 Regions (June) - VIC:
| Region | Median | Year |
|---|---|---|
| Greater Shepparton | $438,000 | 6.8% |
| Surf Coast | $1,210,000 | 3.6% |
| Macedon Ranges | $970,000 | 2.1% |
| Greater Bendigo | $570,000 | 0.0% |
| Latrobe | $437,000 | -1.6% |
| Greater Geelong | $690,000 | -2.1% |
| Ballarat | $520,000 | -3.7% |
| Mornington Peninsula | $918,000 | -5.7% |
Top 2024 Regions (June) - QLD:
| Region | Median | Year |
|---|---|---|
| Townsville | $525,000 | 31.3% |
| Gold Coast | $1,050,000 | 21.4% |
| Bundaberg | $573,000 | 18.1% |
| Rockhampton | $501,300 | 18.0% |
| Toowoomba | $655,000 | 17.5% |
| Sunshine Coast | $995,000 | 13.7% |
| Mackay | $510,110 | 13.4% |
| Cairns | $630,000 | 12.5% |
| Noosa | $1,200,000 | 11.6% |
| Fraser Coast | $620,000 | 10.7% |
Top 2024 Regions (June) - TAS:
| Region | Median | Year |
|---|---|---|
| Clarence | $678,000 | -1.0% |
| Launceston | $540,000 | -1.8% |
| Hobart | $880,750 | -2.7% |
| Glenorchy | $543,000 | -9.4% |
Top 2024 Regions (June) - NT:
| Region | Median | Year |
|---|---|---|
| Palmerston | $519,000 | -0.2% |
| Darwin | $622,500 | -4.7% |
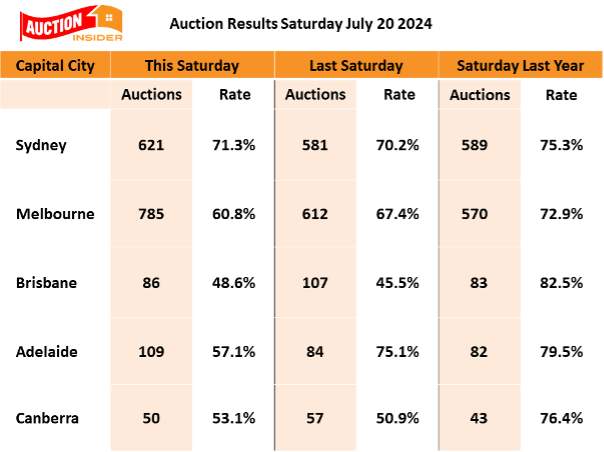
Mixed Bag of Auction Results as Winter School Holidays Finally End
Auction results were mixed at the weekend as the lengthy winter school holidays finally came to an end for all capitals, although listing numbers generally remained well ahead of the same time last year.
The national weekend auction market reported a clearance rate of 58.2%, which was below the 61.8% reported over the previous weekend – and significantly lower than the 77.3% recorded over the same weekend last year.
National auction numbers were higher at the weekend, with 1651 listings versus the previous weekend's 1441, and again well above the 1367 listed over the same weekend last year.
Weekend auction markets continue to report results reflecting the usual mid-winter slowdown in buyer activity, although seller activity continues to track higher than at the same time last year.