


Key takeaways
Australia's home building pipeline continues to shrink. National building approvals fell a further 2.0% in April following an 11.8% fall in March, and annual approvals across capital cities are now running 24.5% below the 2016 peak.
Unit approvals have been hit hardest. Capital city unit building approvals have fallen more than 41% from their 2016 high, creating a deepening structural shortage in the very dwelling type most in demand from renters and first-home buyers.
Building costs keep rising. The National House Building Costs Index reached 165.2 in April - up more than 63% since its January 2018 base - making it increasingly expensive to fill the supply gap even if approvals were to improve.
Auction markets are subdued but holding. Clearance rates across Sydney and Melbourne were steady week-on-week despite a post-holiday surge in listings, though they remain well below the levels seen this time last year.
What happens to property prices when the cost of building a home begins to settle, but the price of the land underneath it keeps climbing?
That is the contradiction emerging in Australia’s housing market right now.
In this week's Property Insider, Dr Andrew Wilson shows that annual growth in house-building costs has slowed considerably from its extraordinary peak.
That sounds like good news for housing affordability, but the reality is more complicated because building costs remain at historically high levels, residential land continues to become more expensive and rental listings are falling again.
Meanwhile, Australia’s auction markets are sending mixed signals. Melbourne and Adelaide are showing early signs of improvement, while Sydney remains subdued and Brisbane’s clearance rate has fallen below 30%.
So, are our property markets beginning to turn a corner, or are these simply some brief signs of life during the quieter winter months?
That is what Dr Andrew Wilson and I discuss in this week’s Property Insiders video, as we look behind the headlines at what the latest figures mean for homebuyers, property investors and Australia’s worsening housing shortage.
Watch this week’s video, then keep reading for my thoughts on what is really happening beneath the surface of our property markets.

House-building cost growth has fallen sharply
There is finally some encouraging news in Australia’s residential construction sector.
Watch this week's Property Insider chat as Dr Andrew Wilson shares his national house-building cost index, which shows that the annual rate of cost growth eased again in May, falling to 2.7%.
That is a dramatic improvement from the peak annual growth rate of 23.2% recorded during the height of the post-pandemic construction boom.
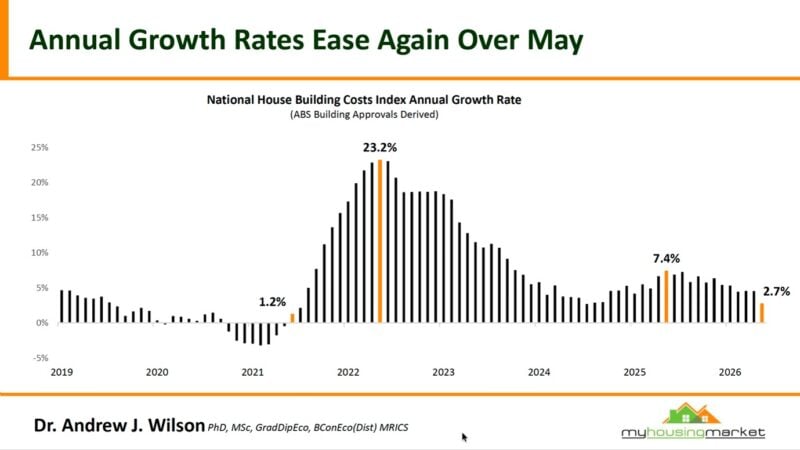
Building material shortages, disrupted supply chains, rising energy prices, labour shortages and extraordinary demand for new homes all contributed to that earlier surge.
Those pressures pushed numerous builders into insolvency and made many approved projects financially unviable.
A more stable construction cost environment should give builders, developers and consumers greater confidence when pricing new projects. It may also reduce the risk of builders taking on contracts at prices that later prove unsustainable.
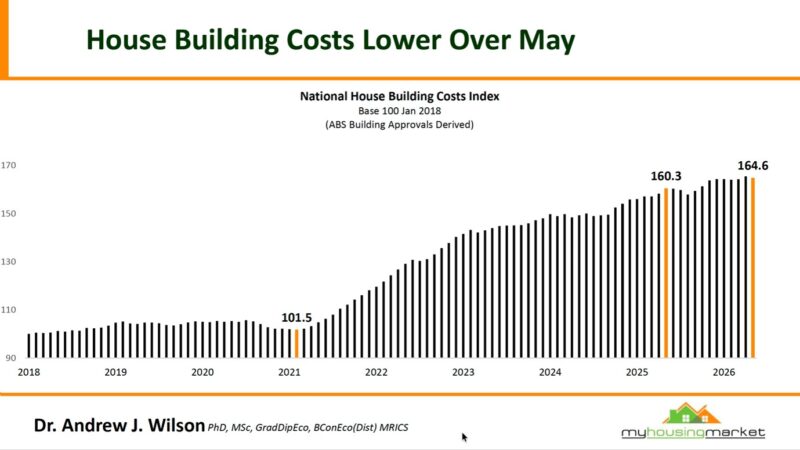
However, this needs to be kept in perspective. A lower rate of growth does not mean building costs have returned to where they were before the pandemic.
The national index stood at 164.6 in May, based on a starting point of 100 in January 2018. In other words, the underlying cost of building a house has risen by approximately 64.6% over that period.
While the pace of increase has slowed, the industry is still operating from a much higher cost base.
This distinction matters because some commentators may interpret slowing construction inflation as a sign that new homes should soon become cheaper and that's just not going to happen..
Builders still need to recover the cost of land, materials, labour, finance, insurance, planning delays and regulatory compliance. Developers also need an adequate margin to justify taking on the considerable financial and construction risks involved.
Many projects approved by local councils will remain on the drawing board because they are simply not financially feasible at prices buyers can afford to pay.
Cheaper construction inflation does not mean cheaper homes
The recent easing in building cost pressures is undoubtedly welcome, but it will not solve Australia’s affordability crisis.
Construction costs are only one component of the price of a new home.
Land prices, infrastructure contributions, government charges, holding costs, taxes and planning delays all feed into the final amount paid by the buyer.
Even if material and labour costs were to stabilise completely, developers would still be purchasing expensive sites and carrying those properties through a planning and construction process that can take years.
Finance has also become more expensive and difficult to obtain, particularly for apartment developments requiring substantial presales before lenders will release funds.
At the same time, buyers have less borrowing capacity, creating a widening gap between the price developers need to charge and the amount purchasers can afford.
This is why simply approving more dwellings does not guarantee that those homes will be built.
Governments like to announce approval numbers and housing targets, but the projects still need to stack up financially.
Until that happens, Australia’s housing supply response will remain much slower than our growing population requires.
Land prices continue to climb
Watch this week's Property Insider chat as Dr. Andrew Wilson discusses how the latest vacant residential land figures help explain why an easing in construction costs is unlikely to make housing more affordable.
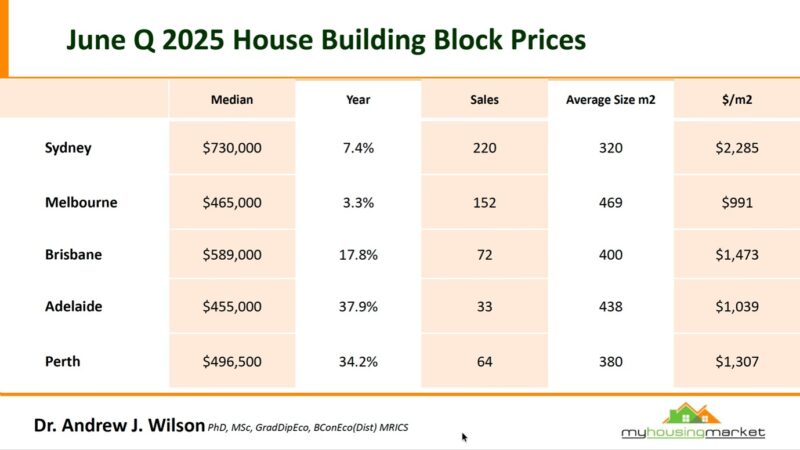
The median price of a house-building block reached $730,000 in Sydney, making it by far the most expensive of the major capital-city markets.
The average Sydney block was only 320 square metres, resulting in a land value of $2,285 per square metre.
Melbourne’s median land price was significantly lower at $465,000. Its average block size was also much larger at 469 square metres, producing a price of $991 per square metre.
The annual growth rates are a substantial increases and reflect the strong demand that has flowed into the more affordable capital cities over recent years.
However, the figures also expose a major problem.
As land becomes more expensive, the cost advantage traditionally enjoyed by these cities begins to narrow. Buyers may still find Adelaide, Perth or Brisbane cheaper than Sydney, but the entry price is moving rapidly beyond the reach of many households.
This also means developers must pay more for future sites and eventually pass those costs on to buyers.
The real scarcity is well-located land
Australia is a large country, but that does not mean we have an unlimited supply of desirable residential land.
People need to live within reasonable travelling distance of employment, schools, transport, health care and other essential services.
Much of the land released on our urban fringes requires expensive new infrastructure, and the block sizes are incredibly small, while residents may face long commuting times and limited access to established amenities.
This makes well-located land within our major cities particularly valuable.
Sydney’s extraordinarily high price per square metre demonstrates how scarcity, population pressure and planning restrictions become capitalised into land values.
Of course, the solution can’t be to continue pushing our capital cities further and further out.
Australia needs more well-designed apartments, townhouses and other forms of medium-density housing in established suburbs, particularly around transport, employment and existing infrastructure.
- Also read:Australian housing market update | July 2026

- Also read:Everything you need to know about the state of Australia’s property markets in 20 charts – July 2026

- Also read:National Weekly Auction Report – July 18th 2026 | Early Signs of Improvement Continue in Mid-winter Home Auction Markets

- Also read:National Vacancy Rate Rises to 1.3% | SQM Research

- Also read:This week’s Australian Property Market Update – Latest Data, State by State July 14th 2026

However, these developments also need to be commercially viable and appropriate for the surrounding neighbourhood.
Increasing density through poor-quality high-rise towers or generic developments that lack owner-occupier appeal may add to the dwelling count, but it does not necessarily create the type of housing communities need.
We need more supply, but we also need better supply in the right locations.
Rents are rising as listings fall
Watch this week's Property Insider chat as Dr Andrew Wilson shares the latest rental figures, which provide another warning about the underlying housing shortage.
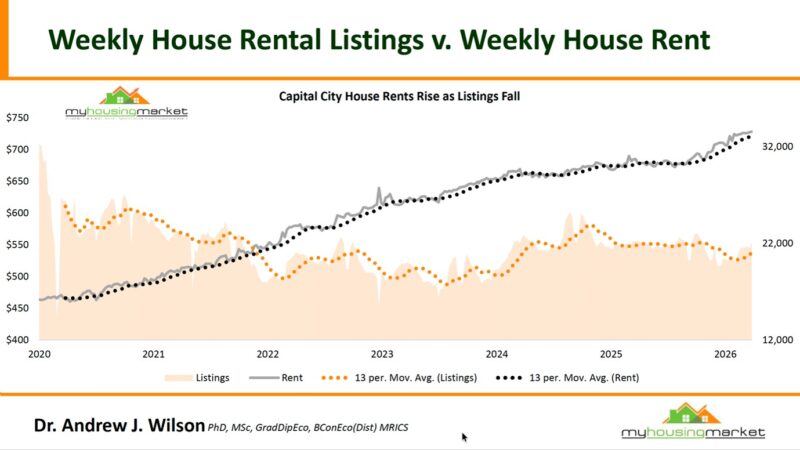
Dr Wilson’s data shows capital-city house rents continuing to rise as the number of weekly rental listings falls.
This is the basic imbalance that has driven Australia’s rental crisis for several years.
Our population has grown more quickly than our housing stock, while many private investors have been discouraged by higher interest rates, rising land taxes, increased regulation and growing ownership costs.
When fewer properties are available and more tenants are competing for them, rents inevitably come under upward pressure.
However, rents cannot rise indefinitely because tenants are also dealing with higher costs for food, electricity, insurance, transport and other essentials. There is a limit to what households can afford, regardless of how tight the rental market becomes.
This is why the rental crisis cannot be solved by continually shifting more costs onto property investors and expecting tenants to absorb the consequences.
Australia relies heavily on private investors to provide rental accommodation. Policies that encourage investors to leave the market or discourage them from purchasing their next property will eventually reduce rental supply.
The effects may not appear immediately, but they are likely to be felt through fewer available properties, more competition between tenants and higher rents over time.
Auction markets show tentative improvement
While building costs and land prices tell us about the longer-term housing supply equation, auction results provide a more immediate indication of buyer and seller confidence.
The latest results show some early signs of improvement in the mid-winter auction markets, although conditions remain relatively subdued and listing numbers are seasonally low.
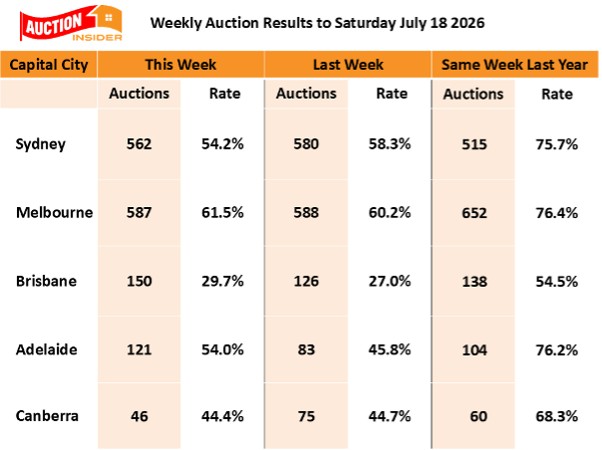
The year-on-year comparison shows just how much buyer sentiment has changed.
During the same week last year, Sydney, Melbourne and Adelaide were all recording clearance rates above 75%.
Clearly, buyers have become more cautious and price-sensitive.
Yet the weekly improvement in Melbourne and Adelaide suggests some buyers are beginning to re-enter the market, particularly where vendors have adjusted their expectations.
Melbourne’s auction market deserves particular attention. Its monthly clearance rate has fallen from 76.1% in July last year to 59.7% this July, but the latest weekly result of 61.5% suggests conditions may be beginning to stabilise.
Melbourne has underperformed most other capital cities in recent years and remains relatively affordable compared with Sydney.
Investor sentiment has been damaged by Victoria’s property taxes and increasingly onerous rental regulations, but population growth and household formation continue to create demand for housing.
Of course, this does not mean every Melbourne property represents an opportunity.
There is a significant difference between a well-located property with scarcity and strong owner-occupier appeal and a generic apartment or house-and-land package in an area where substantial new supply can be created.
However, the current softer conditions may allow strategic investors to purchase quality established properties with less competition than they would face in a stronger market.
In my experience, the best opportunities often emerge before the broader market becomes confident again.
By the time the recovery is obvious in the data and the media begins reporting stronger prices, more buyers have usually returned and vendors become less willing to negotiate.
Why the national headlines can mislead investors
These figures remind us that there is no single Australian property market.
Sydney land costs more than twice as much per square metre as Melbourne land, while Adelaide and Perth are recording land price growth above 30%.
Melbourne’s auction market is showing tentative improvement, while Brisbane’s clearance rate remains below 30%.
Even within each city, there are multiple markets divided by price, location and property type.
Investment-grade properties in established, affluent suburbs can perform very differently from new properties on the urban fringe or investor-dominated apartment towers.
This is why investors should be wary of making decisions based on broad headlines about prices rising or falling.
National and capital-city figures can help us understand the direction of the market, but they cannot identify which individual assets will outperform over the long term.
Property selection remains critical.
What this means for property investors
The latest data reinforces the gap between short-term market sentiment and Australia’s long-term housing fundamentals.
Buyers remain cautious; auction clearance rates are significantly lower than a year ago, and borrowing conditions continue to limit purchasing power.
At the same time, the cost of producing new housing remains high, residential land prices continue to rise, and rental listings are falling.
This combination is likely to create fragmented markets.
Properties with weak locations, little scarcity or limited owner-occupier appeal may struggle because buyers have become more selective.
Quality properties in desirable locations should remain more resilient because the underlying scarcity of these assets has not disappeared.
For strategic investors, softer conditions can provide more time to conduct due diligence and negotiate with motivated vendors.
However, a slower market does not turn a secondary property into an investment-grade asset.
The focus should remain on well-located properties in areas where household incomes are growing, owner-occupiers dominate, supply is constrained and residents are prepared to pay a premium to live.
Investors also need appropriate financial buffers because the next stage of the cycle is unlikely to move in a straight line.
There will be continuing uncertainty around interest rates, taxation, household spending and government housing policy, but waiting for every uncertainty to disappear usually means waiting until the best buying conditions have passed.


