


Key takeaways
Cotality’s national home value index rose 0.3% in April, the slowest pace of growth since January 2025.
The result was dragged lower by Sydney and Melbourne, where values fell 0.6% over the month. While the mid-sized capitals have also lost momentum over the past month.
Growth is increasingly concentrated in lower-priced segments where credit availability plays a key role along with first home buyer incentives and investor activity.
Capital city home sales were estimated to be 5.4% lower than a year ago as advertised stock levels lifted in the weakest markets.
Outcomes should remain diverse as factors like the Iran conflict and affordability constraints guide momentum through 2026.
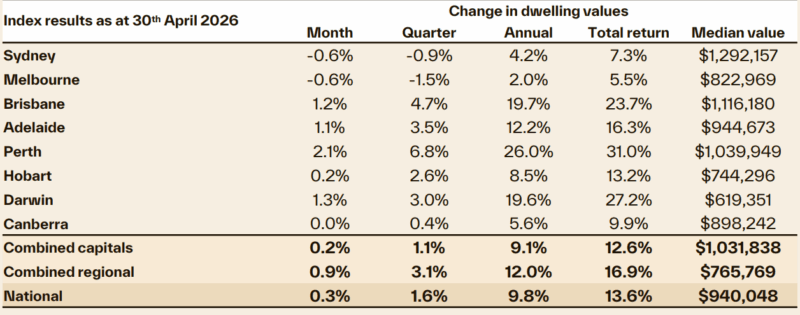
Cotality’s national home value index rose 0.3% in April, the slowest pace of growth since January 2025, just ahead of last year’s rate-cutting cycle.
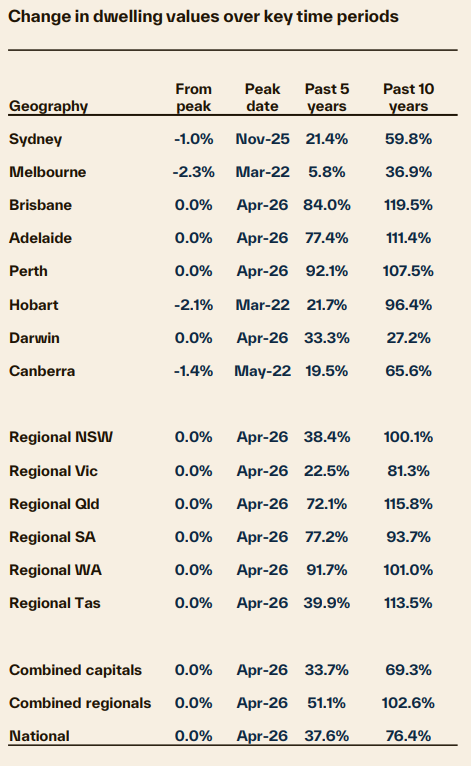
The national result was dragged lower by Sydney and Melbourne, where values fell 0.6% over the month.
Sydney home values are now 1.0% below their November peak, while Melbourne values are 1.9% below their November 2025 cyclical high and 2.3% below the March 2022 peak.
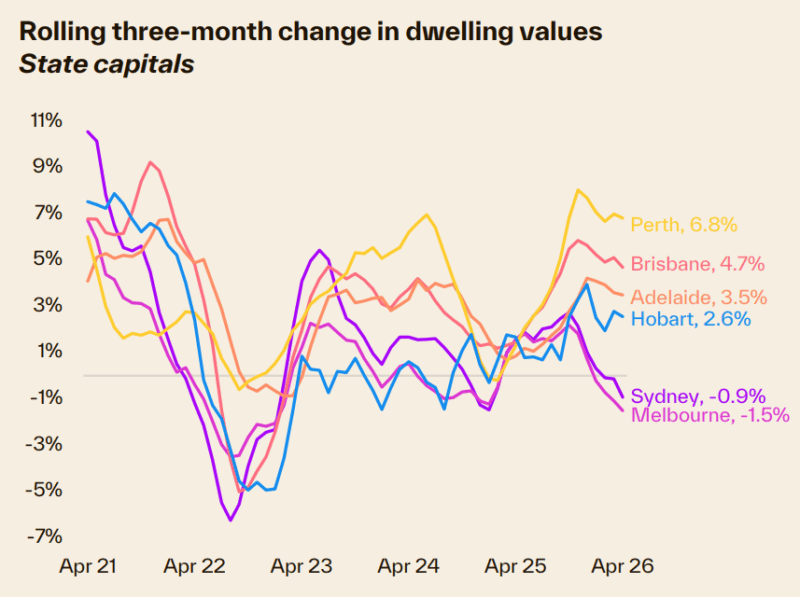
Every capital city recorded a slower pace of growth in April, but conditions remain highly diverse
Perth’s growth is clearly losing steam, but the market remains strong; values rose 2.1% in April, adding more than $21,000 to the median dwelling value.
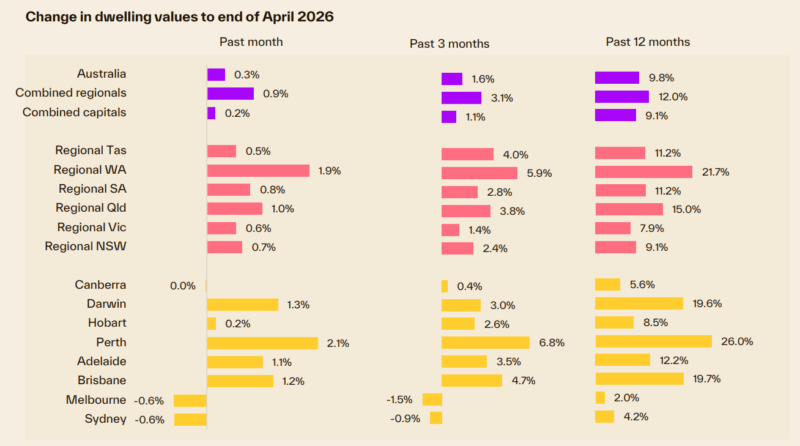
Brisbane, Adelaide and Darwin also saw growth slow, but from a high base, with values still rising by more than 1% month-on-month in each city.
The easing in market conditions has been building since late last year.
The housing market was losing momentum from late last year as affordability and serviceability constraints weighed on demand.
Now we have the additional downside pressure of higher interest rates, sentiment has fallen off a cliff, and rising inflation is set to drive the cost of debt even higher.
Softer housing conditions have been accompanied by a slowdown in buyer demand
Estimates of capital city home sales over the past three months were 5.4% lower than a year ago and 7.4% below the previous five-year average.
Advertised stock levels have also lifted in the weakest markets, sitting 9.4% above the five-year average in Sydney and 2.2% above average in Melbourne.
While inventory remains tight across the mid-sized capitals, advertised listings are also rising in these markets—albeit from a low base and still well below typical levels for this time of year.
This imbalance between demand and supply is also showing up in auction clearance rates, which have held below 55% since the last week of March.
Growth is increasingly concentrated in lower-priced segments, a trend that is becoming more evident—and more widespread geographically.
Every capital city is recording stronger growth in the lower quartile, as demand concentrates where credit availability and first home buyer incentives have the greatest influence.
The largest difference between upper and lower quartile value growth is in Sydney, where lower-tier house values are up 2.9% year-to-date compared with a 3.3% fall across the most expensive quarter of the market.
Regional markets have been more resilient amid the broader slowdown
This is supported by relatively lower values and above-average internal migration.
Over the first four months of the year, the combined regionals index rose 4.2% versus a 1.8% lift across the combined capitals.
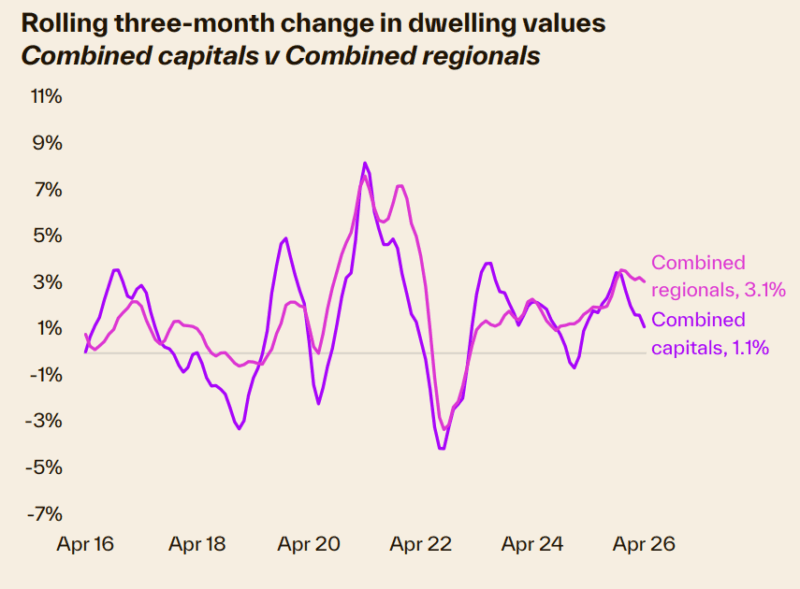
Even so, momentum is easing, with the 0.9% monthly rise in April being the smallest increase in nine months.
Focusing on SA4 sub-markets over the first four months of the year, the strongest growth conditions have been in WA’s Bunbury (+9.8%), Queensland’s Darling DownsMaranoa (+7.9%) and the Far West & Orana of NSW (+7.5%).
No regional sub-markets have recorded a decline in values over the first four months of the year.
Outlook
Housing demand is facing a formidable and worsening set of headwinds.
This is driven by a mix of cyclical and external factors that are weighing on value growth and purchasing activity.
- Also read:This week’s Australian Property Market Update – Latest Data, State by State July 28th 2026

- Also read:Latest Property Price Forecasts. Australian Property Market Outlook 2026-2027: Navigating a Market Correction

- Also read:National Weekly Auction Report – July 25th 2026 | Chilly July Auction Market Concludes with Some Resilient Signs

- Also read:Perth housing market update | July 2026

- Also read:Adelaide housing market update | July 2026

Importantly, the housing slowdown was already underway before interest rates rose in February and March, and well ahead of the conflict in Iran.
Housing affordability is at record lows across most capitals.
Mortgage serviceability has deteriorated as inflation runs ahead of wages, and higher interest rates have reduced borrowing capacity.
Population growth has also eased back toward more normal levels after the post-pandemic surge, removing a key demand tailwind that supported housing activity in recent years.
More recently, geopolitical uncertainty and a global oil crisis have added to downside risks.
While the inflationary impacts of the Iran conflict are yet to flow through to the official data, the effect on household confidence and balance sheets has been swift.
Consumer sentiment has fallen sharply, prompting a more cautious approach to high-commitment financial decisions such as property purchases.
Historically, sentiment has been closely linked to home sales.
With oil prices 30–50% above pre-war levels, inflation risks are skewed to the upside and interest rates are expected to
rise further.
This adds to existing affordability and serviceability pressures.
Financial markets are currently pricing in at least two more 25bp rate hikes in 2026.
These dynamics are increasingly evident in housing market indicators.
Beyond the easing in value growth, auction clearance rates are holding well below average, signalling more challenging selling conditions.
At the same time, advertised listings are beginning to lift in most markets.
More choice and longer selling times are reducing urgency among buyers, pointing to a gradual shift toward more balanced conditions.
In markets where stock levels are elevated, conditions are already moving in buyers’ favour.
At the same time, demand remains highly price-sensitive, with lower-value segments facing the greatest competition.
First home buyer stimulus and serviceability barriers are concentrating demand below the median value.
Housing supply constraints remain a key offset, providing some support for home values
But not enough to stave off declines in markets where listings have risen above average levels.
New dwelling construction continues to undershoot underlying demand, and this gap could widen through the year as higher oil and fuel prices add to construction costs.
Labour market conditions also remain tight, supporting income security and limiting the risk of forced selling.
Together, these factors should help buffer housing values against a sharp downturn.
Overall, the outlook points to a further loss of momentum rather than a material correction.
As a result, housing market outcomes are likely to remain highly diverse, with conditions varying markedly by price point and region as 2026 progresses.


