
Key takeaways
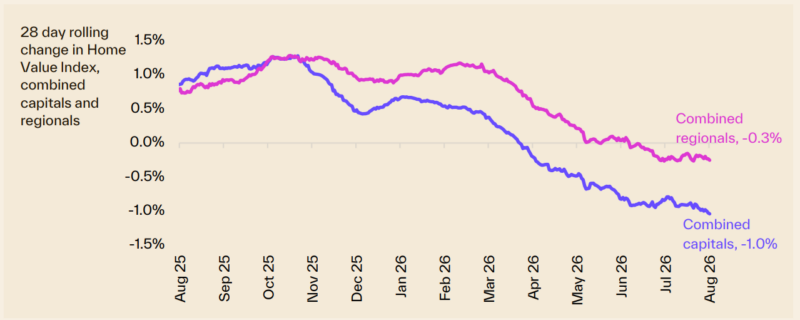
Australia’s housing downturn continued last week, with combined capital city dwelling values falling 0.3% and declining 1.0% over the past month.
Sydney and Melbourne remain the weakest major markets, with values down 3.7% and 4.0% respectively over the year.
Brisbane, Adelaide and Perth are still recording strong annual gains, although each market has now moved into a monthly decline.
The unemployment rate rose to 4.5% in July as employment fell by 16,000, participation declined and hours worked dropped by 0.6%.
Annual wage growth eased to 3.2% in the June quarter, suggesting that wage pressures are gradually moderating.
The softer labour market and contained wage growth reduce the immediate pressure on the Reserve Bank to raise interest rates again, although inflation remains too high for the Bank to relax.
Auction volumes increased by 10.2% last week, but the preliminary combined capital city clearance rate fell to 53.2%, indicating that buyers retain considerable negotiating power.
Rental markets remain tight, with national rents rising 5.9% over the year and combined capital city rental listings 5.3% lower than a year ago.
This remains a highly fragmented market in which quality properties in affluent, supply-constrained locations should outperform secondary properties.
Strategic investors should maintain adequate financial buffers and use the current slowdown to position themselves for the next stage of the property cycle.
Australia’s property markets continue to cool, although the latest employment and wage figures suggest the Reserve Bank may have less reason to raise interest rates again in the near term.
Cotality’s latest figures show combined capital city dwelling values fell 0.3% over the past week and 1.0% over the past month, although they remain 2.4% higher than a year ago.
Sydney values declined 1.4% over the month and are now 3.7% lower than a year ago, while Melbourne values fell 1.1% over the month and 4.0% annually.
Brisbane, Adelaide and Perth are also recording monthly declines, although they remain 13.0%, 9.5% and 18.7% higher respectively than a year ago.
Clearly, Australia doesn't have one property market, and these citywide figures conceal significant differences between suburbs, price points and property types.
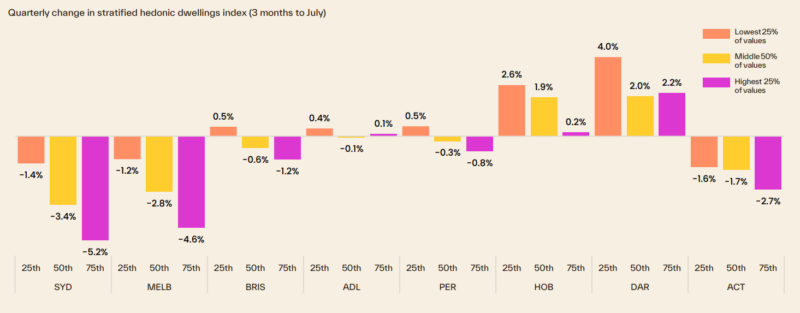
The upper end of the market is absorbing most of the pain, with premium properties nationally down more than 3% over the past quarter while lower-priced housing has held comparatively firm.
And rents keep climbing regardless of what's happening to values, up 5.9% over the past year, pushing gross rental yields to their highest level since August 2019.
Meanwhile, the seasonally adjusted unemployment rate rose from 4.4% to 4.5% in July as employment fell by 16,000 and total hours worked declined by 0.6%.
Annual wage growth also eased to 3.2% in the June quarter, down from 3.4% a year earlier and well below the 4.3% peak recorded in late 2023.
This is broadly the slowdown the Reserve Bank has been trying to achieve, and the latest figures reduce the immediate pressure for another interest rate rise.
However, inflation remains above target, so interest rates are likely to remain higher for longer and borrowing capacity will continue to constrain property demand.
At the same time, population growth, inadequate housing construction and rising building costs continue to support the market’s longer-term fundamentals.
Rental conditions also remain tight, with national rents increasing 5.9% over the year and rental listings across the combined capitals falling 5.3%.
In my view, this remains a cyclical correction that is creating opportunities for financially prepared buyers, but careful property selection is essential.
Quality properties with scarcity, strong owner-occupier appeal and exposure to affluent households should continue to outperform secondary properties as our markets move through this next phase of the cycle.

On the auction front this week... Capital city auction volumes rise as preliminary clearance rate eases to 53.2%
The preliminary clearance rate across the combined capital cities declined to 53.2% last week, compared to 56.5% two weeks prior, which represented the highest early success rate in the preceding 12 weeks.
Sydney was the only capital where the preliminary clearance rate rose over the week.
See Cotality's full auction report below.
This week, Cotality also reports that:
- Sydney property prices declined -0.4% over the last week, also declined -1.4% over the last month, and are -3.7% lower than they were 12 months ago.
- Melbourne property prices declined -0.3% over the last week, also declined -1.1% over the last month, are -4.0% lower compared to 12 months ago.
- Brisbane property prices declined -0.4% over the last week, declined -0.7% over the last month and are 13% higher than they were 12 months ago.
Overall, Australian capital dwelling prices declined -1% over the last month and are now 2.4% higher than they were 12 months ago.
Clearly, the property cycle is moving on but our markets are very fragmented.
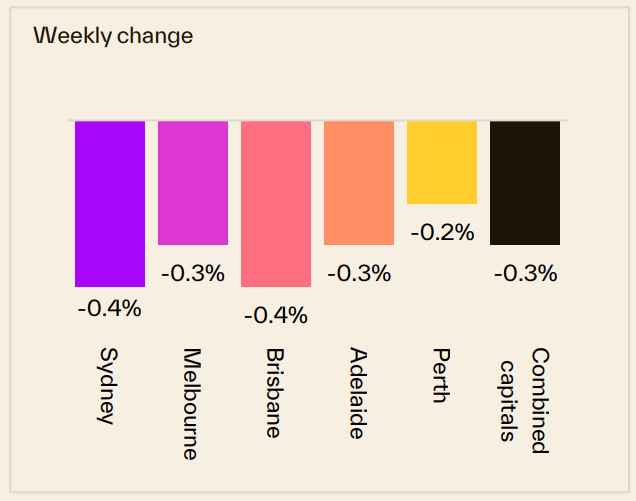
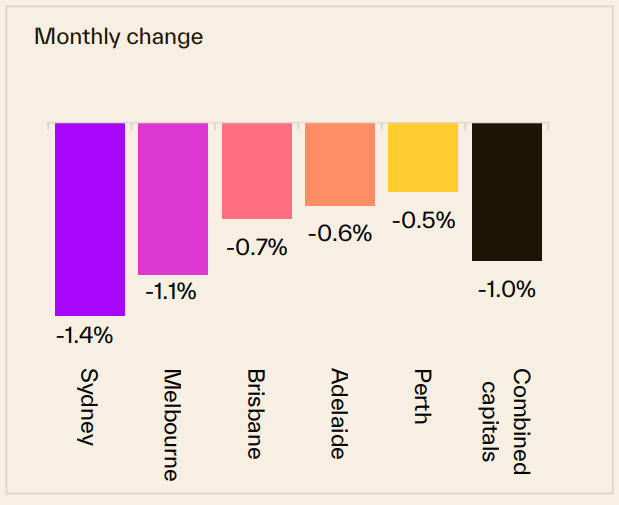
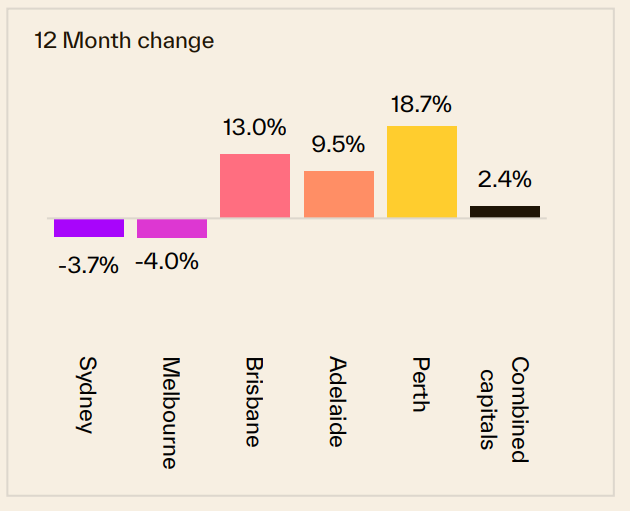
Source: Cotality August 24th 2026
Of course, these are "overall" figures - there is not one Sydney or Melbourne or Brisbane property market.
And various segments of each market are performing differently.
At the beginning of this cycle the upper quartile of the market lead the upswing but last year the lower quartile across every capital city recorded a stronger outcome for housing values relative to its upper quartile counterpart.
The following chart shows how various segments of each capital city market are performing differently, with median-priced properties performing well.
To help keep you up-to-date with all that's happening in property, here is my updated weekly analysis of data and charts as of 24h August 2026, provided by SQM Research, Cotality, and realestate.com.au.
Current property asking prices
Property asking prices are a useful leading indicator for housing markets - giving a good indication of what's ahead.
Here is the latest data available:
Sydney
| Property type | Price ($) | Weekly Change | Monthly Change % | Annual % change |
|---|---|---|---|---|
| All Houses | 2,050.512 | 7.578 | -0.8% | 0.8% |
| All Units | 892.205 | 1.795 | 0.5% | 3.1% |
| Combined | 1,576.658 | 5.212 | -0.5% | 1.2% |
Source: SQM Research
Melbourne
| Property type | Price ($) | Weekly Change | Monthly Change % | Annual % change |
|---|---|---|---|---|
| All Houses | 1,301.506 | -0.016 | -0.4% | 0.5% |
| All Units | 676.938 | 0.462 | 0.0% | 6.5% |
| Combined | 1,104.061 | 0.135 | -0.3% | 1.6% |
Source: SQM Research
Brisbane
| Property type | Price ($) | Weekly Change | Monthly Change % | Annual % change |
|---|---|---|---|---|
| All Houses | 1,368.503 | -8.203 | -1.6% | 7.8% |
| All Units | 846.257 | -6.962 | -1.4% | 13.5% |
| Combined | 1,235.994 | -7.888 | -1.6% | 8.6% |
Source: SQM Research
Perth
| Property type | Price ($) | Weekly Change | Monthly Change % | Annual % change |
|---|---|---|---|---|
| All Houses | 1,280.958 | -17.509 | -0.3% | 10.9% |
| All Units | 783.292 | -0.588 | 0.3% | 18.7% |
| Combined | 1,150.015 | -13.057 | -0.2% | 12.2% |
Source: SQM Research
Adelaide
| Property type | Price ($) | Weekly Change | Monthly Change % | Annual % change |
|---|---|---|---|---|
| All Houses | 1,106.882 | -1.103 | -2.0% | 5.1% |
| All Units | 628.153 | -1.653 | -0.2% | 11.4% |
| Combined | 1,020.465 | -1.202 | -1.8% | 5.7% |
Source: SQM Research
Canberra
| Property type | Price ($) | Weekly Change | Monthly Change % | Annual % change |
|---|---|---|---|---|
| All Houses | 1,230.818 | -0.693 | -1.9% | -0.1% |
| All Units | 603.700 | 6.050 | 0.8% | 2.6% |
| Combined | 991.423 | 1.881 | -1.4% | 0.0% |
Source: SQM Research
Darwin
| Property type | Price ($) | Weekly Change | Monthly Change % | Annual % change |
|---|---|---|---|---|
| All Houses | 854.473 | 2.527 | 2.0% | 7.7% |
| All Units | 490.409 | -1.659 | -0.1% | 11.5% |
| Combined | 711.282 | 0.881 | 1.4% | 8.7% |
Source: SQM Research
Hobart
| Property type | Price ($) | Weekly Change | Monthly Change % | Annual % change |
|---|---|---|---|---|
| All Houses | 907.386 | -0.097 | -1.6% | 7.9% |
| All Units | 536.914 | 0.486 | 1.2% | 8.0% |
| Combined | 850.554 | -0.008 | -1.3% | 7.9% |
Source: SQM Research
National
| Property type | Price ($) | Weekly Change | Monthly Change % | Annual % change |
|---|---|---|---|---|
| All Houses | 1,066.905 | 4.868 | -0.4% | 5.7% |
| All Units | 659.980 | 1.034 | 0.7% | 10.9% |
| Combined | 978.175 | 4.032 | -0.2% | 6.4% |
Source: SQM Research
Cap City Average
| Property type | Price ($) | Weekly Change | Monthly Change % | Annual % change |
|---|---|---|---|---|
| All Houses | 1,521.600 | -0.746 | -0.7% | 2.7% |
| All Units | 793.700 | -0.544 | 0.4% | 7.0% |
| Combined | 1,303.037 | -0.685 | -0.5% | 3.3% |
Source: SQM Research
The value of property asking prices as a leading indicator for housing markets is quite significant.
In fact it's more valuable than median prices which can be quite misleading.
Let's delve into why this is the case and how it impacts the real estate market.
- Early Market Sentiment Indicator: Asking prices often reflect the current sentiment of sellers in the real estate market.
If sellers are confident, they might set higher asking prices, anticipating strong demand.
Conversely, if sellers are uncertain or perceive a market downturn, they might lower their asking prices to attract buyers.
This makes asking prices a real-time indicator of market sentiment, often preceding changes in actual sales prices. - Predictive of Future Price Trends: Trends in asking prices can be predictive of where the actual property prices are headed.
For example, a consistent rise in asking prices over a period can signal an upcoming rise in transaction prices. - Impact of Economic Factors: Economic factors such as interest rates, employment rates, and broader economic health influence asking prices.
For instance, changes in the Reserve Bank of Australia's policies or shifts in the job market can quickly reflect in the asking prices, providing insights into how these factors are influencing the housing market. - Regional Variations: In a diverse market like Australia's, asking prices can also provide insights into regional disparities.
For instance, the property markets in Melbourne and Sydney might behave differently from those in Brisbane or Perth. Asking prices can give early indications of these regional trends. - Influence of Supply and Demand: Asking prices are also a response to the balance of supply and demand in the market.
In areas with limited supply and high demand, asking prices tend to be higher and vice versa.
However, it's important to note that while asking prices are a valuable indicator, they should not be used in isolation.
Other factors like actual sales prices, time on the market, auction clearance rates, and economic conditions also play crucial roles in understanding the property market dynamics.
READ MORE: The latest median property prices in Australia’s major cities
- Also read:This week’s Australian Property Market Update – Latest Data, State by State August 25th 2026

- Also read:Melbourne property market forecast for 2026 & 2027 | Separating the fundamentals from the sentiment
- Also read:Brisbane Property Market Forecast [2026 & Beyond] – What The Olympics Decade Means for Investors.
- Also read:Sydney property market forecast for 2026 and 2027 | Why the short-term softness is a long-term opportunity

- Also read:Latest Property Price Forecasts. Australian Property Market Outlook 2026-2027: Navigating a Market Correction

Last weekend's auction report
Capital city auction volumes rise as preliminary clearance rate eases to 53.2%
The preliminary clearance rate across the combined capital cities declined to 53.2% last week, compared to 56.5% two weeks prior, which represented the highest early success rate in the preceding 12 weeks.
Sydney was the only capital where the preliminary clearance rate rose over the week.
The number of homes taken to auction increased last week, reaching 1,406 across the combined capitals, 10.2% above the previous week (1,276), though 31.9% short of the 2,066 held at the same point a year earlier.
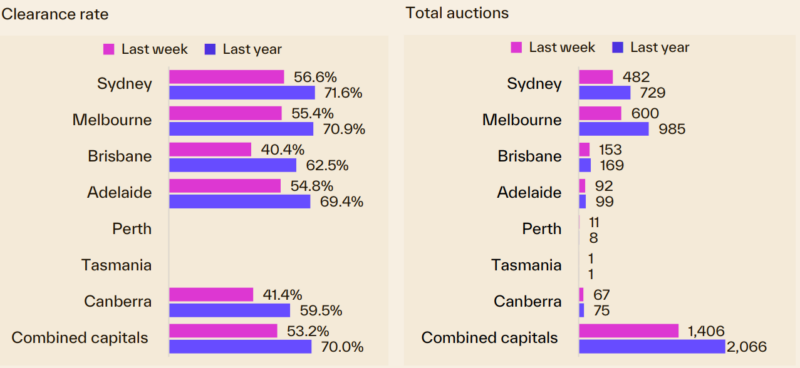
Melbourne held the most auctions, with 600 homes going under the hammer last week, up 2.0% on the week prior but 39.1% below the level a year ago.
The preliminary clearance rate fell to 55.4%, the city's weakest in four weeks.
In Sydney, the preliminary clearance rate improved to 56.6%, up from 55.6% the previous week.
A total of 482 homes went to auction, 17.6% more than the previous week but 33.9% fewer than the same week a year ago.
Despite the weekly improvement, this is the 16th consecutive week that Sydney's preliminary clearance rate has remained below 60%.
153 homes were taken to auction in Brisbane, up 7.7% from the previous week but 9.5% below the same week a year earlier, with 40.4% reporting a sale on preliminary results.
A total of 92 homes went to auction in Adelaide, up 9.5% on the previous week but 7.1% lower than a year ago.
Of the 92 homes taken to auction, 54.8% were successful on preliminary results.
Canberra's preliminary clearance rate declined to 41.4%, compared to 60.0% the previous week.
The number of auctions increased to 67 homes, up from 43 the prior week but below the 75 recorded during the same period last year.
In Perth, only eleven auctions were held, with just two resulting in a sale so far.
The single auction scheduled in Tasmania was withdrawn.
Our rental markets
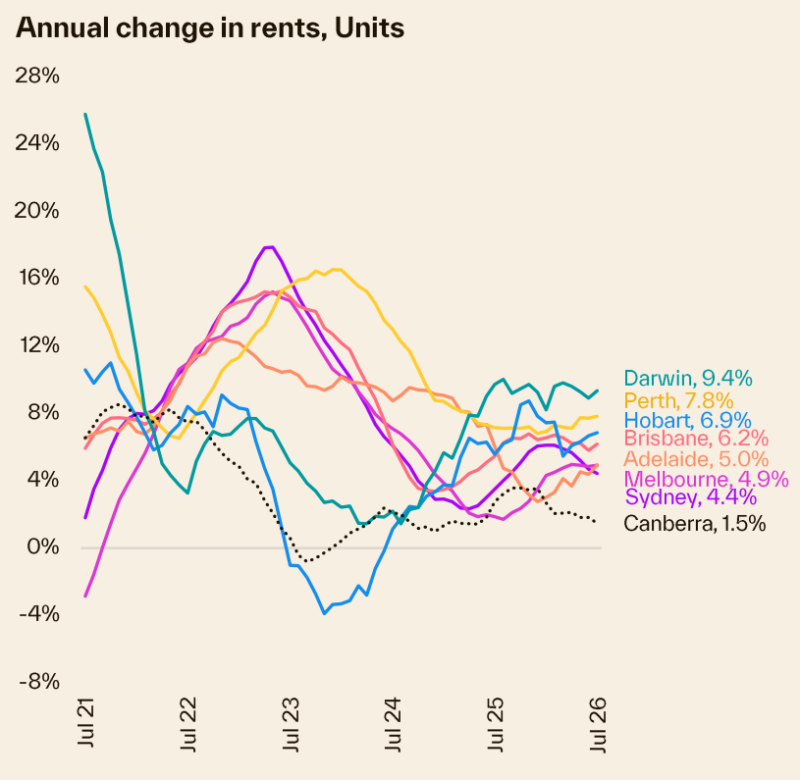
Cotality’s national rental index rose by 0.4% seasonally adjusted in July , continuing a modest slowing trend in monthly growth from recent peaks in January.
That said, annual rental growth has remained elevated, increasing by 5.9% yoy for the third straight month .
This is the equivalent of adding around $40/week to the median rent over the past year.
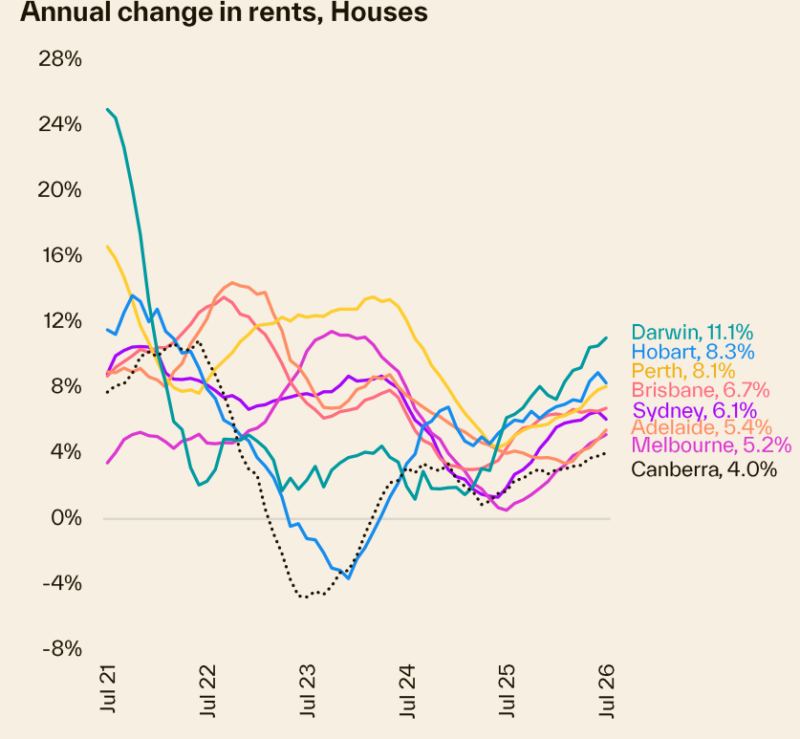
Across the cities, annual rental growth was strongest in Darwin (up 10.4%), Perth (8.1%) and Hobart (8.0%).
In contrast, there was weaker growth in the ACT (3.3%), while rental growth in Melbourne (5.1%) and Adelaide (5.3%) was a little below the national average.
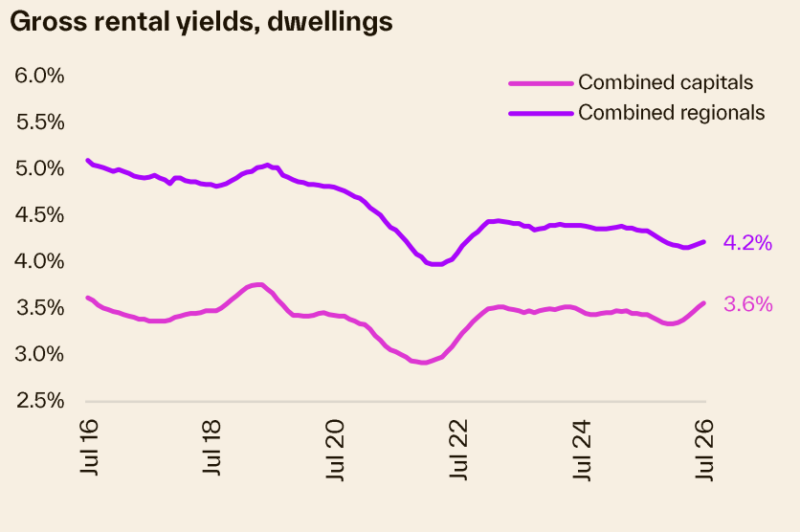
Gross rental yields have continued to move higher in recent months, reflecting the increase in rents against the decline in home values nationally.
In July, the gross rental yield across the combined capitals was 3.56%, its highest rate since August 2019.
Across the major capitals, yields are highest in Melbourne (4.0%) and lowes in Sydney (3.3%) and Brisbane (3.4%).
Sydney
| Property Type | Rent ($) | Weekly change | Monthly change | 12 Months change |
|---|---|---|---|---|
| All Houses | $1,134.83 | -4.83 | -1.3% | 4.7% |
| All Units | $756.55 | -1.55 | -0.3% | 6.2% |
| Combined | $910.05 | -2.88 | -0.8% | 5.5% |
Source: SQM Research
Melbourne
| Property Type | Rent ($) | Weekly change | Monthly change | 12 Months change |
|---|---|---|---|---|
| All Houses | $817.45 | -1.46 | -0.1% | 6.7% |
| All Units | $605.52 | 0.49 | -0.1% | 4.9% |
| Combined | $694.70 | -0.33 | -0.1% | 5.9% |
Source: SQM Research
Brisbane
| Property Type | Rent ($) | Weekly change | Monthly change | 12 Months change |
|---|---|---|---|---|
| All Houses | $846.32 | 2.67 | 1.9% | 9.5% |
| All Units | $647.07 | -1.07 | 0.5% | 5.3% |
| Combined | $756.52 | 0.98 | 1.4% | 7.9% |
Source: SQM Research
Perth
| Property Type | Rent ($) | Weekly change | Monthly change | 12 Months change |
|---|---|---|---|---|
| All Houses | $895.67 | -1.68 | 0.6% | 8.4% |
| All Units | $656.52 | -9.52 | -2.1% | 1.3% |
| Combined | $797.14 | -4.90 | -0.4% | 5.9% |
Source: SQM Research
Adelaide
| Property Type | Rent $) | Weekly change | Monthly change | 12 Months change |
|---|---|---|---|---|
| All Houses | $688.96 | 1.04 | 0.7% | 3.1% |
| All Units | $549.39 | -2.38 | -1.2% | 4.2% |
| Combined | $642.05 | -0.12 | 0.1% | 3.5% |
Source: SQM Research
Canberra
| Property Type | Rent ($) | Weekly change | Monthly change | 12 Months change |
|---|---|---|---|---|
| All Houses | $826.87 | -3.87 | -1.8% | 6.5% |
| All Units | $604.80 | 1.20 | -0.2% | 4.4% |
| Combined | $704.30 | -1.08 | -1.0% | 5.4% |
Source: SQM Research
Darwin
| Property Type | Rent ($) | Weekly change | Monthly change | 12 Months change |
|---|---|---|---|---|
| All Houses | $830.74 | -24.73 | -1.7% | 7.9% |
| All Units | $663.50 | -0.50 | 0.5% | 16.6% |
| Combined | $732.10 | -10.44 | -0.5% | 12.5% |
Source: SQM Research
Hobart
| Property Type | Rent 9$) | Weekly change | Monthly change | 12 Months change |
|---|---|---|---|---|
| All Houses | $638.26 | -2.27 | 3.6% | 11.0% |
| All Units | $569.40 | -8.40 | -1.6% | 13.2% |
| Combined | $610.87 | -4.71 | 1.6% | 11.8% |
Source: SQM Research
National
| Property Type | Rent ($) | Weekly change | Monthly change | 12 Months change |
|---|---|---|---|---|
| All Houses | $778.00 | 6.00 | 0.1% | 7.0% |
| All Units | $613.00 | 0.00 | 1.7% | 7.9% |
| Combined | $701.68 | 3.23 | 0.7% | 7.4% |
Source: SQM Research
Cap City Average
| Property Type | Rent ($) | Weekly change | Monthly change | 12 Months change |
|---|---|---|---|---|
| All Houses | $920.00 | -5.00 | -0.3% | 5.9% |
| All Units | $678.00 | -3.00 | -0.7% | 5.0% |
| Combined | $791.57 | -3.94 | -0.5% | 5.5% |
Source: SQM Research
Here's how many properties are for sale at the moment
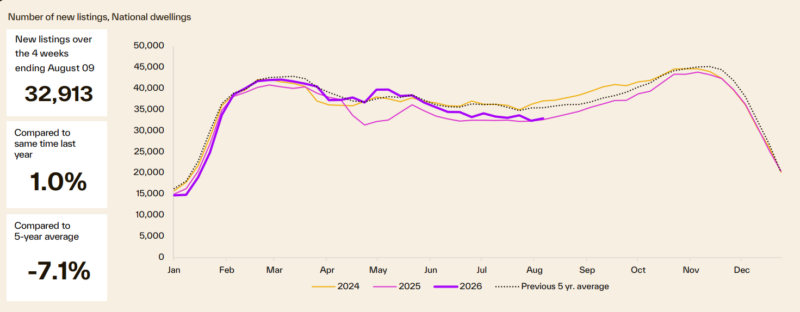
New listing activity has eased since reaching a peak in early March, with the usual winter slowdown alongside cyclical factors reducing the number of properties coming onto the market.
While the flow of new listings has remained above last year's levels for most of the year, freshly listed properties were tracking 7.1% below the five-year average over the four weeks ending August 9th.
Vendor metrics
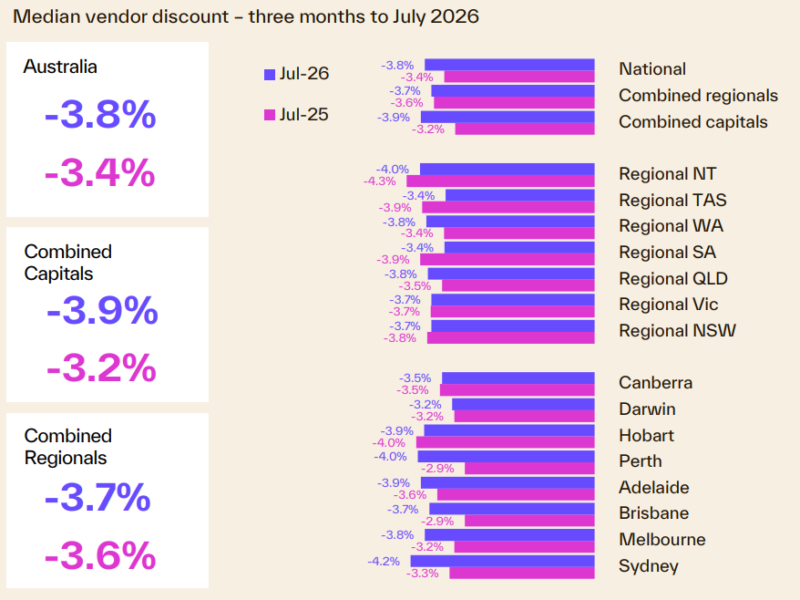
Compared to a year ago, homes are taking slightly longer to sell.
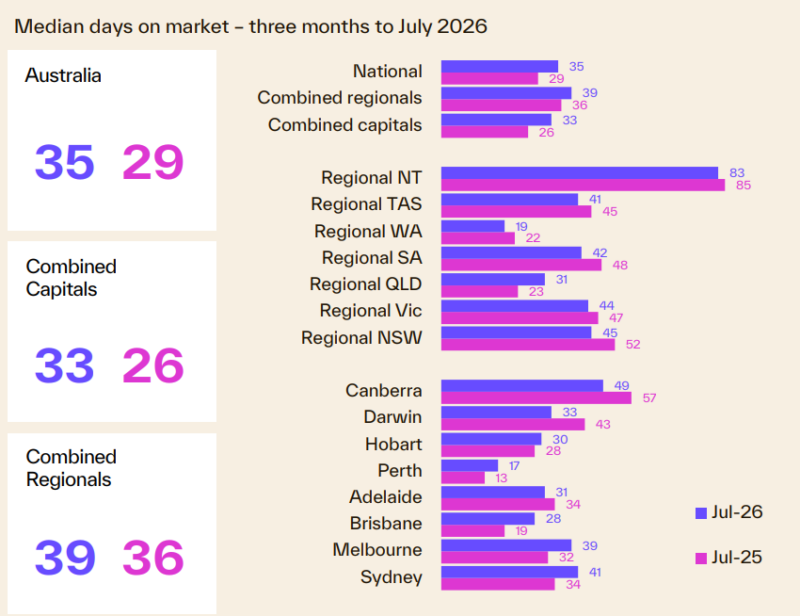
Nationally, the median time on market rose to 35 days, up from 32 days in the previous month, as homes continued to take slightly longer to sell.
Selling conditions have softened across both capital-city and regional markets since late 2025, although the increase has been more pronounced across the capitals.
The median selling time increased to 33 days across the capitals, from 26 days, and to 39 days across regional areas, from 36 days.
Regional Northern Territory remains the clear outlier, with homes taking a median of 83 days to sell.