


Key takeaways
Australia’s housing market looks to be on the verge of a downturn as higher interest rates and stretched affordability weigh on demand.
Sydney and Melbourne are already five months into the early phases of decline, while growth is slowing across the mid-sized capitals.
Historically, housing downturns have been relatively short-lived, with all but three capital city downturns over the past 40 years lasting less than 12 months.
Given the significant growth in home values over the past five years along with strong prudential settings, most home owners are in a strong position to navigate softer housing conditions amid higher mortgage repayments.
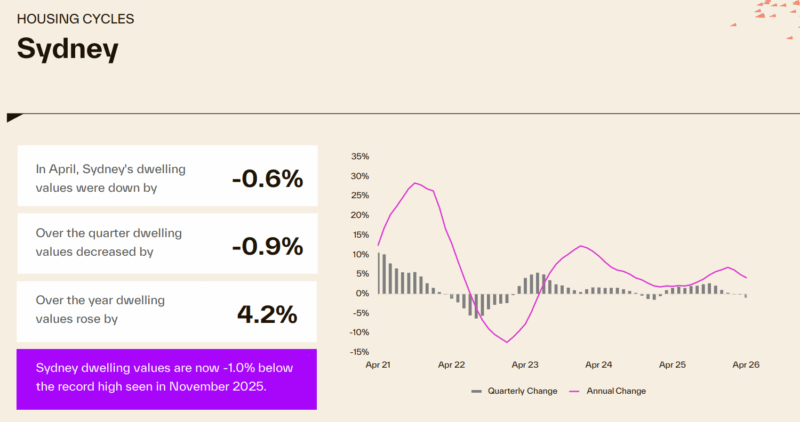
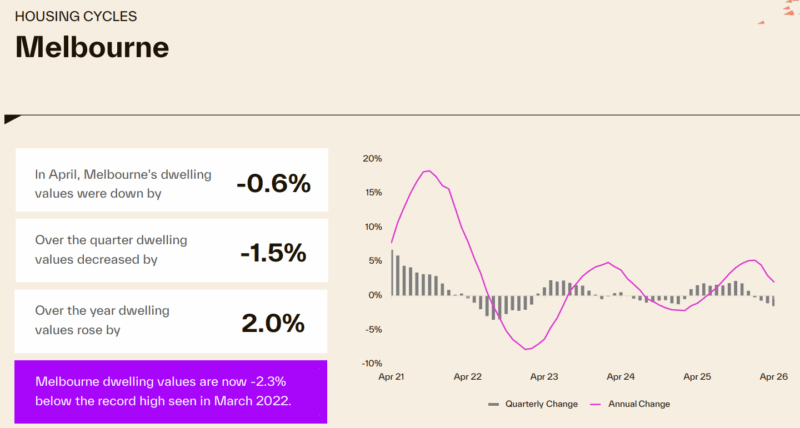
Sydney dwelling values fell 0.6% in April and are now 1.0% below their November 2025 peak, while Melbourne values declined 0.6% over the month and sit 2.3% below their March 2022 high.
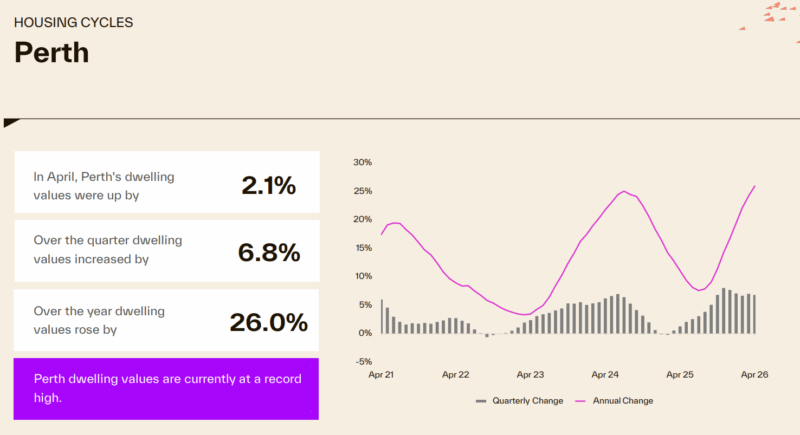
Perth values rose 26.0% over the past year compared to just 2.0% in Melbourne, with the gap in annual growth rates across the capital cities widening to 24 percentage points.
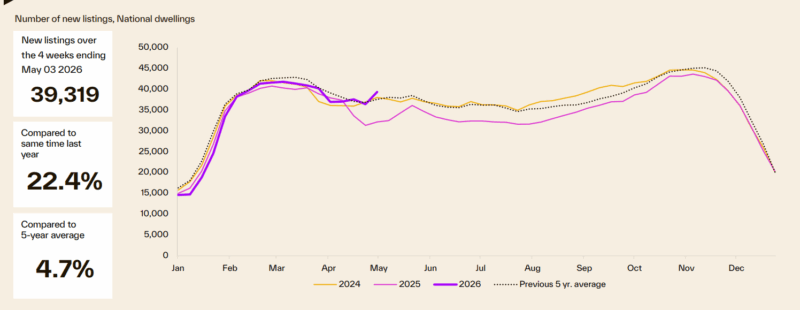
New listings have increased, with 39,319 properties added over the four weeks to early May, 4.7% above the five-year average.
Total listings remain below average levels, at 127,821 properties nationally, down 2.6% from a year ago and 9.6% below the five-year average.
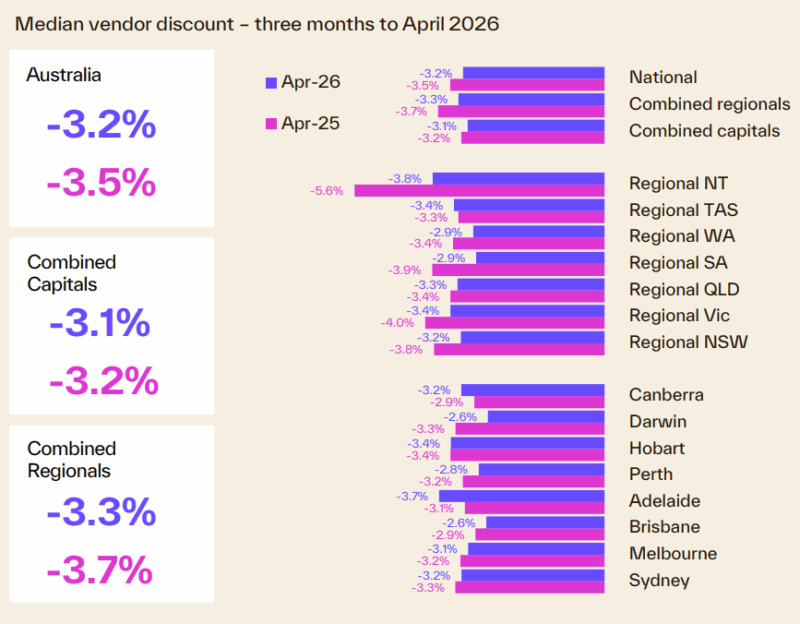
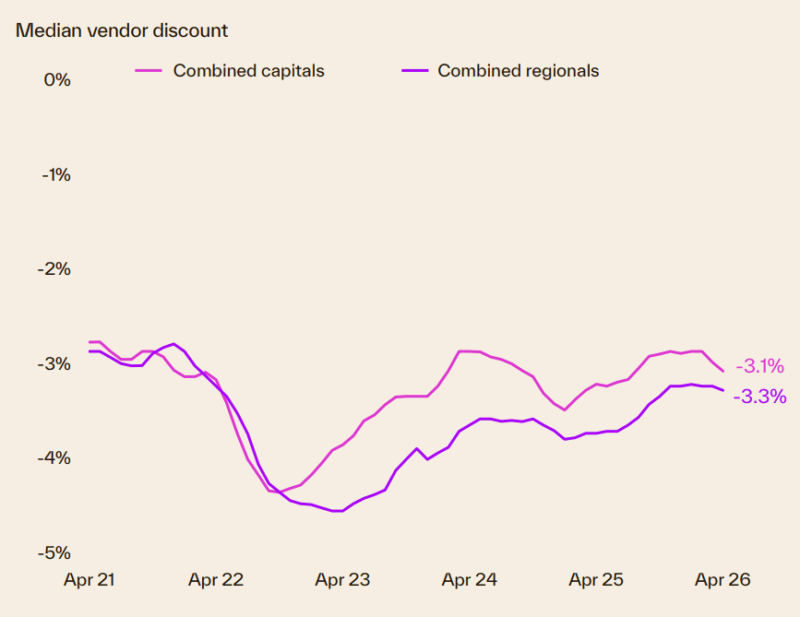
Vendor discounting has started to rise, with the median discount across the combined capital cities increasing to 3.1%, reflecting improved negotiating conditions for buyers.
There is no doubt that our housing markets are facing challenges from all directions, but clearly, they have remained resilient.
To better understand what's happening, this monthly collection of charts from Cotality (formerly CoreLogic) paints an interesting picture.
Cotality’s latest Housing Chart Pack shows conditions are easing as borrowing capacity tightens, with analysis of the Home Value Index indicating Australia’s combined capital city markets have recorded 10 downturns lasting at least three months over the past 40 years.
Cotality Research Director Tim Lawless said historically there’s been several catalysts for housing declines, including global shocks, rising interest rates, periods of credit tightening as well as changes in fiscal policy and broader market factors such as affordability and sentiment.
He further said:
“Sydney and Melbourne are already five months into the early phases of decline, while growth is slowing across the mid-sized capitals.
Listings are picking up as demand softens, interest rates are rising while affordability and serviceability pressures are biting,”
With capital city home values only 0.2% higher in April, and fading, Mr Lawless said there is a good chance Cotality’s combined capitals index will move into decline over the coming months as further momentum leaves the market.
He explains:
“This trend has been amplified by seventy-five basis points of rate hikes so far this year and the chance of another hike, or hikes, later in the year,” he said.
“Importantly, the market was already slowing well before the hiking cycle commenced, highlighting the downside impact of waning confidence from late last year alongside rising inflation and worsening levels of housing affordability."
The largest decline of the past 40 years was between 2017 and 2019 when capital city values fell 8.2% from peak to trough over 19 months, after a period of strong growth and the introduction of tighter lending conditions following the Royal Commission into the banking and finance industry.
More recently, values fell 8.1% over nine months in 2022–23 as interest rates rose sharply from pandemic lows.
Mr Lawless said the current phase follows a period of substantial gains leaving most homeowners in a relatively strong equity position despite softer conditions, with the Reserve Bank estimating less than 1% of households were in negative equity at the start of the year.
The combined capitals Home Value Index has risen 33.7% over the past five years, with markets such as Perth, Brisbane and Adelaide recording growth of around 80% to 90% over the same period.
“Historically, housing downturns have been relatively short-lived, with all but three capital city downturns over the past 40 years lasting less than 12 months, although the length and magnitude have varied from city to city,” he said.
“For example, post mining boom, the Perth market navigated a 61-month downturn where values fell 15.3% from peak to trough. Darwin saw an even longer downturn with values falling over 69 months from mid-2014.”
Residential real estate underpins Australia's wealth
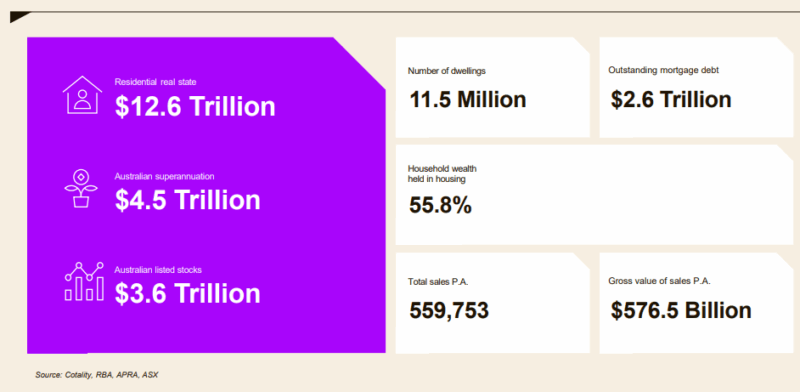
- The total value of Australian residential real estate was $12.6 trillion at the end of April 2026.
- Outstanding mortgages against all residential housing are only $2.6 trillion - a very comfortable 20% Loan to Value ratio.
- 55.8% of total Aussie household wealth is held in residential property - one of the many reasons neither the banks, the government nor the RBA wants a property crash.
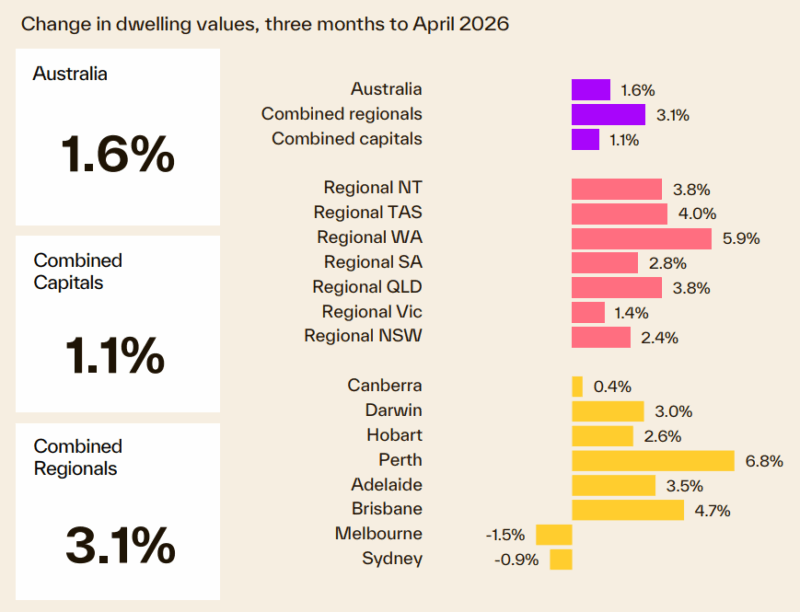
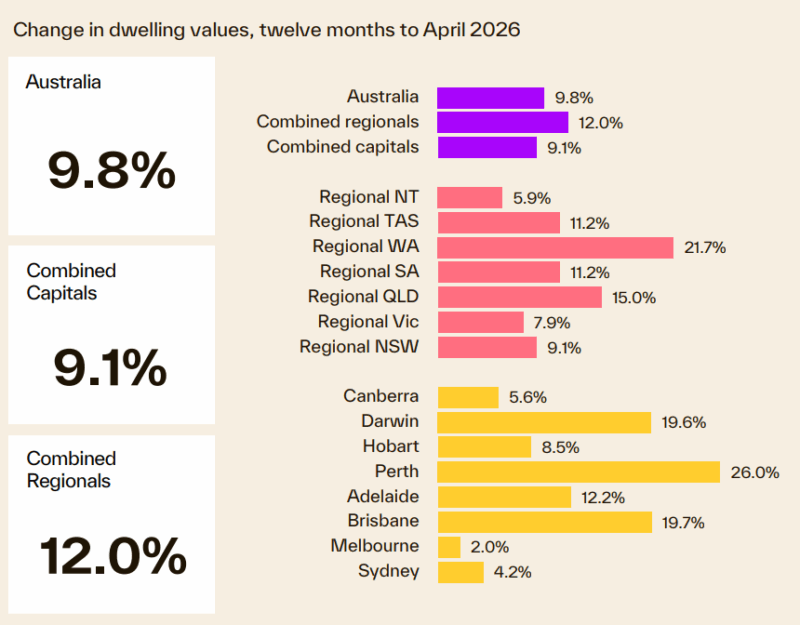
Australian dwelling values
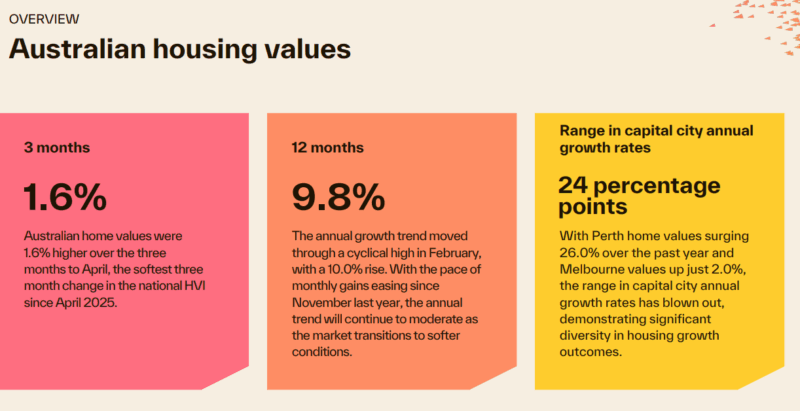
- Australian home values were 1.6% higher over the three months to April, the softest three month change in the national HVI since April 2025.
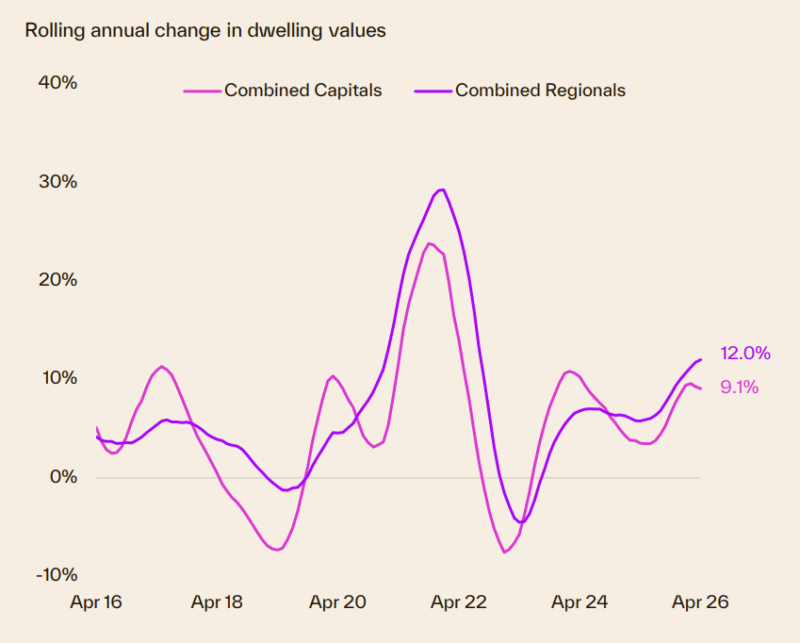
- The annual growth trend moved through a cyclical high in February, with a 10.0% rise.
- With the pace of monthly gains easing since November last year, the annual trend will continue to moderate as the market transitions to softer conditions.
- With Perth home values surging 26.0% over the past year and Melbourne values up just 2.0%, the range in capital city annual growth rates has blown out, demonstrating significant diversity in housing growth outcomes.
- However, as a property investor, you can always outperform the average.
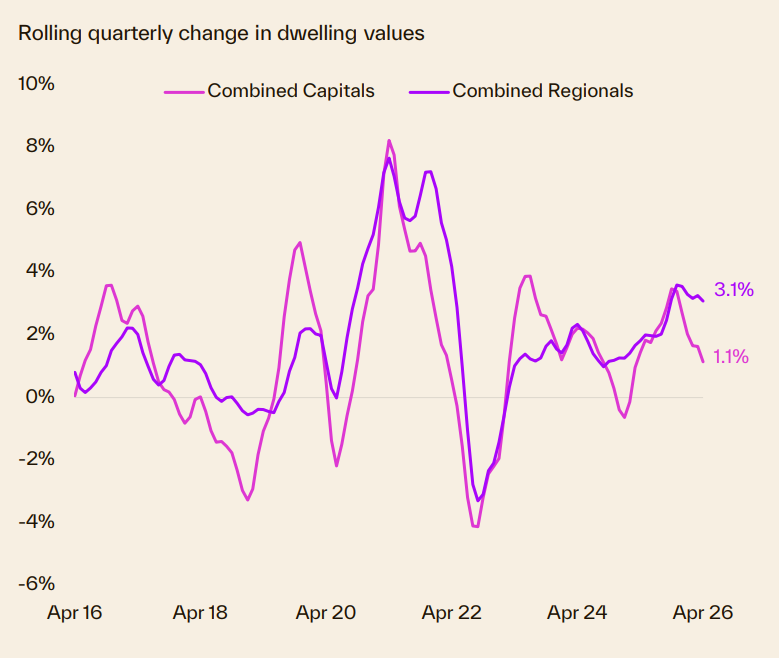
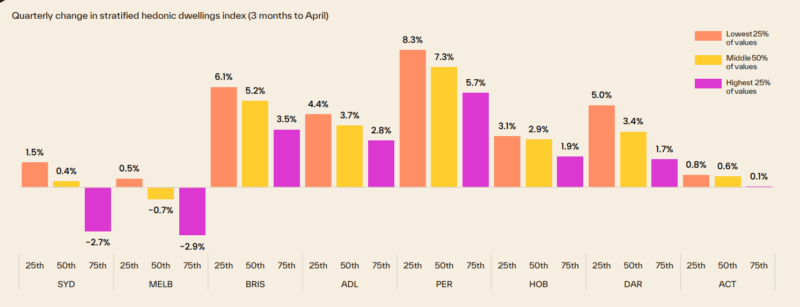
Our capital city markets are fragmented
Our housing markets are fragmented, with each state performing differently depending on local economic and market factors.
The following chart shows how different price segments in each capital city market are performing.
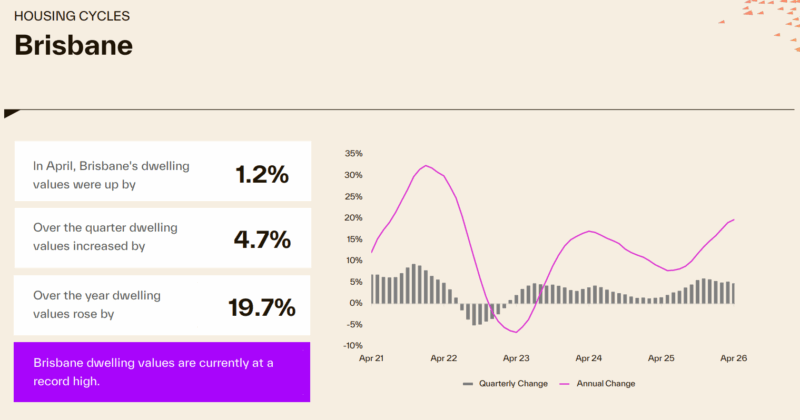
Each State is running its own race
One star performer was Brisbane, where property values increased 19.7% over the last year and are currently at a record high.
- Perth property values are up 26% over the year and are currently at a new record high.
- Sydney property values increased 4.2% over the past year but are still -1% below their record high in November 2025.
- Melbourne property values decreased -0.6% for April, rose 2% over the year, but are still -2.3% below the record high seen in March 2022.
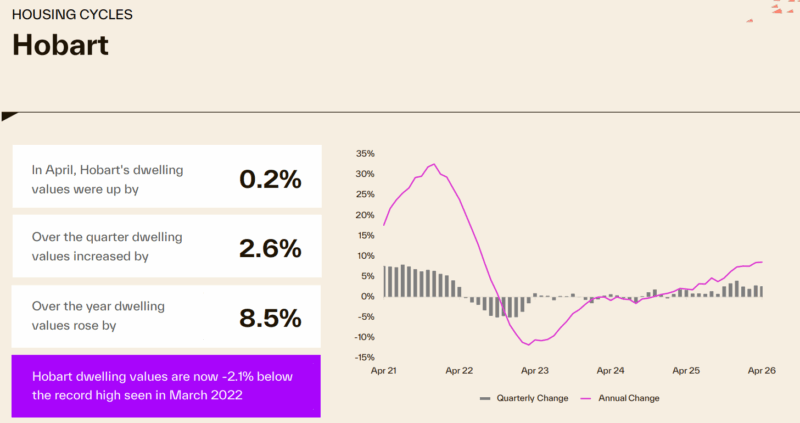
- In the previous darling of the housing markets, Hobart, house prices are -2.1 % below their record highs recorded in March 2022.
Here's how the Adelaide property market performed.

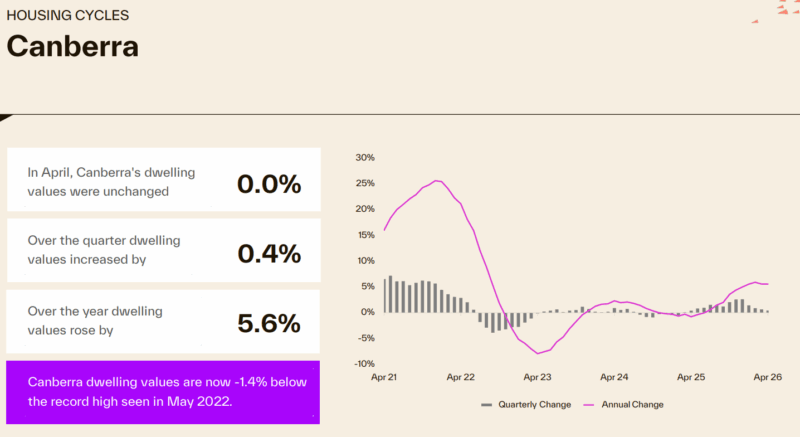
- Dwelling values in Canberra increased 5.6% over the last year.
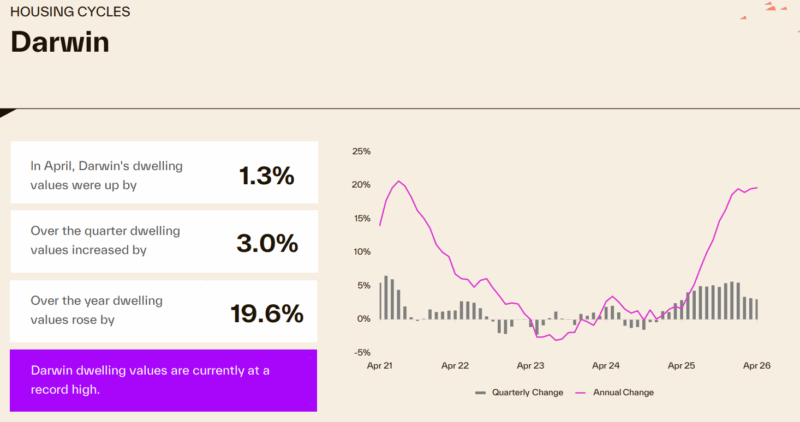
- The Darwin housing market has performed strongly, increasing 19.6% over the year and is currently at a new record high.
Here's how many properties are for sale at the moment
- After tracking at below average levels through most of the year-to-date, the flow of new listings has picked up over the four weeks ending early May.
- The rise in freshly advertised stock is likely to be at least partially seasonal, with a flurry of long weekends and public holidays influencing the trend.
- The problem is that very few are A Grade homes or investment grade properties. Owners of quality properties are holding onto them.
- Total advertised stock levels are seeing some upwards pressure as the flow of new listings rises and the rate of absorption slows due to less buyer demand.
- The rise in total listings is from a low base, with overall stock levels remaining almost 10% below the five-year average in early May.
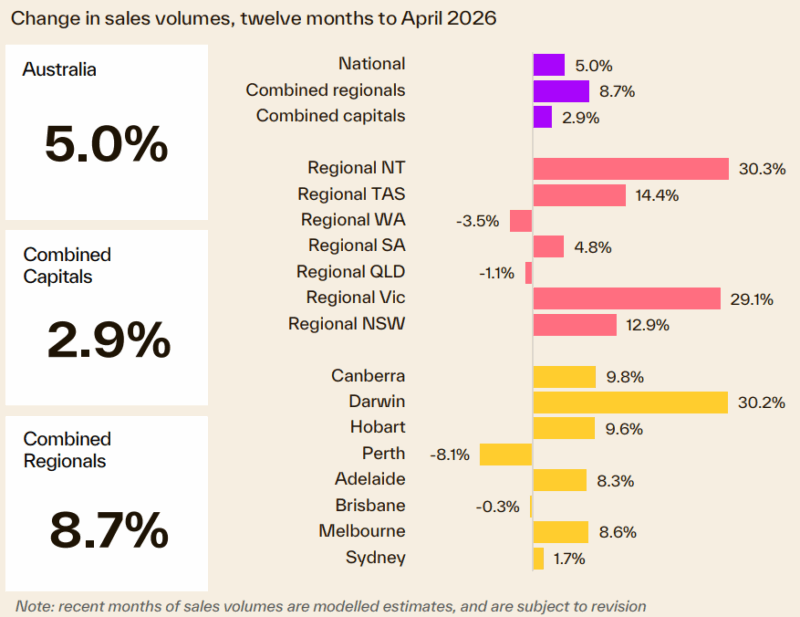
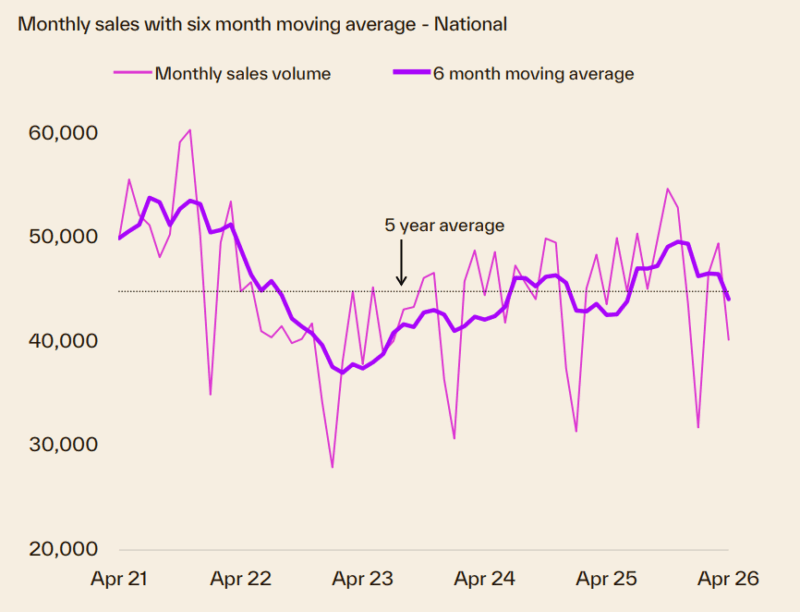
Transaction volumes
- The annual trend in home sales has been supported by rising demand side fundamentals through 2025.
- More recently, the quarterly trend is showing some weakness, with estimates over the three months to April tracking 0.7% lower than a year ago nationally and 3.9% lower than the previous five-year average.
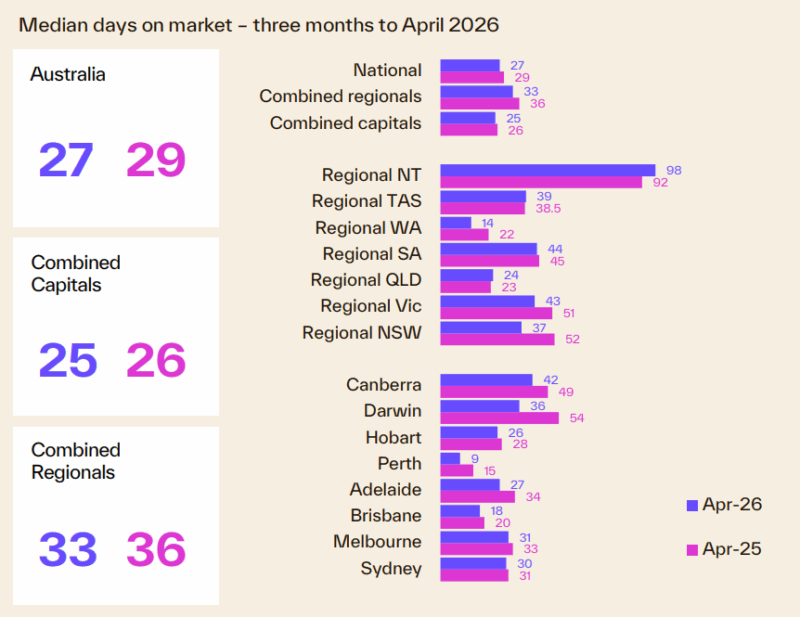
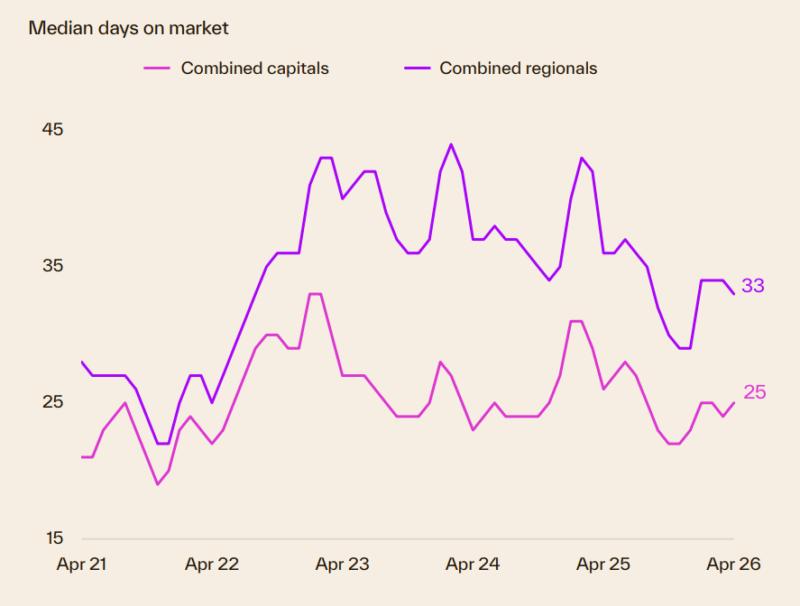
Compared to a year ago, homes are selling faster.
- Homes are selling faster, with a median of 27 days on market over the three months ending April 2026, down from 29 days over the same period in 2025.
- However, the median selling time has risen through early 2026, reflecting a slowdown in housing demand amid mounting headwinds.
Vendor Discounting
- Discounting rates have started to build as buyers benefit from a rise in listings and better ability to negotiate on asking prices.
- The median discounting rate across the combined capitals has increased from 2.9% to 3.1% over recent months.
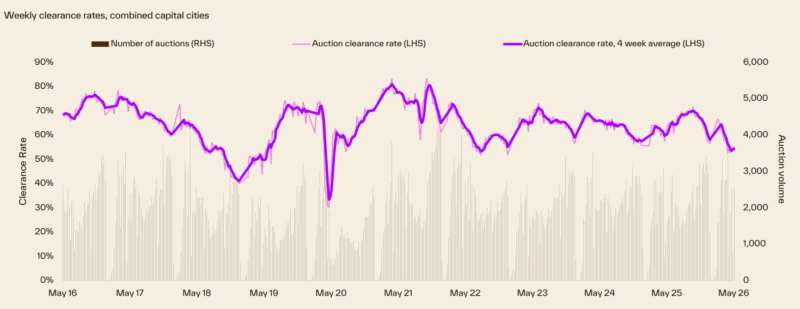
Auction clearance rates
- Auction clearance rates moved through a cyclical peak in late September 2025 at 72%, trending lower since that time to be below the decade average of 64% by mid-November last year.
- Despite a temporary rebound through early 2026, auction clearance rates are once again falling, holding below the 60% mark since the second week of mid-March.
- We update the weekly auction clearance results here each week.
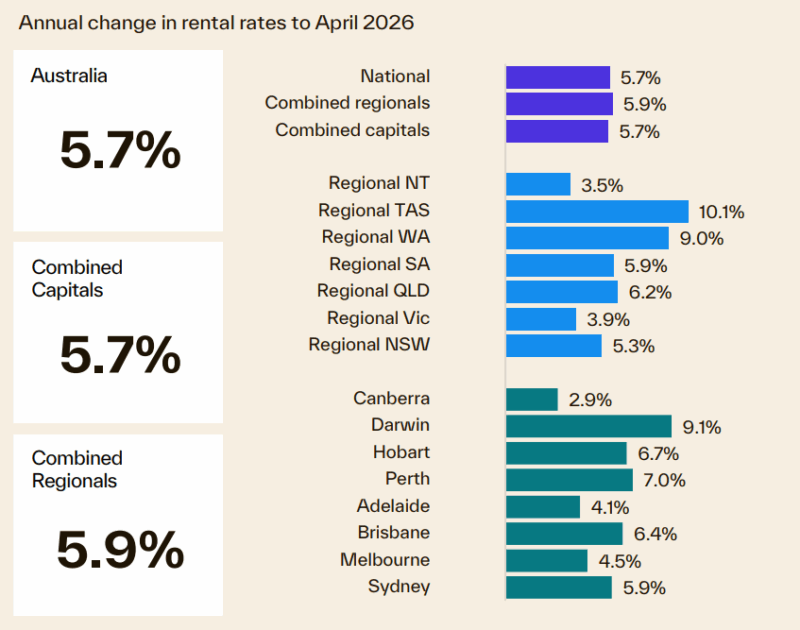
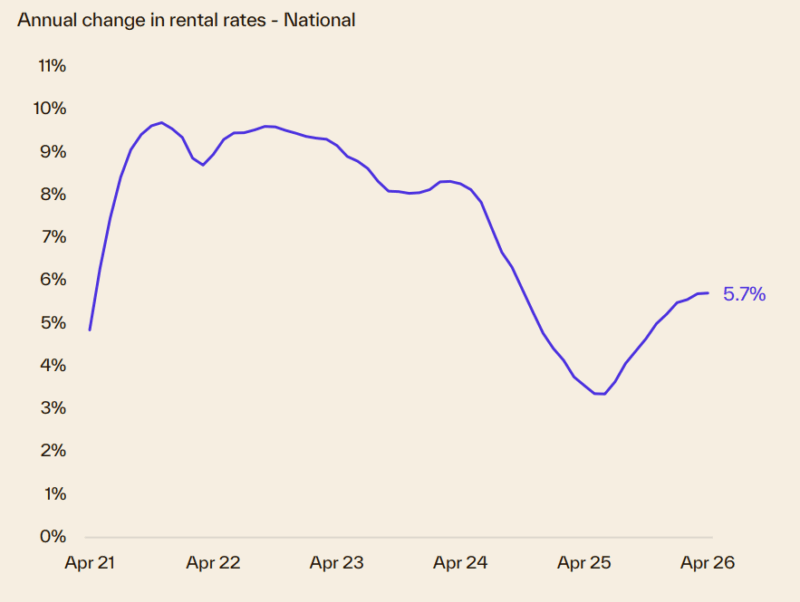
We're still experiencing a rental market crisis in Australia.
- Rental markets remain extremely tight, recording a vacancy rate of 1.7% in April, up from 1.5% in February but well below the decade average of 2.5%.
- Annual rental growth has reaccelerated since July last year, rising from 3.4% growth over the 12 months to June 2025 to 5.7% in April.
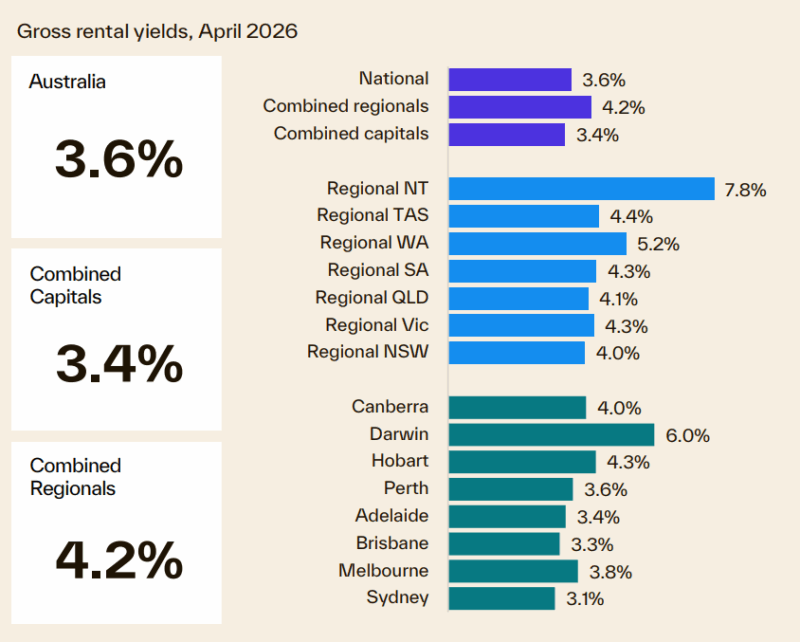
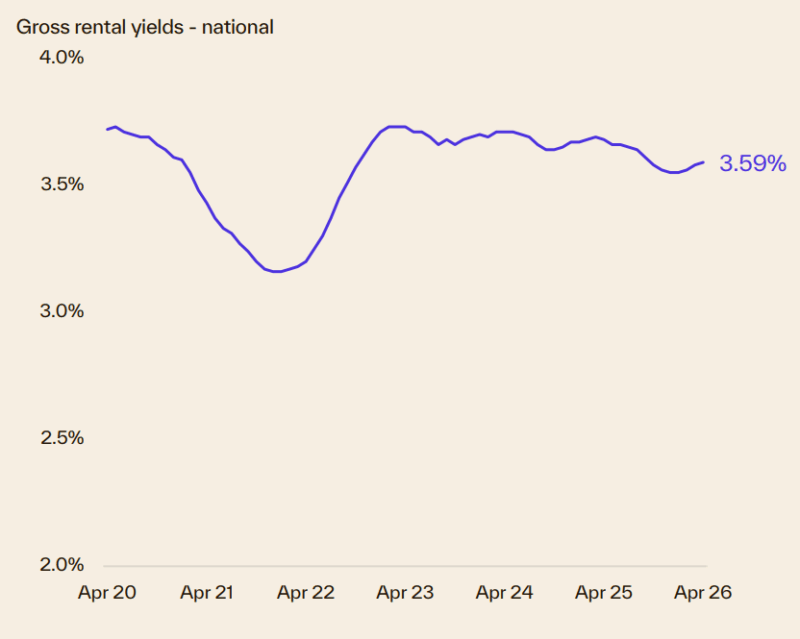
- With rental growth reaccelerating while the pace of growth in home values ease, there has been some subtle upwards pressure on gross rental yields.
- Nationally, the gross rental yield rose to 3.59% in April, up from a recent cyclical low of 3.55% in December/January.
- Darwin continues to stand out with the highest capital city gross yields, at 6.0%, while Sydney is recording the lowest gross yield at 3.1%.
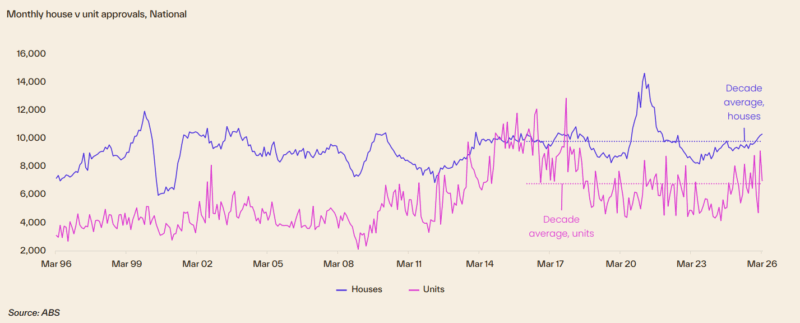
Dwelling approvals and housing credit
- The number of dwellings approved dipped 10.5% in March, attributable to the more volatile unit sector.
- House approvals are showing a more consistent upswing, rising another 0.9% in March to be 11.4% higher compared with a year ago and 5.3% above the decade average.
- The unit sector has also seen a lift in approvals, although the trend is harder to pick due to volatility.
- The rolling six-month trend shows a 1.9% lift in unit approvals relative to a year ago.
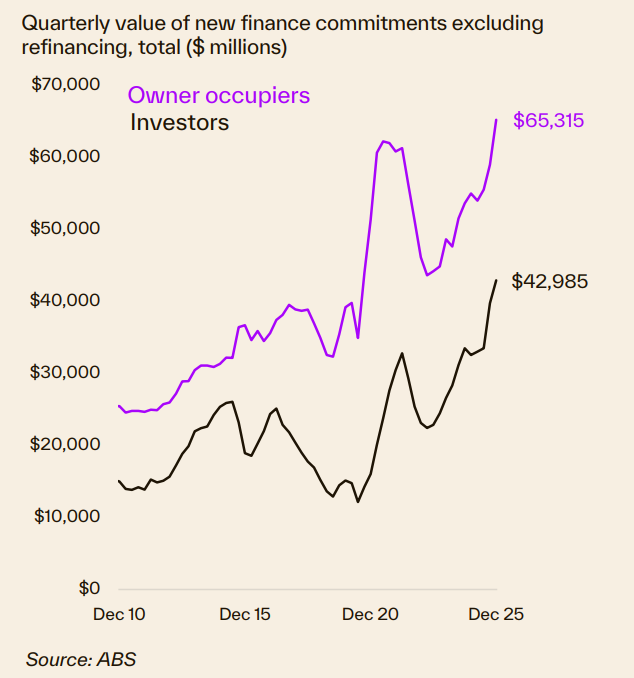
Finance and Lending
- The volume of home lending was 5.1% higher in the December quarter of 2025, easing from a 5.7% rise in Q3.
- Similarly, growth in the value of home lending eased from 10.9% in Q3 last year to 9.5%.
- Investors continue to drive lending indicators, with the volume of home lending for investment purposes up 5.5% over the quarter and 23.6% higher over the year, while owner occupier lending was 4.8% higher over the quarter and up 7.4% compared with a year ago.
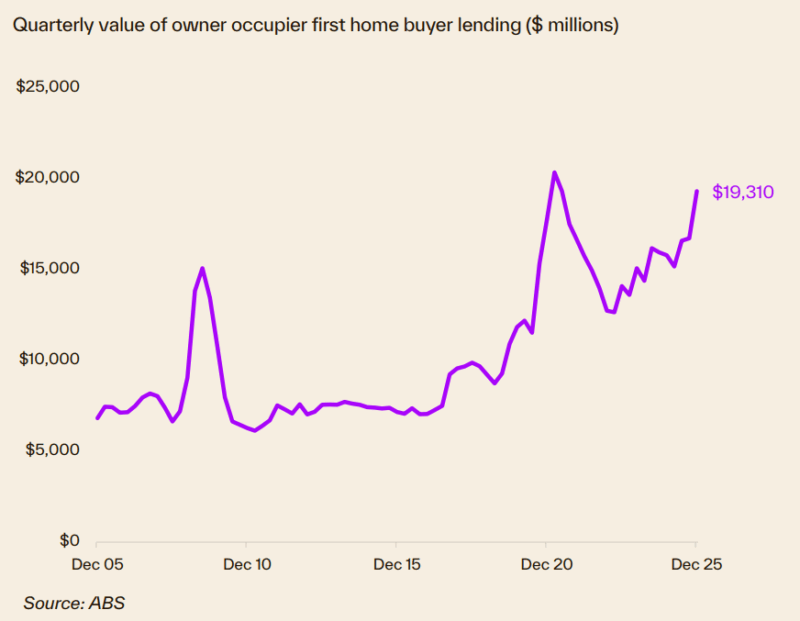
- First home buyer lending was up sharply in Q4, increasing 6.8% by volume and 15.5% by value, coinciding with the expansion of the 5% deposit guarantee.
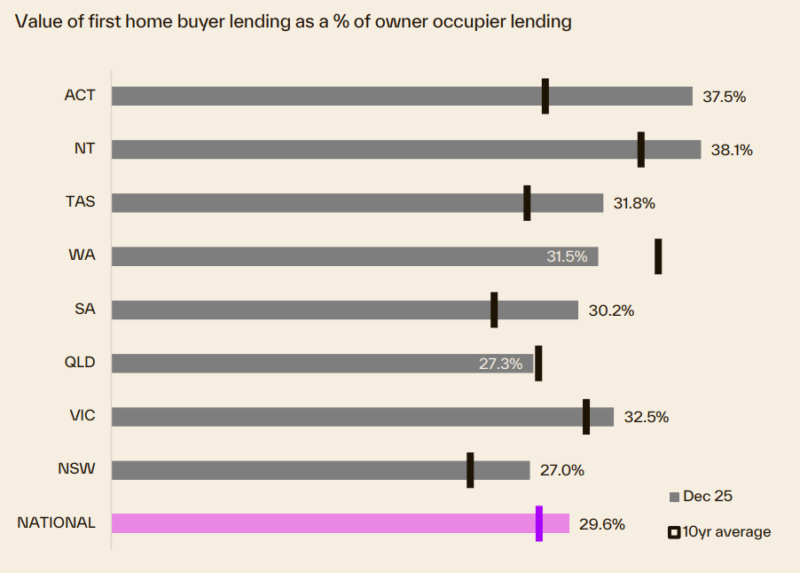
- First home buyers as a share of the value of home lending rose to 29.6% over the quarter, slightly above the decade average of 27.4%.
- First home buyers held the largest share of owner occupier demand in the Northern Territory (also the most affordable housing market), comprising 38.1% of lending.
- First home buyers in NSW (27.0%) and Qld (27.3%) recorded the smallest share of owner occupier lending
Source of charts: Cotality Monthly Housing Chart Pack, May 2026
- Also read:This week’s Australian Property Market Update – Latest Data, State by State May 5th 2026

- Also read:Melbourne property market forecast for 2026 & 2027 | Why the opportunity is bigger than it looks

- Also read:Sydney property market forecast for 2026 and 2027 | Why the short-term softness is a long-term opportunity

- Also read:Latest Property Price Forecasts Revealed. Australian Property Market Outlook 2026: Where To Now After The Rate Rise.

- Also read:Brisbane Property Market Forecast [2026 & Beyond] – What The Olympics Decade Means for Investors.


