


Key takeaways
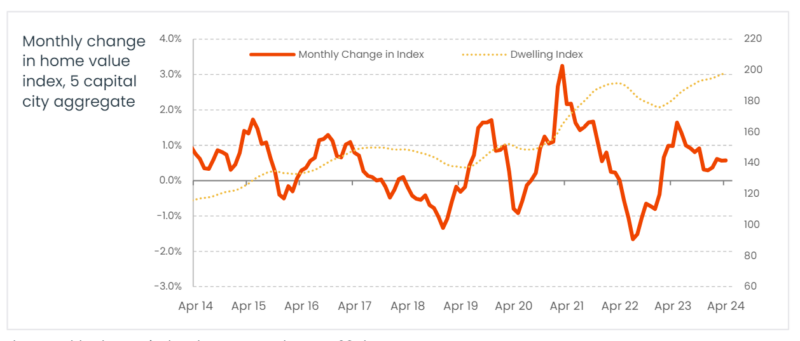
Australian home values continued to trend higher in April with CoreLogic’s national Home Value Index (HVI) rising 0.6%.
This was on par with the pace of gains recorded in both February and March, with the month-on-month rise adding approximately $4,720 to the national median dwelling value.
April’s increase takes the current growth cycle into its 15th month, with housing values up 11.1% or approximately $78,000 since the trough in January last year.
Last weekend's auction results confirmed the strength and the depth of our property markets - the preliminary auction clearance rate reported by Corelogic stepped a little higher last week, rising to 73.5% across the combined capitals, up from a preliminary rate of 72.9% the week prior which revised lower to 66.1% once finalised.
Sydney continued to standout with a strong preliminary clearance rate at 78.1%, although this was slightly lower than the previous week at 78.3% (71.0% on final numbers).
Melbourne’searly clearance rate rose above the 70% mark to 71.0%, slightly higher than the previous week’s 69.8% (62.5% on finalised numbers).
The result was on the back of a large volume, with 1,026 auctions held, the first 1,000+ week of auctions since the week prior to Easter.
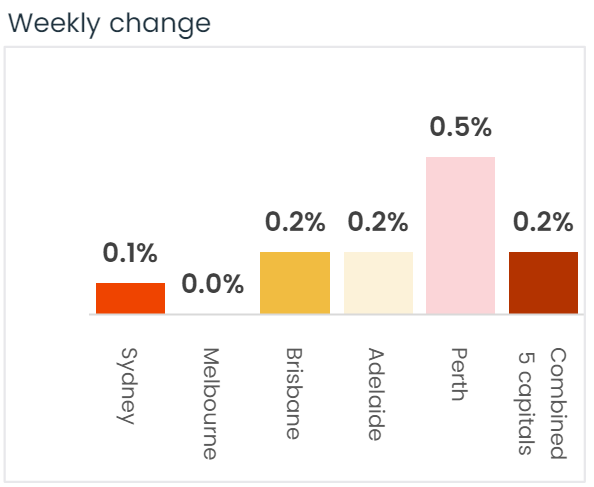
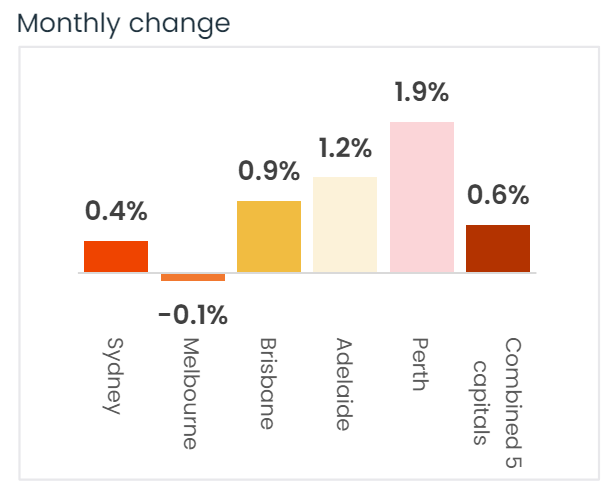
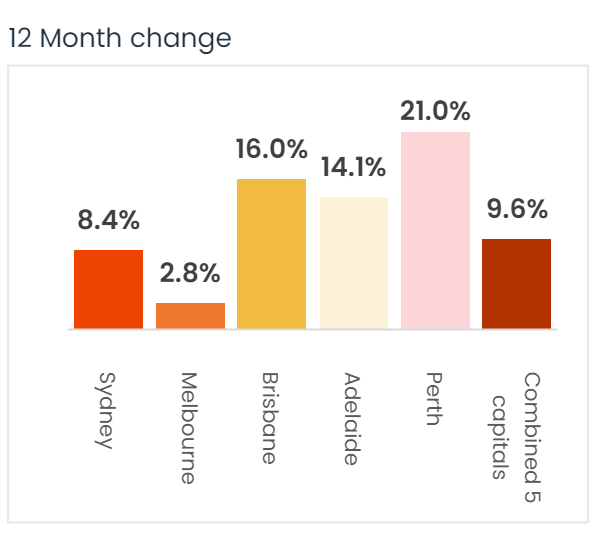
Sydney property prices increased 0.1% over the last week, increased 0.4% over the last month and are 8.4% higher than they were 12 months ago.
Melbourne property prices remained flat over the last week, dropped -0.1% over the last month, and are 2.8% higher than they were 12 months ago.
Brisbane property prices increased by 0.2% over the last week, increased 0.9% over the last month and are 16.0% higher than they were 12 months ago.
Overall, Australian capital dwelling prices increased by 0.6% over the last month and are now 9.6% higher than they were 12 months ago.
Our combined capital cities have increased in value by 10.2% over the last year. That's very different to the pessimistic forecasts of double digit price falls made by the RBA and many of the bank economists only 12 months ago
And it's likely property prices and rents are going to keep increasing throughout 2024.
This current property cycle has been driven by an undersupply of good properties relative to current demand pushing up property values and rents.
Unfortunately, the undersupply properties is going to persist for some time with all commentators that there is no way we're going to hit the housing targets required to meet out demand.
Despite the challenges of cost-of-living pressures and high interest rates, property prices just keep rising.
All major property research houses confirmed rising values through the month of April and this trend is driven by a number of factors, including a chronic shortage of new homes at a time of strong population growth, high building costs, and a tight rental market, all of which boost housing demand.
The shortage of new housing is likely to persist, as new dwelling approvals have dropped to a nearly 12-year low after trending downward over the past two years.
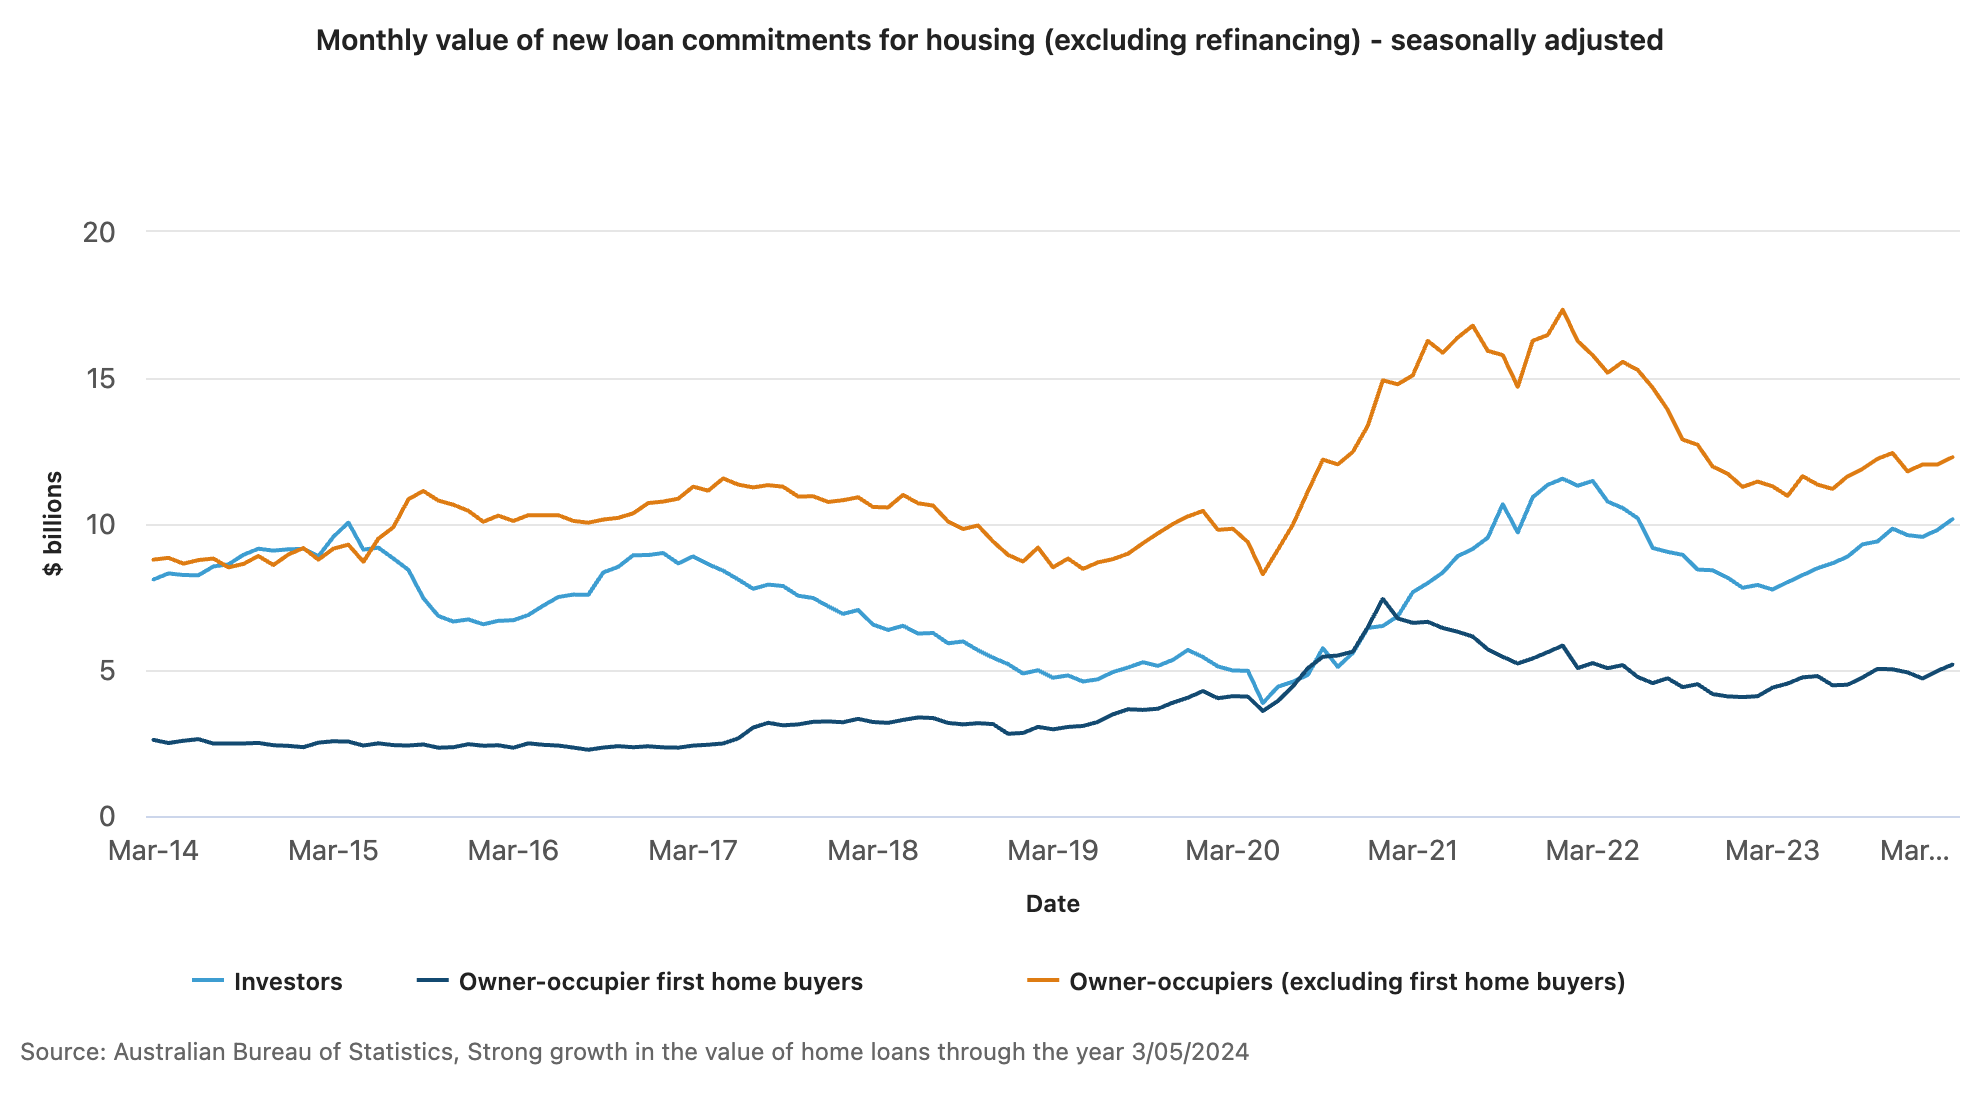
But Aussies are still keen to get into the market with the value of new housing loans rose 17.9 per cent since March 2023 to $27.6 billion, after a 3.1 per cent rise in the month of March, according to the latest data released by the Australian Bureau of Statistics (ABS).
Mish Tan, ABS head of finance statistics, said: “The value of new loan commitments is a product of the size of loans being approved and the volume of loans. The rise in the value of new home loans over the past year reflected increases in the average loan size, in line with rising house prices over the same period.
“Meanwhile, in original terms, the number of loans reaching the final commitment stage is broadly similar to a year ago.”
Comparing different buyers in the market, the value of investor loans rose 3.8 per cent in March to $10.2 billion, increasing 31.1 percent since March 2023.
Owner-occupier loans (excluding first home buyers) rose 2.1 per cent to $12.3 billion, increasing 8.8 per cent through the year. First home buyer loans rose 4.4 per cent to $5.2 billion, rising 17.9 per cent through the year.
The depth of demand for housing keeps showing itself every weekend as auction clearance rates keep holding up.
Remember... Auction clearance rates are a great "in time" indicator of both buyer and seller sentiment.
The preliminary auction clearance rate stepped a little higher last week, rising to 73.5% across the combined capitals, up from a preliminary rate of 72.9% the week prior which was revised lower to 66.1% once finalised.
With 2,169 auctions held last week, the volume of properties taken to market is holding well above levels a year ago (+25.8% or 445 higher relative to the same time last year).
See Corelogic's full auction report below.
Unfortunately, the undersupply properties is going to persist for some time with all commentators agreeing that there is no way we're going to hit the housing targets required to meet out demand.
In fact, we're going to miss them by a wide margin.
This week, CoreLogic reports that:
- Sydney property prices increased 0.1% over the last week, increased 0.4% over the last month and are 8.4% higher than they were 12 months ago.
- Melbourne property prices remained flat over the last week, dropped -0.1% over the last month, and are 2.8% higher than they were 12 months ago.
- Brisbane property prices increased by 0.2% over the last week, increased 0.9% over the last month and are 16.0% higher than they were 12 months ago.
Overall, Australian capital dwelling prices increased by 0.6% over the last month and are now 9.6% higher than they were 12 months ago.
Clearly, the property cycle is moving on driven by an undersupply of good properties relative to steady demand from buyers.
Source: CoreLogic May 6th 2024
Of course, these are "overall" figures - there is not one Sydney or Melbourne or Brisbane property market.
And various segments of each market are performing differently.
The more expensive parts of our capital cities are likely to outperform this year as the local residence will, in general, have more equity in the properties they are selling, and they won't be as sensitive to high interest rates and the high cost of living as the outer and new suburbs.
To help keep you up-to-date with all that's happening in property, here is my updated weekly analysis of data and charts as of 6th May 2024 provided by CoreLogic, and realestate.com.au.
Property asking prices
Property asking prices are a useful leading indicator for housing markets - giving a good indication of what's ahead.
Here is the latest data available for May 2024.
Sydney
| Property type | Price ($) | Weekly Change | Monthly Change % | Annual % change |
|---|---|---|---|---|
| All Houses | 1,894.694 | 6.026 | -0.7% | 7.2% |
| All Units | 807.226 | 7.674 | 1.6% | 5.9% |
| Combined | 1,456.734 | 6.690 | -0.2% | 6.5% |
Source: SQM Research
Melbourne
| Property type | Price ($) | Weekly Change | Monthly Change % | Annual % change |
|---|---|---|---|---|
| All Houses | 1,256.244 | -4.344 | -0.5% | 7.0% |
| All Units | 605.522 | 0.578 | -0.1% | 2.6% |
| Combined | 1,053.154 | -2.808 | -0.4% | 6.0% |
Source: SQM Research
Brisbane
| Property type | Price ($) | Weekly Change | Monthly Change % | Annual % change |
|---|---|---|---|---|
| All Houses | 1,094.860 | 10.259 | 1.8% | 15.2% |
| All Units | 606.249 | 3.951 | 1.8% | 19.5% |
| Combined | 973.255 | 8.689 | 1.8% | 15.7% |
Source: SQM Research
Perth
| Property type | Price ($) | Weekly Change | Monthly Change % | Annual % change |
|---|---|---|---|---|
| All Houses | 980.718 | -2.771 | 1.3% | 17.2% |
| All Units | 506.757 | -0.777 | -0.2% | 16.5% |
| Combined | 857.565 | -2.253 | 1.1% | 16.9% |
Source: SQM Research
Adelaide
| Property type | Price ($) | Weekly Change | Monthly Change % | Annual % change |
|---|---|---|---|---|
| All Houses | 895.331 | -2.295 | 1.8% | 15.6% |
| All Units | 462.728 | 1.872 | 4.8% | 14.8% |
| Combined | 817.745 | -1.548 | 2.1% | 15.5% |
Source: SQM Research
Canberra
| Property type | Price ($) | Weekly Change | Monthly Change % | Annual % change |
|---|---|---|---|---|
| All Houses | 1,176.210 | 4.915 | 0.2% | 12.4% |
| All Units | 594.121 | -1.871 | -0.1% | 1.4% |
| Combined | 965.207 | 2.455 | 0.1% | 9.5% |
Source: SQM Research
Darwin
| Property type | Price ($) | Weekly Change | Monthly Change % | Annual % change |
|---|---|---|---|---|
| All Houses | 657.837 | -8.837 | -2.2% | -2.4% |
| All Units | 368.626 | -1.126 | -0.6% | -3.4% |
| Combined | 544.401 | -5.813 | -1.8% | -2.7% |
Source: SQM Research, May 2024
Source: SQM Research
Hobart
| Property type | Price ($) | Weekly Change | Monthly Change % | Annual % change |
|---|---|---|---|---|
| All Houses | 791.273 | -0.455 | -1.0% | -0.5% |
| All Units | 526.163 | 8.655 | 4.7% | -2.9% |
| Combined | 751.415 | 0.915 | -0.4% | -0.8% |
Source: SQM Research
National
| Property type | Price ($) | Weekly Change | Monthly Change % | Annual % change |
|---|---|---|---|---|
| All Houses | 918.364 | 6.140 | 0.5% | 11.8% |
| All Units | 538.597 | 0.484 | 0.3% | 5.0% |
| Combined | 837.202 | 4.931 | 0.5% | 10.7% |
Source: SQM Research
Cap City Average
| Property type | Price ($) | Weekly Change | Monthly Change % | Annual % change |
|---|---|---|---|---|
| All Houses | 1,363.641 | 3.921 | -0.2% | 9.2% |
| All Units | 682.292 | 2.436 | 2.1% | 7.1% |
| Combined | 1,163.511 | 3.485 | 0.2% | 8.6% |
Source: SQM Research
The value of property asking prices as a leading indicator for housing markets is quite significant.
In fact it's more valuable than median prices which can be quite misleading.
Let's delve into why this is the case and how it impacts the real estate market.
- Early Market Sentiment Indicator: Asking prices often reflect the current sentiment of sellers in the real estate market.
If sellers are confident, they might set higher asking prices, anticipating strong demand.
Conversely, if sellers are uncertain or perceive a market downturn, they might lower their asking prices to attract buyers.
This makes asking prices a real-time indicator of market sentiment, often preceding changes in actual sales prices. - Predictive of Future Price Trends: Trends in asking prices can be predictive of where the actual property prices are headed.
For example, a consistent rise in asking prices over a period can signal an upcoming rise in transaction prices. - Impact of Economic Factors: Economic factors such as interest rates, employment rates, and broader economic health influence asking prices.
For instance, changes in the Reserve Bank of Australia's policies or shifts in the job market can quickly reflect in the asking prices, providing insights into how these factors are influencing the housing market. - Regional Variations: In a diverse market like Australia's, asking prices can also provide insights into regional disparities.
For instance, the property markets in Melbourne and Sydney might behave differently from those in Brisbane or Perth. Asking prices can give early indications of these regional trends. - Influence of Supply and Demand: Asking prices are also a response to the balance of supply and demand in the market.
In areas with limited supply and high demand, asking prices tend to be higher and vice versa.
However, it's important to note that while asking prices are a valuable indicator, they should not be used in isolation.
Other factors like actual sales prices, time on the market, auction clearance rates, and economic conditions also play crucial roles in understanding the property market dynamics.
READ MORE: The latest median property prices in Australia’s major cities
- Also read:This week’s Australian Property Market Update – Latest Data, State by State May 7th 2024

- Also read:Melbourne property market forecast for 2024
- Also read:Sydney property market forecast for 2024
- Also read:Brisbane’s property market forecast for 2024
- Also read:Latest property price forecasts for 2024 revealed. What’s ahead in our housing markets in the next year or two?


Last weekend's auction report
Increase in preliminary auction clearance rate week-on-week
Corelogic report that the preliminary auction clearance rate stepped a little higher last week, rising to 73.5% across the combined capitals, up from a preliminary rate of 72.9% the week prior which was revised lower to 66.1% once finalised.
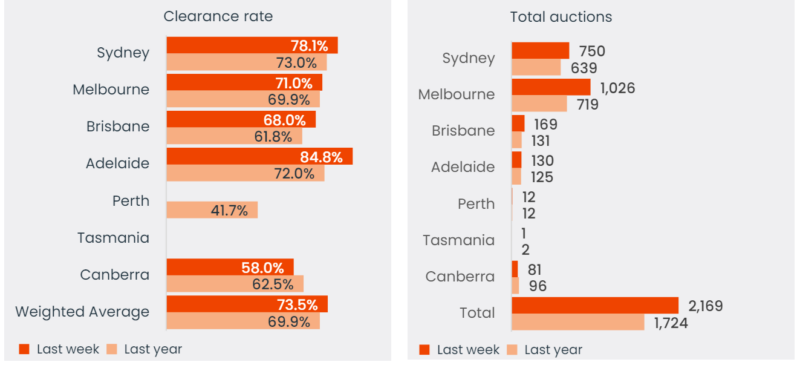
Sydney continued to stand out with a strong preliminary clearance rate, at 78.1%, although this was slightly lower than the previous week at 78.3% (71.0% on finalised numbers).
Melbourne’s early clearance rate rose above the 70% mark to 71.0%, slightly higher than the previous week’s 69.8% result (62.5% on finalised numbers).
The result was on the back of a large volume, with 1,026 auctions held, the first 1,000+ week of auctions since the week prior to Easter.
Across the smaller capitals, Brisbane recorded the largest volume of auctions (169) but the preliminary clearance rate slipped from 71.7% a week earlier to 68.0% (lowest since Easter).
Adelaide continued to record a high early clearance rate at 84.8% across 130 auctions, while auction results across the ACT were soft, returning a preliminary clearance rate of 58.0% (lowest since the last week of Feb).
With 2,169 auctions held last week, the volume of properties taken to market is holding well above levels a year ago (+25.8% or 445 higher relative to the same time last year).
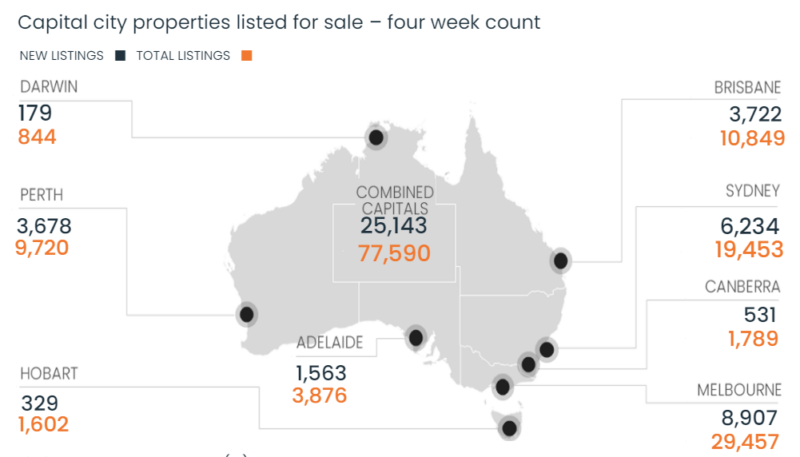
More broadly, the rolling four-week count of new listings added to the market was nearly 23% higher than at the same time a year ago and 12.1% above the previous five-year average
The volume of auctions is set to rise this week. CoreLogic is currently tracking more than 2,200 properties scheduled to go under the hammer.
| City | Clearance Rate | Total Auctions | CoreLogic auction results | Cleared Auctions | Uncleared Auctions |
|---|---|---|---|---|---|
| Sydney | 78.1% | 750 | 543 | 424 | 119 |
| Melbourne | 71.0% | 1,026 | 742 | 527 | 215 |
| Brisbane | 68.0% | 169 | 125 | 85 | 40 |
| Adelaide | 84.8% | 130 | 79 | 67 | 12 |
| Perth | n/a | 12 | 7 | 4 | 3 |
| Tasmania | n/a | 1 | 1 | 0 | 1 |
| Canberra | 58.0% | 81 | 50 | 29 | 21 |
| Weighted Average | 73.5% | 2,169 | 1,547 | 1,136 | 411 |
Source: CoreLogic
Our rental markets
Nationally, rents were up 0.8% in April, a slightly lower rate of growth relative to February and March when the national rental index rose 0.9% and 1.0% respectively.
Across the individual capitals, dwelling rents rose over the past three months in most cities, with Darwin recording the only fall.
Despite an uptick in gross rental yields, investors with a high amount of leverage are likely to be facing a negative cash flow on their property.


Sydney
| Property Type | Rent ($) | Weekly change | Monthly change | 12 Months change |
|---|---|---|---|---|
| All Houses | $1,060.82 | 0.18 | 1.1% | 10.2% |
| All Units | $711.24 | -1.24 | 0.3% | 7.7% |
| Combined | $853.35 | -0.64 | 0.7% | 9.0% |
Source: SQM Research
Melbourne
| Property Type | Rent ($) | Weekly change | Monthly change | 12 Months change |
|---|---|---|---|---|
| All Houses | $743.28 | 0.72 | 0.4% | 11.3% |
| All Units | $559.19 | 0.81 | -0.2% | 8.2% |
| Combined | $635.97 | 0.81 | 0.1% | 9.7% |
Source: SQM Research
Brisbane
| Property Type | Rent ($) | Weekly change | Monthly change | 12 Months change |
|---|---|---|---|---|
| All Houses | $716.65 | 1.35 | -0.1% | 5.9% |
| All Units | $578.61 | 1.39 | 0.7% | 10.0% |
| Combined | $654.53 | 1.37 | 0.2% | 7.5% |
Source: SQM Research
Perth
| Property Type | Rent ($) | Weekly change | Monthly change | 12 Months change |
|---|---|---|---|---|
| All Houses | $788.54 | -0.54 | 0.5% | 16.2% |
| All Units | $602.44 | 1.56 | 2.8% | 15.8% |
| Combined | $710.82 | 0.37 | 1.3% | 16.1% |
Source: SQM Research
Adelaide
| Property Type | Rent $) | Weekly change | Monthly change | 12 Months change |
|---|---|---|---|---|
| All Houses | $634.26 | -0.26 | 0.6% | 10.0% |
| All Units | $477.64 | 2.36 | 2.9% | 16.3% |
| Combined | $580.43 | 0.69 | 1.3% | 11.9% |
Source: SQM Research
Canberra
| Property Type | Rent ($) | Weekly change | Monthly change | 12 Months change |
|---|---|---|---|---|
| All Houses | $759.07 | -9.07 | -0.8% | -1.4% |
| All Units | $567.74 | -1.74 | -0.4% | 1.6% |
| Combined | $655.29 | -5.11 | -0.6% | -0.1% |
Source: SQM Research
Darwin
| Property Type | Rent ($) | Weekly change | Monthly change | 12 Months change |
|---|---|---|---|---|
| All Houses | $692.26 | -2.26 | -2.8% | -5.8% |
| All Units | $544.03 | 5.97 | 8.3% | 7.7% |
| Combined | $604.03 | 2.67 | 2.8% | 1.0% |
Source: SQM Research
Hobart
| Property Type | Rent 9$) | Weekly change | Monthly change | 12 Months change |
|---|---|---|---|---|
| All Houses | $540.61 | -0.61 | -0.2% | 1.0% |
| All Units | $452.08 | -2.08 | -2.6% | -5.3% |
| Combined | $505.04 | -1.19 | -1.1% | -1.4% |
Source: SQM Research
National
| Property Type | Rent ($) | Weekly change | Monthly change | 12 Months change |
|---|---|---|---|---|
| All Houses | $695.00 | 2.00 | 0.4% | 9.4% |
| All Units | $542.00 | 0.00 | 0.4% | 9.3% |
| Combined | $623.93 | 1.09 | 0.4% | 9.4% |
Source: SQM Research
Cap City Average
| Property Type | Rent ($) | Weekly change | Monthly change | 12 Months change |
|---|---|---|---|---|
| All Houses | $838 | -1.00 | 0.6% | 9.7% |
| All Units | $629 | -2.00 | 0.2% | 8.8% |
| Combined | $726.74 | -1.51 | 0.4% | 9.3% |
Source: SQM Research
Sellers of good properties are on strike
Earlier in the year, more sellers put their properties on the market, feeling confident than inflation was under control and interest rates were heading down, however now the expectation of an interest-rate cut has been pushed out to the end of the year or early next year
There is now an acute shortage of A-grade homes and investment-grade properties for sale.
Source: Corelogic May 2024
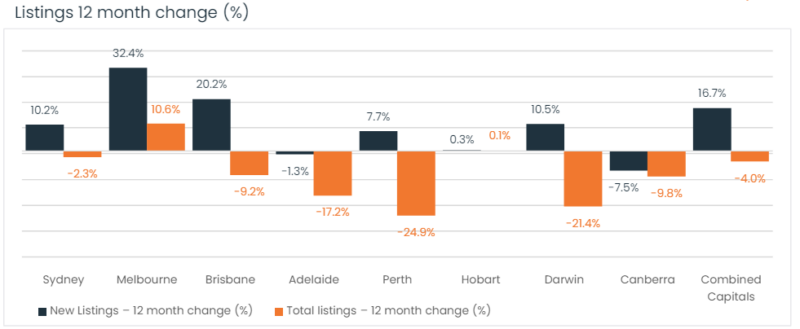
The charts below show the lack of property listings available for serious buyers at present, and with home buyers back in the market well located properties are being snapped up quickly.
But not all properties are selling well- there is currently a flight to quality.
Property listings for sale provide a useful real-time indicator of seller sentiment and general market confidence.
However, this year sellers have erred on the side of caution before listing with the flow of new listings consistently below average since spring last year.
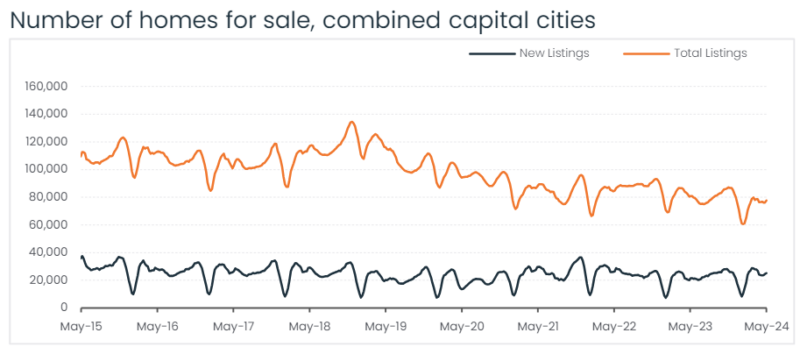
Source: CoreLogic May 2024
Vendor metrics
As the following chart shows, houses are still being snapped up quickly by eager buyers.

At a national level, properties are taking slightly longer to sell than they were during the property boom of 2020 and 2021.
However, the number of days to sell a property is still relatively low (a sign of the tight supply situation for good properties), and vendor discounting is still at very low levels.
In general, houses are selling quicker than apartments, but the shortage of good properties on the market is seeing A-grade properties selling quickly with minimal discounting.


