Key takeaways
National capital city prices are up 12.8% annually, but the market is highly fragmented.
The preliminary auction clearance rate has recorded a modest rise since the Easter long weekend, rising to 58.9% last week, one percentage point higher than the week prior (57.9%, revised down to 52.7% once finalised) and 3.5 percentage points higher than the Easter low (55.5%).
Auction clearance rates are being negatively impacted by a high portion of withdrawn auctions, which count as an unsuccessful outcome in the results.
Global uncertainty and rising oil prices are keeping inflation elevated, pushing back expectations of rate cuts
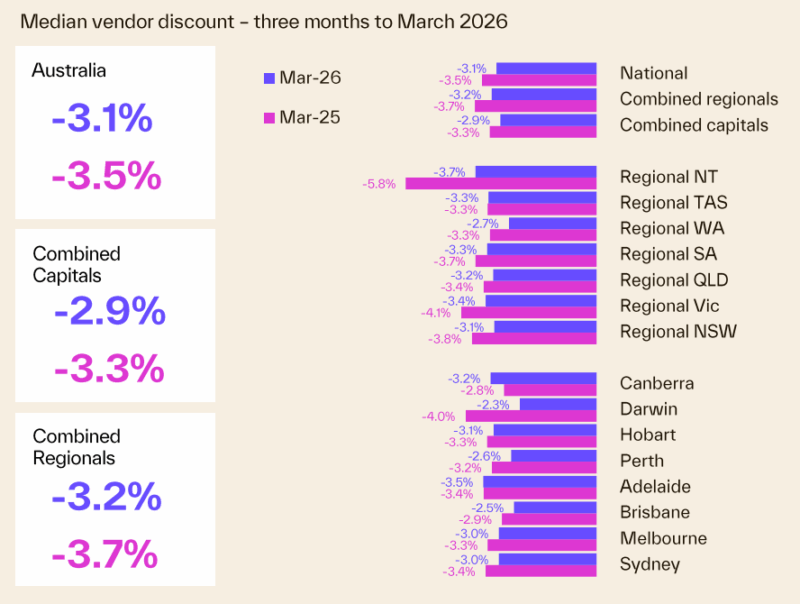
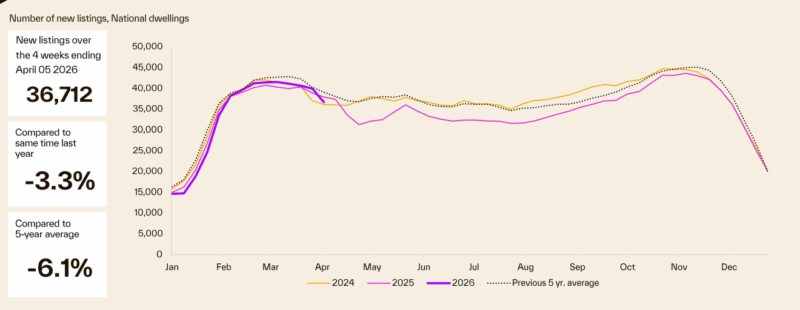
Quality vendors remain on strike - new listings are 3.3% lower than a year ago and 6.1% below the five - year average.
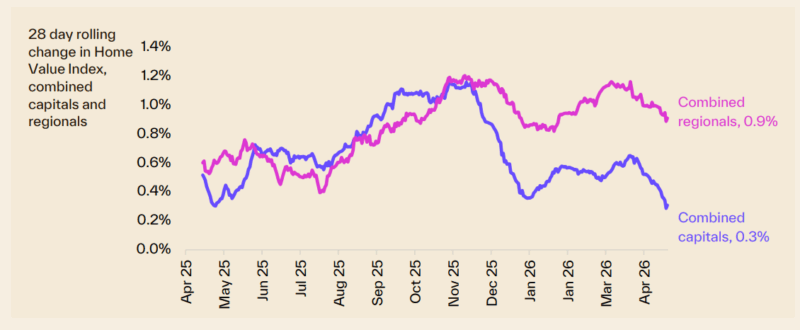
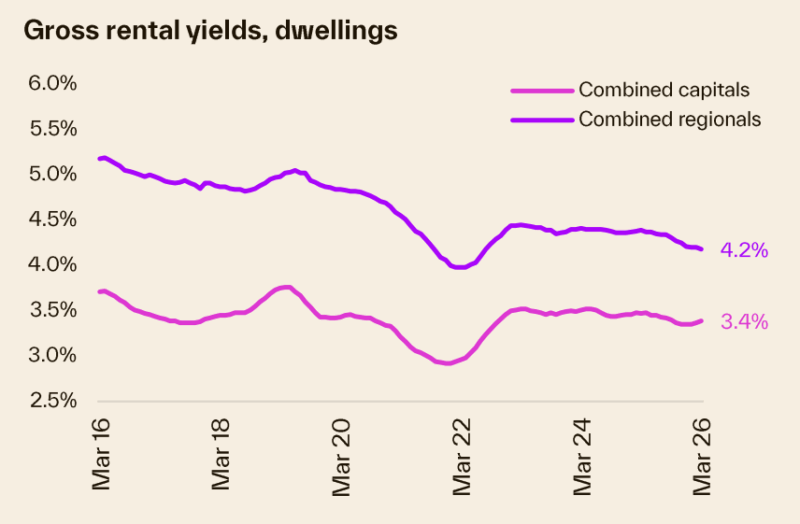
Rental growth is re-accelerating — national rents up 5.9% annually, with the quarterly quarterly change to 2.1%, the largest three month change in rents since May 2024.
This week the data reminded us just how fragmented the Australian housing market has become. While some capitals are barely moving and others are quietly outperforming.
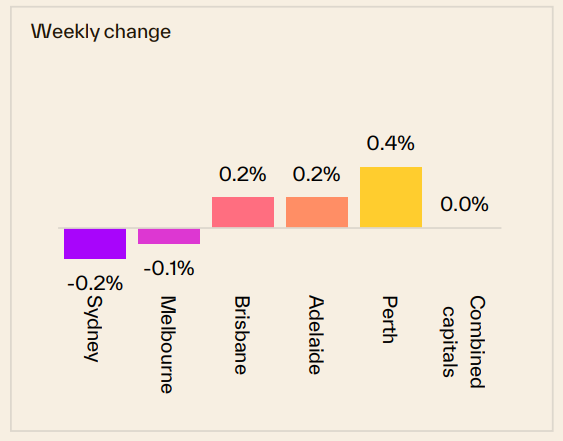
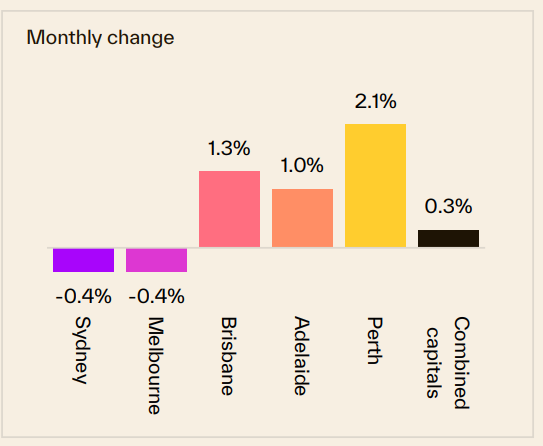
Sydney property prices declined -0.2% over the last week, also declined -0.4% over the last month but are 4.4% higher than they were 12 months ago.
Melbourne property prices declined -0.1%t over the last week, also declined -0.4% over the last month, and increased 2.8% compared to 12 months ago.
Brisbane property prices increased 0.2% over the last week, increased 1.3% over the last month and are 19.6% higher than they were 12 months ago.
Overall, Australian capital dwelling prices increased 0.3% over the last month and are now 9.3% higher than they were 12 months ago
Every week I sit down with the latest property data and try to cut through the noise to find what actually matters for serious investors.
Right now, there's quite a bit of noise swirling around - global uncertainty off the back of trade tensions and Middle East conflict, oil prices still elevated, inflation sitting stubbornly above the RBA's comfort zone, and fresh voices in the media warning that 2026 is the year to sit on your hands.
I've heard those warnings before. I've heard them in every cycle for the past 50 years.
And every time, the investors who stayed patient and strategic came out ahead.
Yes, there are headwinds. Inflation is proving stubborn. Rates are likely to rise again.
And one commentator received some headlines as he warned that Middle East conflict could push inflation above 5% and that property prices could see a substantial downturn.
I understand the concern, but I think it's worth remembering that the structural forces underpinning housing markets - chronic undersupply, strong population growth, and a decade-long construction deficit - haven't changed.
What has changed is sentiment, and sentiment is always the most volatile part of any cycle.
Meanwhile, the rental market continues to tighten. National rents are up 5.5% annually, with the quarterly gain the strongest since April 2024 - a clear signal that the supply-demand imbalance underpinning our market hasn't gone anywhere.
Let me walk you through what the data is showing us this week, city by city.
On the auction front this week... close to one in five auctions withdrawn as clearance rates stall below 60%
The preliminary auction clearance rate has recorded a modest rise since the Easter long weekend, rising to 58.9% last week, one percentage point higher than the week prior (57.9%, revised down to 52.7% once finalised) and 3.5 percentage points higher than the Easter low (55.5%).
Auction clearance rates are being negatively impacted by a high portion of withdrawn auctions, which count as an unsuccessful outcome in the results.
See Cotality's full auction report below.
This week, Cotality also reports that:
- Sydney property prices declined -0.2% over the last week, also declined -0.4% over the last month but are 4.4% higher than they were 12 months ago.
- Melbourne property prices declined -0.1%t over the last week, also declined -0.4% over the last month, and increased 2.8% compared to 12 months ago.
- Brisbane property prices increased 0.2% over the last week, increased 1.3% over the last month and are 19.6% higher than they were 12 months ago.
Overall, Australian capital dwelling prices increased 0.3% over the last month and are now 9.3% higher than they were 12 months ago.
Clearly, the property cycle is moving on but our markets are very fragmented.

Source: Cotality April 20th 2026
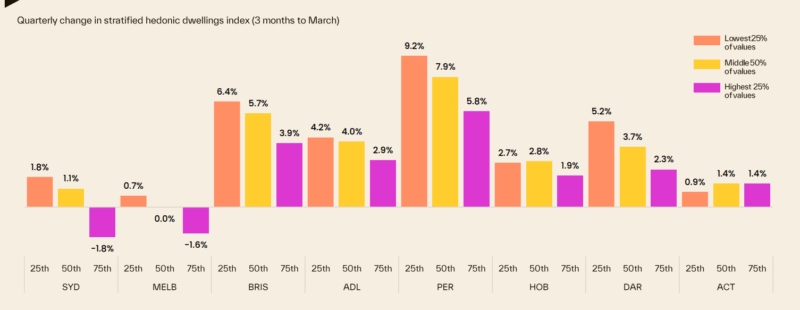
Of course, these are "overall" figures - there is not one Sydney or Melbourne or Brisbane property market.
And various segments of each market are performing differently.
At the beginning of this cycle the upper quartile of the market lead the upswing but last year the lower quartile across every capital city recorded a stronger outcome for housing values relative to its upper quartile counterpart.
The following chart shows how various segments of each capital city market are performing differently, with median-priced properties performing well.
To help keep you up-to-date with all that's happening in property, here is my updated weekly analysis of data and charts as of 20th April 2026, provided by SQM Research, Cotality, and realestate.com.au.
Current property asking prices
Property asking prices are a useful leading indicator for housing markets - giving a good indication of what's ahead.
Here is the latest data available:
Sydney
| Property type | Price ($) | Weekly Change | Monthly Change % | Annual % change |
|---|---|---|---|---|
| All Houses | 2,156.953 | -1.653 | -1.2% | 7.1% |
| All Units | 922.781 | 2.719 | 1.2% | 9.5% |
| Combined | 1,652.541 | 0.134 | -0.6% | 7.5% |
Source: SQM Research
Melbourne
| Property type | Price ($) | Weekly Change | Monthly Change % | Annual % change |
|---|---|---|---|---|
| All Houses | 1,345.203 | -0.703 | 0.0% | 5.6% |
| All Units | 680.397 | -1.490 | -0.2% | 8.5% |
| Combined | 1,134.667 | -0.952 | -0.1% | 6.1% |
Source: SQM Research
Brisbane
| Property type | Price ($) | Weekly Change | Monthly Change % | Annual % change |
|---|---|---|---|---|
| All Houses | 1,447.497 | -2.397 | -0.2% | 18.7% |
| All Units | 900.229 | 1.921 | 1.7% | 25.1% |
| Combined | 1,309.125 | -1.305 | 0.1% | 19.7% |
Source: SQM Research
Perth
| Property type | Price ($) | Weekly Change | Monthly Change % | Annual % change |
|---|---|---|---|---|
| All Houses | 1,322.672 | 3.116 | 4.6% | 17.8% |
| All Units | 814.122 | 0.412 | 2.6% | 25.5% |
| Combined | 1,189.026 | 2.405 | 4.2% | 19.1% |
Source: SQM Research
Adelaide
| Property type | Price ($) | Weekly Change | Monthly Change % | Annual % change |
|---|---|---|---|---|
| All Houses | 1,144.356 | 1.194 | 0.4% | 12.7% |
| All Units | 605.377 | -7.277 | -3.4% | 12.3% |
| Combined | 1,047.229 | -0.332 | -0.1% | 12.7% |
Source: SQM Research
Canberra
| Property type | Price ($) | Weekly Change | Monthly Change % | Annual % change |
|---|---|---|---|---|
| All Houses | 1,265.404 | -3.542 | 0.4% | 9.4% |
| All Units | 603.983 | -3.871 | -1.0% | 0.7% |
| Combined | 1,014.522 | -3.667 | 0.1% | 6.8% |
Source: SQM Research
Darwin
| Property type | Price ($) | Weekly Change | Monthly Change % | Annual % change |
|---|---|---|---|---|
| All Houses | 836.978 | -4.178 | 2.0% | 9.5% |
| All Units | 487.239 | 2.511 | 4.3% | 21.3% |
| Combined | 699.398 | -1.547 | 2.7% | 12.4% |
Source: SQM Research
Hobart
| Property type | Price ($) | Weekly Change | Monthly Change % | Annual % change |
|---|---|---|---|---|
| All Houses | 906.672 | -0.491 | 0.4% | 8.1% |
| All Units | 517.636 | 1.164 | 0.6% | 2.9% |
| Combined | 847.128 | -0.237 | 0.4% | 7.5% |
Source: SQM Research
National
| Property type | Price ($) | Weekly Change | Monthly Change % | Annual % change |
|---|---|---|---|---|
| All Houses | 1,092.464 | -7.733 | -0.1% | 12.0% |
| All Units | 651.840 | -3.983 | 0.3% | 12.2% |
| Combined | 996.595 | -6.917 | -0.1% | 11.9% |
Source: SQM Research
Cap City Average
| Property type | Price ($) | Weekly Change | Monthly Change % | Annual % change |
|---|---|---|---|---|
| All Houses | 1,588.593 | -3.457 | 0.2% | 9.2% |
| All Units | 815.115 | -1.187 | 0.8% | 12.2% |
| Combined | 1,356.782 | -2.777 | 0.3% | 9.6% |
Source: SQM Research
The value of property asking prices as a leading indicator for housing markets is quite significant.
In fact it's more valuable than median prices which can be quite misleading.
Let's delve into why this is the case and how it impacts the real estate market.
- Early Market Sentiment Indicator: Asking prices often reflect the current sentiment of sellers in the real estate market.
If sellers are confident, they might set higher asking prices, anticipating strong demand.
Conversely, if sellers are uncertain or perceive a market downturn, they might lower their asking prices to attract buyers.
This makes asking prices a real-time indicator of market sentiment, often preceding changes in actual sales prices. - Predictive of Future Price Trends: Trends in asking prices can be predictive of where the actual property prices are headed.
For example, a consistent rise in asking prices over a period can signal an upcoming rise in transaction prices. - Impact of Economic Factors: Economic factors such as interest rates, employment rates, and broader economic health influence asking prices.
For instance, changes in the Reserve Bank of Australia's policies or shifts in the job market can quickly reflect in the asking prices, providing insights into how these factors are influencing the housing market. - Regional Variations: In a diverse market like Australia's, asking prices can also provide insights into regional disparities.
For instance, the property markets in Melbourne and Sydney might behave differently from those in Brisbane or Perth. Asking prices can give early indications of these regional trends. - Influence of Supply and Demand: Asking prices are also a response to the balance of supply and demand in the market.
In areas with limited supply and high demand, asking prices tend to be higher and vice versa.
However, it's important to note that while asking prices are a valuable indicator, they should not be used in isolation.
Other factors like actual sales prices, time on the market, auction clearance rates, and economic conditions also play crucial roles in understanding the property market dynamics.
READ MORE: The latest median property prices in Australia’s major cities
Last weekend's auction report
Close to one in Five Auctions Withdrawn as Clearance Rates Stall Below 60%
The preliminary auction clearance rate has recorded a modest rise since the Easter long weekend, rising to 58.9% last week, one percentage point higher than the week prior (57.9%, revised down to 52.7% once finalised) and 3.5 percentage points higher than the Easter low (55.5%).
However, this was the third week running where the preliminary clearance rate has held below the 60% mark, well down on the March quarter average of 68.1%.
Auction clearance rates are being negatively impacted by a high portion of withdrawn auctions, which count as an unsuccessful outcome in the results.
Last week, the preliminary numbers showed 19.1% of auctions were withdrawn from sale across the combined capitals, highest in Sydney, where 26.7% of auction results reported so far were withdrawn from the market.
The number of auctions held also rose, jumping by more than a third (34.3%) from the week prior, with 2,520 auctions held.
Comparing with a year ago isn't all that helpful given the timing of Easter in 2025 (644 auctions held in the same week last year), but prior to Easter, the volume of auctions has been holding well above 2025 levels.
- Also read:5 ways to make money through property investment

- Also read:Brisbane Property Market Forecast [2026 & Beyond] – What The Olympics Decade Means for Investors.

- Also read:This week’s Australian Property Market Update – Latest Data, State by State April 21st 2026

- Also read:Melbourne property market forecast for 2026 & 2027 | Why the opportunity is bigger than it looks

- Also read:Sydney property market forecast for 2026 and 2027 | Why the short-term softness is a long-term opportunity

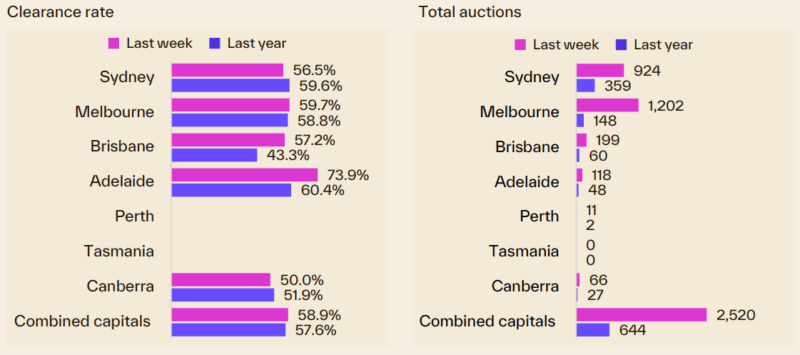
Melbourne led the auction market from a volume perspective, with 1,202 homes going under the hammer, up 37.4% from the week prior.
The preliminary figures show 59.7% of auctions have reported a successful result so far, up from 57.8% the week prior (revised down to 52.3% on final numbers).
This was the third week running where Melbourne's preliminary clearance rate has held below 60%.
924 auctions were taken to market in Sydney, a 35.1% increase on the week prior.
56.5% of auctions have reported a successful result, based on the figures collected to date, up from 54.4% the previous week, which revised down to 48.8%, the lowest finalised clearance rate for Sydney since April 2020.
199 auctions were held in Brisbane, a 70.1% jump in volume relative to the week prior.
The preliminary clearance rate dropped to 57.2%, down from 60.9% the previous week, to be the second lowest preliminary clearance rate so far this year (after the Easter long weekend).
Adelaide saw 118 homes taken to auction, 5.6% fewer than the week prior.
The preliminary clearance rate came in at 73.9%, up from 70.8% and the second week in a row where the early clearance rate has been higher than 70%.
Canberra hosted 66 auctions, with half (50%) reporting a successful result so far.
Only eleven auctions were held in Perth and no auctions in Tasmania.
With ANZAC Day on Saturday this week and several states holding a long weekend (NSW, ACT and WA), auction numbers are set to drop.
Cotality is currently tracking around 770 auctions scheduled to go under the hammer this week, bouncing back to approximately 2,660 the week after.
Our rental markets
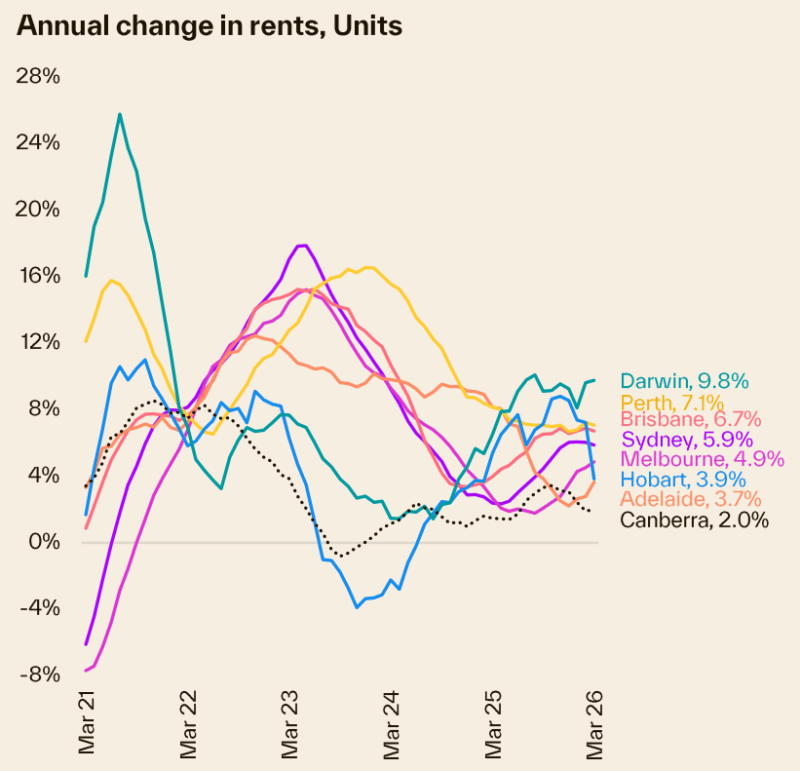
Rental markets are also seeing the emergence of multi-speed conditions.
Cotality’s national Rental Value Index has held around 0.7% over the past three months, taking the quarterly change to 2.1%, the largest three month change in rents since May 2024.
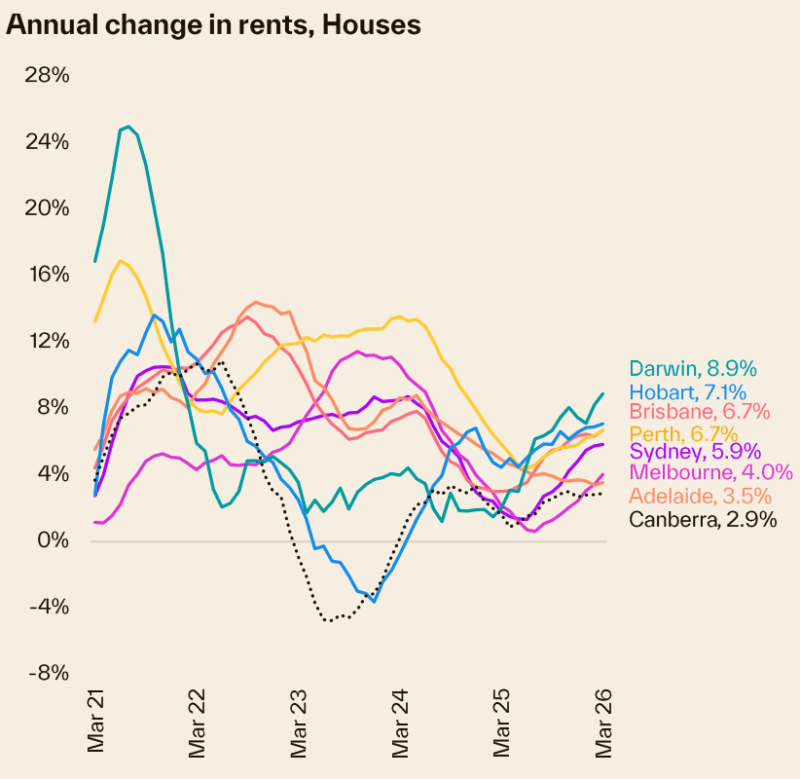
Most capitals have seen the annual rate of rental growth accelerating since mid - 2025 amid persistently low vacancy rates.
Nationally, the rental vacancy rate nudged a little higher in March, reaching 1.6%, but still well below the decade average of 2.5%.
With housing values and rents rising at a similar pace, gross yields are holding reasonably firm, albeit at a low
level.
Nationally, rental homes are returning a gross yield of 3.57%, down from 3.69% a year ago.
Sydney
| Property Type | Rent ($) | Weekly change | Monthly change | 12 Months change |
|---|---|---|---|---|
| All Houses | $1,151.90 | -1.90 | -0.3% | 8.6% |
| All Units | $754.79 | 1.20 | 1.1% | 5.8% |
| Combined | $915.87 | -0.05 | 0.4% | 7.3% |
Source: SQM Research
Melbourne
| Property Type | Rent ($) | Weekly change | Monthly change | 12 Months change |
|---|---|---|---|---|
| All Houses | $808.09 | -0.09 | 0.3% | 6.4% |
| All Units | $596.77 | 0.23 | 0.4% | 5.0% |
| Combined | $685.43 | 0.10 | 0.4% | 5.8% |
Source: SQM Research
Brisbane
| Property Type | Rent ($) | Weekly change | Monthly change | 12 Months change |
|---|---|---|---|---|
| All Houses | $816.49 | 3.51 | 0.5% | 7.6% |
| All Units | $634.41 | 2.59 | 0.8% | 6.4% |
| Combined | $734.46 | 3.09 | 0.6% | 7.1% |
Source: SQM Research
Perth
| Property Type | Rent ($) | Weekly change | Monthly change | 12 Months change |
|---|---|---|---|---|
| All Houses | $889.27 | 0.74 | 0.0% | 6.7% |
| All Units | $681.77 | 2.23 | 0.7% | 5.7% |
| Combined | $803.66 | 1.35 | 0.2% | 6.4% |
Source: SQM Research
Adelaide
| Property Type | Rent $) | Weekly change | Monthly change | 12 Months change |
|---|---|---|---|---|
| All Houses | $691.57 | -1.57 | 0.1% | 3.7% |
| All Units | $550.57 | -0.57 | 2.3% | 5.4% |
| Combined | $644.08 | -1.23 | 0.7% | 4.3% |
Source: SQM Research
Canberra
| Property Type | Rent ($) | Weekly change | Monthly change | 12 Months change |
|---|---|---|---|---|
| All Houses | $815.15 | 4.85 | 4.5% | 0.5% |
| All Units | $594.55 | -1.54 | 1.2% | 2.1% |
| Combined | $693.82 | 1.34 | 2.9% | 1.1% |
Source: SQM Research
Darwin
| Property Type | Rent ($) | Weekly change | Monthly change | 12 Months change |
|---|---|---|---|---|
| All Houses | $808.50 | -3.51 | 0.4% | 10.3% |
| All Units | $578.72 | -3.72 | -4.0% | 7.1% |
| Combined | $672.84 | -3.63 | -1.8% | 8.7% |
Source: SQM Research
Hobart
| Property Type | Rent 9$) | Weekly change | Monthly change | 12 Months change |
|---|---|---|---|---|
| All Houses | $623.03 | 2.96 | 3.1% | 11.7% |
| All Units | $565.67 | -9.66 | -0.5% | 12.2% |
| Combined | $600.18 | -2.06 | 1.7% | 11.9% |
Source: SQM Research
National
| Property Type | Rent ($) | Weekly change | Monthly change | 12 Months change |
|---|---|---|---|---|
| All Houses | $770.00 | -3.00 | -1.3% | 6.5% |
| All Units | $599.00 | 0.00 | 0.7% | 5.5% |
| Combined | $690.84 | -1.61 | -0.5% | 6.1% |
Source: SQM Research
Cap City Average
| Property Type | Rent ($) | Weekly change | Monthly change | 12 Months change |
|---|---|---|---|---|
| All Houses | $919.00 | -1.00 | -0.2% | 7.0% |
| All Units | $678.00 | 1.00 | 0.7% | 5.8% |
| Combined | $791.03 | 0.06 | 0.2% | 6.5% |
Source: SQM Research
Sellers of good properties are on strike
Vendor activity has been lower than average for this time of the year.
The flow of new listings moved through a seasonal high in early March but has tracked below the five-year average through the year-to-date.
Over the four weeks to April 5 th, the number of new listings added to the market nationally was 3.3% lower than a year ago and 6.1% below the five - year average.
Cotality was tracking close to 122,500 house and unit listings over the four weeks to April 5th.
With a softer than average flow of new listings to market, total advertised stock levels were tracking 11.5% lower than at the same time a year ago and 15.1% below the five - year average.
Vendor metrics
Compared to a year ago, homes are selling faster.
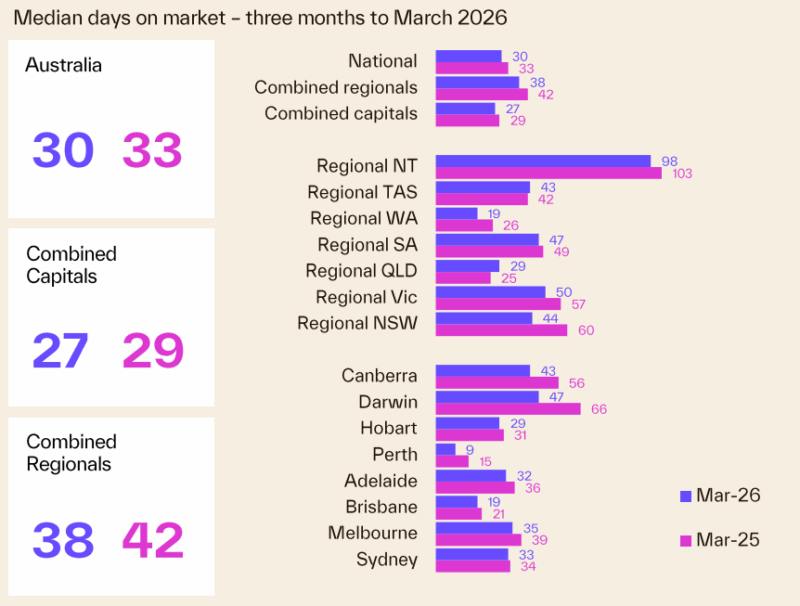
Homes are selling faster, with a median of 30 days on market in the March quarter, down from 33 days in Q1 2025.
However, the median selling time has risen through early 2026, reflecting a combination of seasonality alongside a slowdown in housing demand.