Key takeaways
If migration is easing, why is demand for property still so strong?
Sure, the post-pandemic surge in overseas migration is now easing, but that doesn’t mean its impact on housing demand has suddenly disappeared.
Regional Australia is no longer a single “boom or bust” narrative, but some regional markets have strongly outperformed their capital city counterparts.
The auction markets finished December strongly suggesting they are going to commence 2026 with strong momentum.
If migration is easing, why is demand for property still so strong?
In today's Property Insider Chat, Dr. Andrew Wilson and I discuss how the recent surge in migration is now easing, how population flows are reshaping demand between the states, and what that means for housing pressure in both capital cities and key regional markets.
We will also look at how the major regional markets around Australia have been performing.
If you only followed the headlines, you’d be forgiven for feeling confused about where Australia’s property markets are heading next.
One week we’re told demand is collapsing, the next week prices are rising again.
Some commentators talk about migration-driven booms, while others warn of affordability ceilings and buyer fatigue.
The problem isn’t a lack of information - it’s a lack of context.
So today Dr. Andrew Wilson explains what’s actually happening across migration, buyer demand, auction markets, and regional performance, and then joins the dots.
And when you do that, a much clearer picture emerges.
Migration Is Easing, But the Impact Is Still Being Felt
Watch this Property Insiders chat as Dr. Andrew Wilson discusses the latest migration figures.
Yes, the post-pandemic surge in overseas migration is now easing, but that doesn’t mean its impact on housing demand has suddenly disappeared.
Population growth works with long lags.
The people who arrived over the last couple of years still need somewhere to live, and they’re competing in markets that were already undersupplied.
The data shows New South Wales continues to attract the highest level of overseas migration, while Queensland remains the standout for interstate migration.
These population flows are reshaping housing demand in very specific ways, putting ongoing pressure on rental markets and supporting prices in areas where supply simply hasn’t kept up.
This is one of those points many investors miss.
Migration doesn’t need to keep accelerating forever to support housing demand.
It just needs to remain structurally higher than new housing supply - and right now, it is.
Jenny Dobak, ABS head of migration statistics, said:
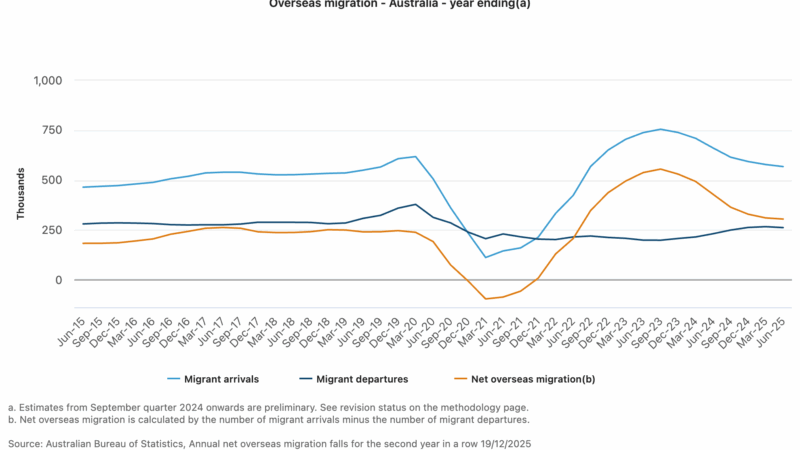
‘Net overseas migration dropped by 124,000 people in 2024-25, falling for the second year in a row since the financial year high of 538,000 people in 2022-23.
‘The change in net overseas migration was driven by both a 14 per cent decrease in migrant arrivals, particularly temporary visa holders, and a 13 per cent increase in migrant departures.
‘While net overseas migration is not currently at the level seen prior to the pandemic, this year’s overseas migration figures are the closest to pre-COVID-19 figures since annual net overseas migration peaked in September quarter 2023.
‘Migrant arrivals in 2024-25 were only 3 per cent higher than in 2018-19, but migrant departures remained 15 per cent lower than they were in 2018-19.’
Regional Property Markets Are No Longer a Single Story
Watch this Property Insiders chat as Dr. Andrew Wilson breaks down the top-performing regional markets across each state.
Regional Australia is no longer a single “boom or bust” narrative.
The data highlights a wide dispersion of outcomes.
Some regions in New South Wales, Victoria, Queensland, Tasmania, and the Northern Territory have recorded very strong annual price growth, while others are clearly slowing.
What separates the outperformers from the rest is not hype, lifestyle appeal, or social media popularity.
It’s fundamentals: local economies, employment drivers, population growth, relative affordability, and constrained supply.
Auction Markets Reveal Where Demand Is Real
As always, Dr. Andrew Wilson chats about our auction markets
Auction clearance rates are one of the clearest real-time indicators of buyer sentiment.
Andrew’s data shows Sydney and Melbourne consistently recording clearance rates in the mid to high 60% range in December, with Adelaide even stronger at times.
Brisbane and Canberra, while more variable, are also showing improving depth of demand.
What matters here isn’t whether clearance rates tick up or down in a single week.
It’s the persistence of buyer engagement over time.
When clearance rates remain elevated month after month, it tells us buyers are absorbing higher interest rates and affordability constraints rather than retreating en masse.
In other words, demand hasn’t disappeared. It has become more selective.
That’s an important distinction for investors, because selective demand rewards quality assets in the right locations, while secondary properties are left behind.
What This Means for Property Investors
Taken together, the data paints a very different picture from the one often portrayed in the media.
We’re not in a uniform boom, and we’re certainly not heading into a widespread crash.
Instead, we’re in a more mature phase of the cycle where fundamentals matter more than ever.
Migration continues to underpin demand, auction markets confirm buyers are still active, and regional performance is becoming increasingly polarised.
For investors, this means three things.
First, ignoring short-term noise is essential. Markets don’t move in straight lines, and volatility doesn’t equal risk if your strategy is sound.
Second, quality matters more than ever. A-grade properties in locations with long-term demand drivers will continue to outperform.
And third, this is not the time for generic advice. Broad market commentary won’t help you build wealth. Strategic, data-led decisions will.
That’s exactly why conversations like this with Andrew are so important.
They remind us that property investment success doesn’t come from predicting the next headline, but from understanding the forces quietly shaping the market underneath it.


