


Key takeaways
Lower-value suburbs delivered the strongest value gains, led by Kalbarri (WA), up 40.2% for houses, and Cranbrook (Qld), up 29.3% for units.
Sydney’s premium suburbs remained the country’s highest value markets, with Point Piper recording a house median of $17.3 million and a unit median of more than $3.1 million.
Mosman recorded the highest total value of house sales nationally, with $1.58 billion transacted across 229 sales.
WA’s resource-linked towns produced the nation’s strongest rental yields, with Newman at 12.6% for houses and South Hedland at 17.8% for units.
Pegs Creek (WA) had the highest annual house rent increase at 23.5%, unit rents rose highest in Rockhampton (QLD) up 21.1%.
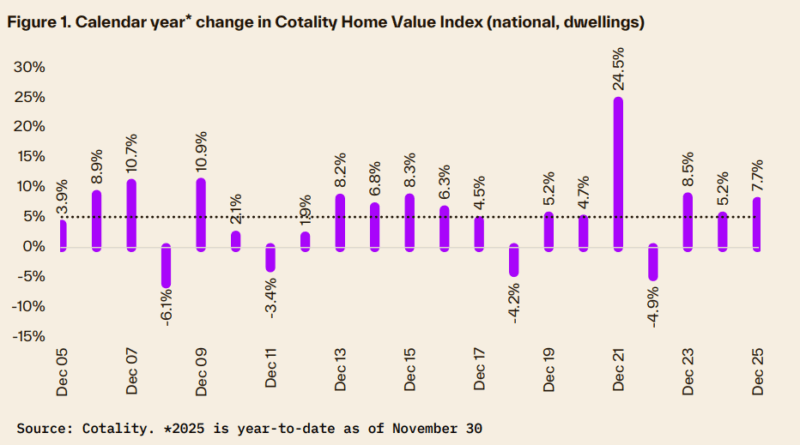
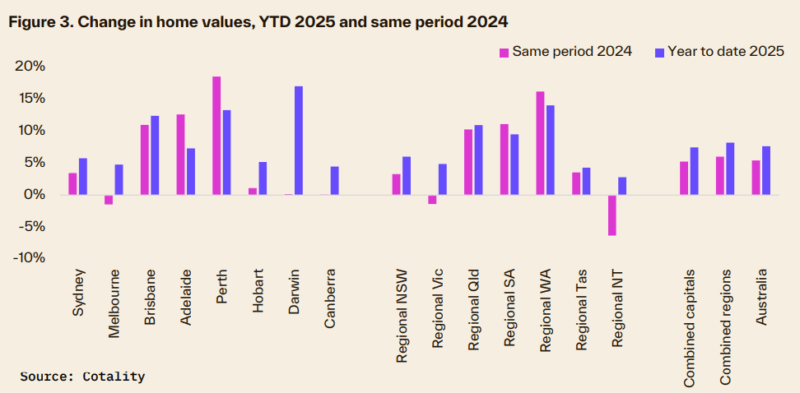
Australia’s housing market staged a turnaround in 2025, defying intense affordability and cost of living pressures to deliver an above decade-average growth rate of 7.7% through the year-to-date.
National dwelling values are set to close 2025 at least 8% higher.
This highlights how quickly conditions shifted after a challenging start.
Markets entered 2025 under considerable pressure.
Affordability had hit a series high, serviceability was stretched and price growth had flattened out.
What followed was an unexpectedly strong rebound as interest rate cuts, easing inflation and limited supply reignited competition.
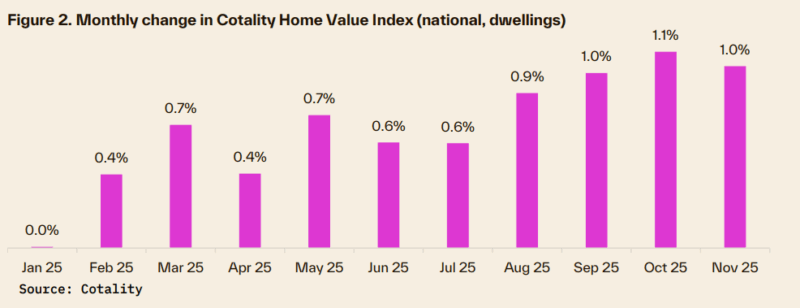
Three rate cuts, an expansion of the 5% Home Guarantee Deposit Scheme and persistently low listing volumes helped drive the recovery, with the housing market recording three consecutive months of growth of at least 1% by November and reaching a new high of $12 trillion.
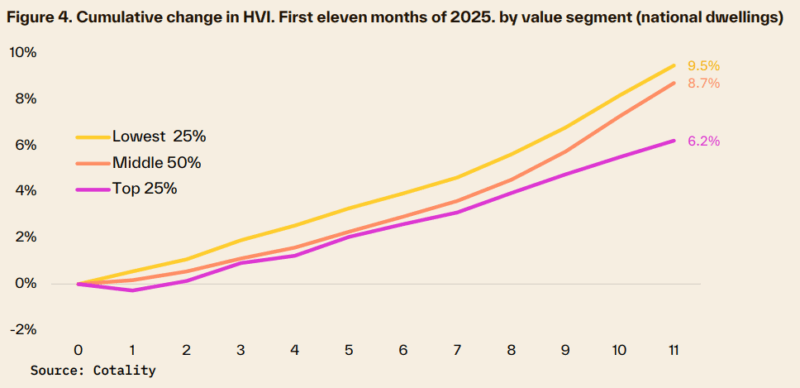
The turnaround was most visible across lower value markets and regions where buyers were able to respond quickly to more favourable credit conditions.
Tight supply meant even modest demand created upward pressure on prices.
Cheaper markets were had the most acceleration because they remained within reach for buyers navigating higher living costs.
Prestige Sydney remains Australia’s price leader
Sydney’s top-end suburbs sat in their own price bracket in 2025, widening the gap between premium enclaves and the rest of the country.
Point Piper led the national list with a median house value of $17.3 million and unit medians above $3.1 million, followed by long-established areas such as Bellevue Hill, Vaucluse, Tamarama and Rose Bay.
The resilience of premium Sydney markets was in sharp contrast to affordability pressures elsewhere.
Affordability constraints were a defining feature of 2025, yet premium markets continued to operate on their own cycle.
These suburbs are far less sensitive to borrowing costs and listing trends, which is why their performance often diverges from the broader market.
Mosman recorded the highest total value of house sales nationally at $1.58 billion across 229 transactions, underlining the scale of turnover even in a year of strained serviceability.
Lower value suburbs delivered the strongest gains
Western Australia dominated high house value growth in 2025, with Kalbarri increasing 40.2% to $515,378 followed by Rangeway (32.2%) and Lockyer (32.0%).
Similar trends emerged in the unit market, with strong results concentrated in Queensland’s mid-priced regions such as Cranbrook (up 29.3%) and Wilsonton (up 26.9%).
The performance of these markets highlighted the role of affordability at a time of constrained borrowing power.
Lower value areas offered buyers an opportunity to get into the market if they had the capacity to service a mortgage.
- Also read:Everything you need to know about the state of Australia’s property markets in 20 charts – April 2026

- Also read:National Weekly Auction Report – April 11th 2026 | Auction Markets Steady After Easter with School Holiday Listings

- Also read:Latest Property Asking Prices State by State | National Listings Rise in March
- Also read:Rents Surge Again as Interest Rates Bite – What Happens Next?| | Property Insiders

- Also read:Latest Property Price Forecasts Revealed. Australian Property Market Outlook 2026: Where To Now After The Rate Rise.

Once interest rate cuts started to flow through, demand lifted quickly in those areas where prices had further room to grow.
Investors were a particularly strong driver of demand in markets across WA and QLD, where the share of new mortgage lending to investors reached 38.3% and 41.1% respectively.
Perth, Brisbane and Darwin lead capital-city upswing
Darwin posted the strongest rise among the capitals at 17.1% through the year-to-date, following a flat result in 2024, joined by Brisbane and Perth as Australia’s three top- performing capital cities.
The fastest growing capital-city suburb for houses was Mandogalup in Perth (up 33.0% to $944,609), alongside several outer Darwin suburbs where more moderate entry points below $600,000 supported stronger value growth.
The most affordable capital-city suburbs for houses were clustered around Greater Hobart, including Gagebrook, Herdsmans Cove and Bridgewater, all with medians under $450,000.
Suburbs in Adelaide and Darwin provided some of the best value for unit buyers, with medians ranging from less than $250,000 in Hackham, Adelaide to $328,416 for Karama in Darwin.
Biggest gains and the steepest falls in Regional Australia
Strong upswings in WA and Queensland contrasted with declines in other regional pockets.
House values fell 11.6% in Millthorpe (NSW) and 10.5% in Tennant Creek (NT) while several unit markets recorded annual declines, including South Hedland (down 14.1%) and Mulwala (down 11.8%).
These differences reflected the uneven backdrop of supply levels, migration flows and localised demand.
Some regional areas are still benefiting from relative affordability and tight rental conditions.
Others are adjusting to earlier periods of rapid growth or shifts in local economic activity.
Mining towns produced the highest yields
Rental demand remained firm across key resource corridors in regional WA and parts of regional Queensland, where constrained supply, strong employment bases and short-stay workforces contributed to some of the highest yields in the country.
Newman, in the Pilbara, delivered the strongest house yields at 12.6%, reflecting demand linked to iron ore operations, Kambalda East, near the Goldfields mining belt, followed at 12.2%, supported by nickel and gold activity.
Unit yields were even stronger, with South Hedland leading the country at 17.8%, while Newman recorded 14.3% and Pegs Creek recorded 13.2%, as apartment stock is limited and worker demand remains consistent.
Pegs Creek, located in Karratha, recorded a 23.5% increase in house rents over the year and Rockhampton City recorded a 21.1% jump in unit rents.
Constraints to shape 2026
Market conditions are expected to be more restrained in 2026 as borrowing capacity, affordability and credit assessments place limitations on demand.
National listings remain 18% below the five-year average and new housing completions continue to trail household formation, maintaining the structural imbalance that supported stronger conditions in 2025.
Imbalance alone is not enough to drive the same level of growth next year.
Supply remains tight, but the demand environment is shifting. Inflation forecasts have been revised higher, interest rate expectations have adjusted with them, and households are facing stricter borrowing assessments.
Those factors can temper buyer activity even when stock levels are low.
Lower value markets may still outperform because they carry less sensitivity to credit constraints, but overall growth is likely to be more measured compared with 2025.


