


Key takeaways
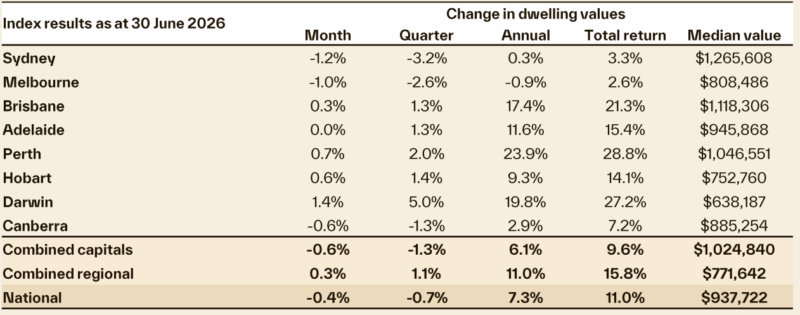
Cotality’s national Home Value Index (HVI) dropped 0.4% in June, driven by a 1.2% decline in Sydney home values and a 1.0% decline in Melbourne.
Capital city home values fell by 1.3% over the June quarter, led by Sydney (-3.2%) and Melbourne (-2.6%), marking a significant shift in Australia’s housing dynamic.
Mid-sized capitals experienced a sharp growth slowdown; Adelaide values were unchanged, while Brisbane and Perth rose modestly by 0.3% and 0.7%.
Softening conditions are evident in auction clearance rates dropping below 50% since late May, alongside capital city home sales falling 16.2% compared to last year and rising advertised stock levels.
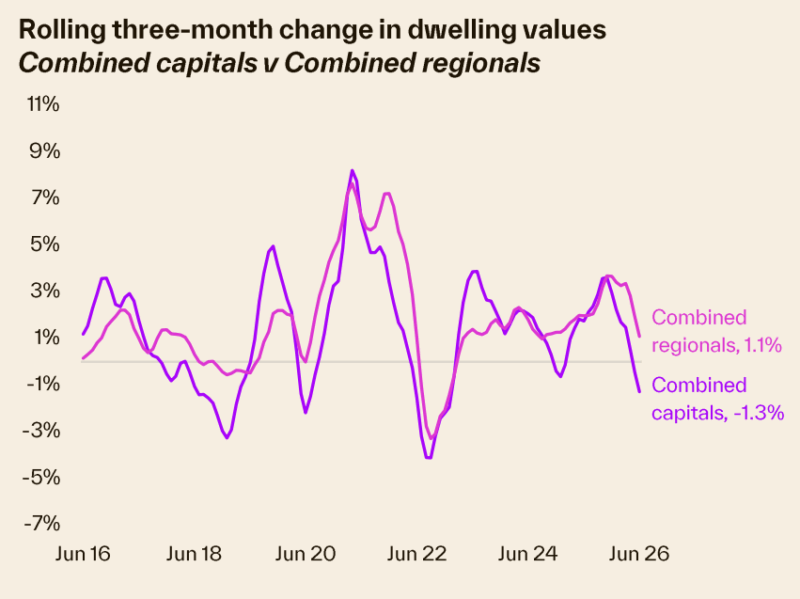
Regional markets continue to outperform capital cities, with the combined regional index increasing by 0.3% in June and 1.1% over the quarter.
Cotality’s national Home Value Index (HVI) dropped 0.4% in June, marking the largest month-on-month fall since December 2022.
A 1.2% decline in Sydney home values served as the most significant drag on the headline result. Melbourne followed closely with a 1.0% decline, while ACT values fell 0.6%.
The mid-sized capitals recorded a sharp slowdown in their rate of growth
Adelaide values were unchanged over the month, while Brisbane and Perth saw modest month-on-month rises of 0.3% and 0.7%, respectively.
This represents a material slowdown relative to the pace of gains through the March quarter, when Brisbane values rose at an average monthly pace of 1.9% and Perth at 2.5%.
As the market rapidly decelerates, the HVI has seen recent months revise lower.
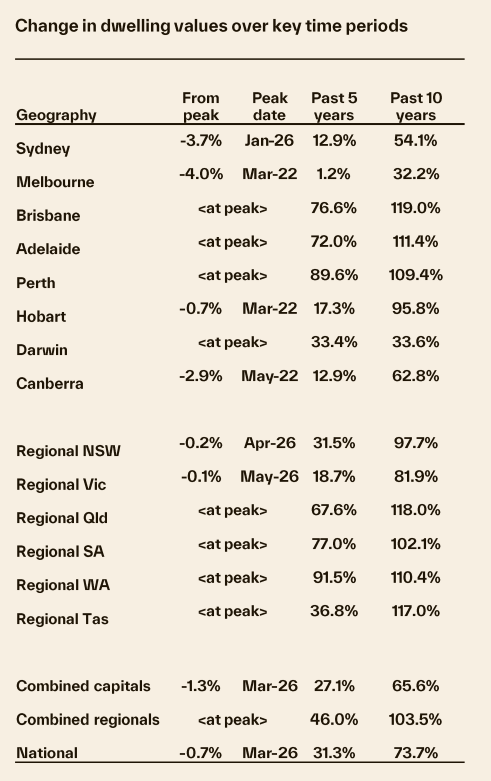
The June update now indicates the national measure peaked in March, with values down 0.7% through the June quarter.
The downward revision reflects a market that is changing rapidly.
Most regions have seen values revise lower over recent months, with the largest downgrades occurring in Perth and Brisbane, where the May index has been revised 88 and 53 basis points lower with the June update.
The June quarter marks a significant shift in Australia’s housing dynamic
Capital city home values have fallen by 1.3% over the quarter, with Sydney leading the pace of decline at -3.2%.
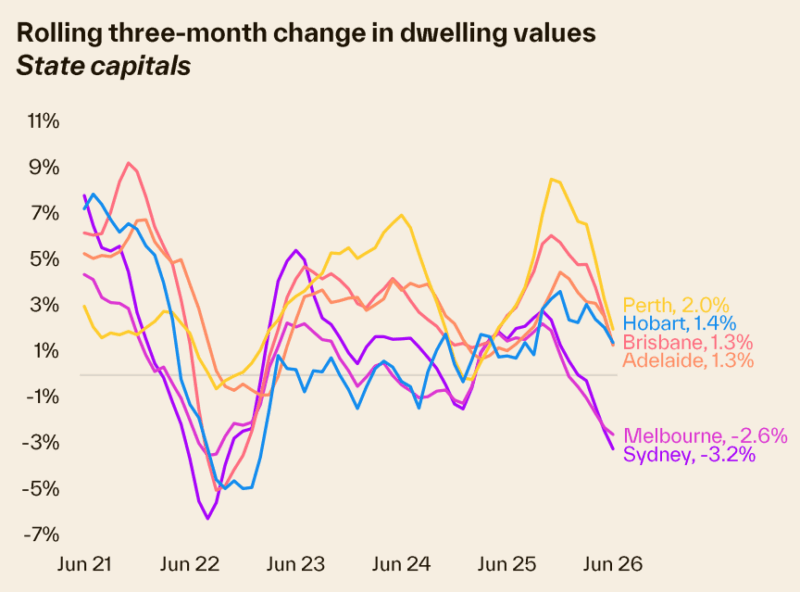
Melbourne values were down 2.6% through the quarter, and ACT values are 1.3% lower.
Weaker conditions through the second quarter of the year are attributable to an array of downside factors.
Even before interest rates rose by seventy-five basis points, we were seeing affordability hurdles weighing on buyer demand.
Higher cost-of-living pressures, deeply pessimistic sentiment and a further dampening of demand via property taxation changes announced in the federal budget are all contributing to weaker housing conditions.
A weaker housing market can be seen across other metrics, including auction clearance rates, estimates of home sales and the number of properties listed for sale
The combined capital cities auction clearance rate has held below 50% since the last week of May, dropping to the low 40% range from late June.
Capital city home sales, over the three months to June, are estimated to be 16.2% lower than at the same time last year and 14.5% below the five-year average for this time of year.
At the same time, advertised supply across the capitals is in line with the five-year average (-0.1%) but almost 11% higher than a year ago.
Such low clearance rates indicate a mismatch between buyer and seller pricing expectations. Buyers now have more stock to choose from and less urgency in their decision-making.
Higher listings aren’t due to a pick-up in the flow of new listings; it’s a symptom of less demand in the market, which has led to an accumulation of advertised stock.
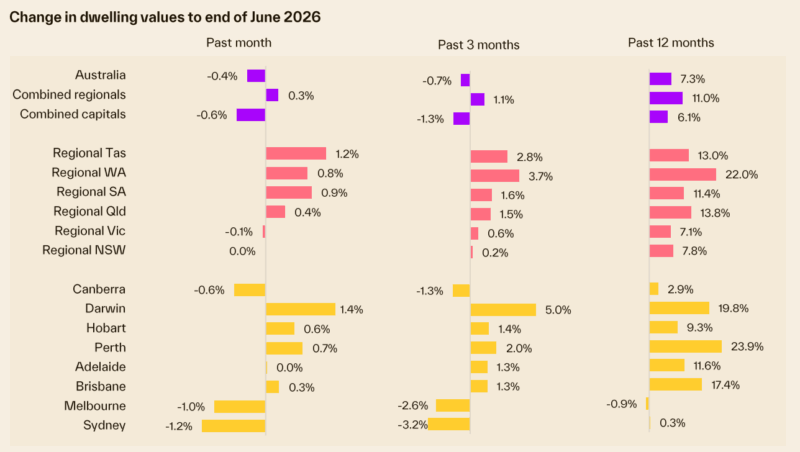
Outside the capital city trends, regional markets continue to outperform their capital city counterparts
Broadly, the combined regional index was up 0.3% in June and was 1.1% higher over the quarter, although the pace of gains is clearly slowing across regional Australia as well.
Regional Vic recorded the weakest result, with values down 0.1% in June, while values were flat across regional NSW over the month.
Regional WA remains the strongest market across the broad regions of Australia, with values up 3.7% in the June quarter.
Outlook
1. Housing market conditions have weakened further through June, with a broader range of headwinds now weighing on demand.
The slowdown has been building for some time, initially through stretched affordability and serviceability constraints.
Higher inflation and seventy -five basis points of rate hikes have had a clear dampening effect on demand, and, more recently, the drag has become more pronounced as uncertainty around taxation policy and deeply pessimistic sentiment all work in the same direction.
- Also read:Australian housing market update | July 2026

- Also read:Everything you need to know about the state of Australia’s property markets in 20 charts – July 2026

- Also read:National Weekly Auction Report – July 18th 2026 | Early Signs of Improvement Continue in Mid-winter Home Auction Markets

- Also read:National Vacancy Rate Rises to 1.3% | SQM Research

- Also read:This week’s Australian Property Market Update – Latest Data, State by State July 14th 2026

2. Interest rate settings remain a key source of risk , even though the chance of another hike has moderated.
The RBA held the cash rate steady in June at 4.35%, providing some breathing space after earlier increases.
However, the case for another hike has not disappeared. With underlying inflation still above target and the labour market remaining tight, the data flow over the next few months will be important in determining whether the current pause can be sustained.
3. Consumer sentiment remains deeply pessimistic, and this is likely to keep a lid on housing activity.
The Westpac –Melbourne Institute Consumer Sentiment Index fell 2.9% in June, with households reporting renewed pressure on family finances alongside a worsening in house price expectations.
Low confidence tends to show up in weaker turnover, as households delay high-commitment decisions.
4. The Federal Budget has added to the downside risk to housing demand.
Proposed changes to negative gearing and capital gains tax settings are expected to bring about a sharp pullback in investor demand for established dwellings.
This comes at a time when investors were a major source of demand across many markets and follows a broader accumulation of disincentives, including higher holding costs and tighter serviceability assessments.
The policy aim is to redirect capital toward newly built supply, but the near -term effect is more likely to be weaker demand for established housing, detracting from aggregate housing demand.
5. The change in market conditions is already visible in the high-frequency indicators.
Auction clearance rates have moved materially lower, with the combined capitals clearance rate falling below the 50% mark in late May and tracking well below decade averages.
At the same time, advertised listings are trending higher across most markets, with Sydney, Melbourne and the ACT already seeing above - average stock levels.
The combination of weaker clearance rates and higher listings is a clear sign that buyers are regaining leverage.
6. Supply -side fundamentals are still helping to cushion the market, but they are not carrying the same weight as they were earlier in the cycle.
New housing supply remains constrained, and even where approvals and commencements have improved, it will take time for this to flow through to completions.
Population growth is still adding to underlying housing demand and rental markets remain tight, but these forces are increasingly being offst by affordability barriers, tighter credit conditions and weaker confidence.
7. The main positive is that conditions are improving for buyers who are prepared to move against the current.
More advertised stock, longer selling times and softer auction results are providing more choice and better negotiating conditions.
For buyers with secure employment, strong deposits and sufficient borrowing capacity, the market is becoming less competitive.
The improvement in affordability is likely to be gradual, but the shift in negotiating power is already more apparent.
8. Overall, the outlook has become more cautious.
The most likely path from here is a further loss of momentum and a gradual drift lower in housing values, rather than a sharp national correction.
Tight labour markets, low new supply and population growth should help to limit the downside, but the balance of risks has shifted further towards weaker conditions.
Investor - heavy markets, higher - value segments and areas where listings have risen above average are likely to be most
exposed.
The key watch points are now reasonably clear: whether core inflation continues to rise, whether the RBA is forced to tighten policy again, the speed and scale of the investor response to the Budget changes, and whether the lift in advertised stock becomes more entrenched through the second half of the year.


