
Key takeaways
In October, dwellings that fell within the price caps of the 5% Deposit Scheme increased 1.2%, compared to 1.0% for dwellings above, a differential of 22 basis points.
It is difficult to connect that directly to the scheme expansion, because there are many factors pushing the market higher and the low end of the market was outperforming in the lead up to the scheme expansion as well.
Putting that 22 basis points into perspective is important. Lower-value properties have outperformed the higher end of the market for the better part of two years, though this differential of 22 basis points is relatively high in historic terms, in the top 16% of differentials going back to 2009.
Houses below the price caps had a larger outperformance than units. National house values below the caps were up 1.3% in the month, 32 basis points higher than houses above the caps. Units below the caps had a 19 basis point premium of 1.0%.
Darwin had the highest outperformance of markets below the price caps (2.0%) compared to above the price caps (1.3%) in October.
Sydney had the second-highest outperformance of markets below the price caps (1.0%) compared to above the caps (0.5%).
Unusually strong home value increases in the month of October coincided with the expansion of the Federal Government’s 5% Deposit Scheme.
The policy enables eligible first home buyers to secure a low-deposit home loan without lender’s mortgage insurance.
From October 1, it was scaled up to unlimited places and income eligibility, and the price caps associated with the scheme were increased across most regions.
The new price caps associated with the 5% Deposit scheme are shown in Figure 1.
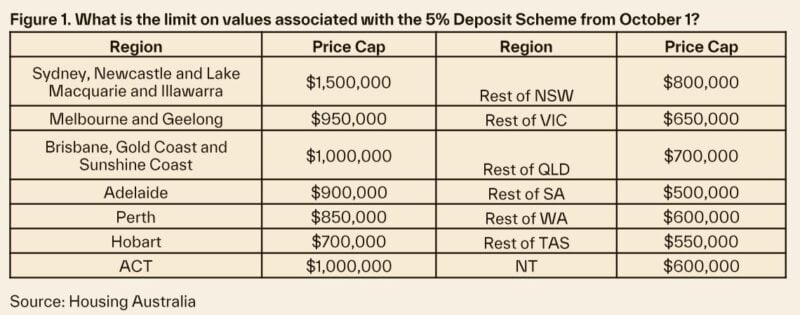
National home values rose 1.1% in October, the fastest monthly pace of growth since May 2023.
But monthly gains had already been accelerating since the first rate cut in February, and values were also buoyed by seasonality and low levels of stock.
Properties with an estimated value below the new caps of the scheme did outperform in October, but this has been the case for some time, as serviceability and affordability constraints have increasingly encouraged higher-income buyers to lower value market segments.
The level of outperformance was also within historic ranges for most markets.
In some markets, there has been a more notable increase in values below the scheme thresholds, suggesting localised market impact.
These were in desirable markets of Sydney (Northern Beaches, North Sydney and Hornsby, Eastern Suburbs) and Melbourne (Inner East), and the popular regional centres of Wide Bay, the Central Coast and Geelong.
National findings
In October, dwellings with a value estimate that fell within the price caps of the 5% Deposit Scheme increased 1.2%, compared to 1.0% for dwellings above, a differential of 22 basis points.
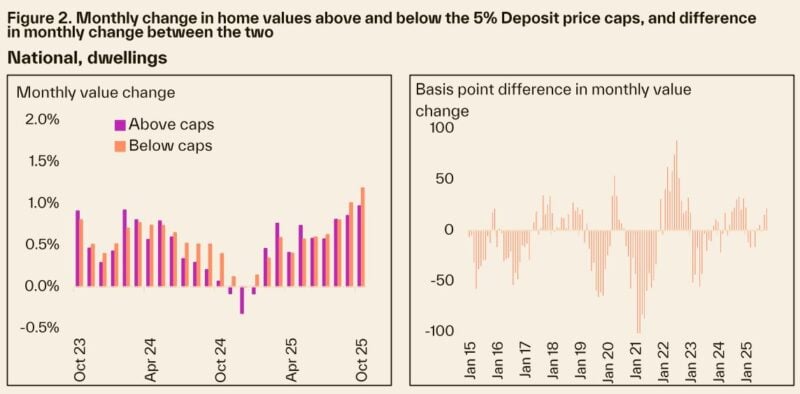
Putting that into perspective is important. Lower-value properties have outperformed the higher end of the market for the better part of two years.
One way to gain perspective is seeing where the differential in growth sits historically.
We do this by assigning it a ‘percentile rank’, or where on the scale of lowest to highest does the result sit.
The 22 basis point growth differential in October is in the largest 16% of differences going back to December 2009, or a percentile rank of 84%.
Between the house and unit markets, houses with an estimated value below the price caps had a larger outperformance than units.
National house values below the caps were up 1.3% in the month, 32 basis points higher than house values above the caps.

Units with an estimated value below the caps had a 19 basis point premium of 1.0%.
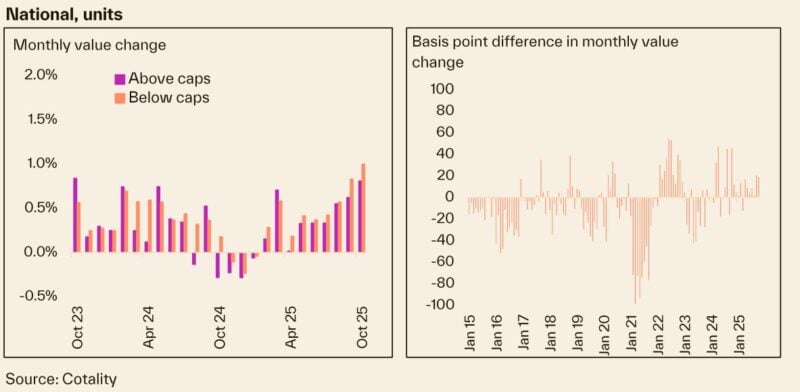
For both markets, the outperformance was relatively strong historically speaking, in the 84th percentile for houses and 85th percentile for units.
Capital city and regional findings
Capital city and regional results are summarised in Figure 4.
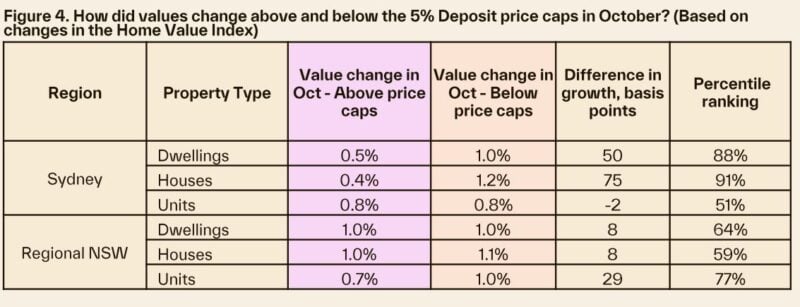

Every city but Hobart and the ACT showed property values below price caps had stronger capital growth than those above the caps in October.
The percentile rankings of those differentials were a little high in Sydney (88%), Perth and Darwin (both 85%).
The differentials were also above 70% in Melbourne and Brisbane, but well within historic ranges.
In the regions, VIC, WA, SA and QLD had notably strong outperformance in the low-end of markets in October, with growth differentials sitting in the top 30% of historic results.
Interestingly though, outperformance of values below the new price caps of the scheme was even stronger in the month prior, suggesting there are other factors that are driving lower-to-middle market values.
Perhaps most surprisingly, regional NSW saw a 1% increase in home values both above and below the caps.
The 1% uplift in home values is unusual for NSW, which had been averaging monthly performance of 0.4% a month through 2025 before October.
A boost to low values in high end markets
The markets where values below the price caps had the strongest outperformance were a mix of lower value pockets within high-end housing markets and popular regional centres.
Sub-markets of Melbourne’s Inner East topped the list, where values of homes below the price caps rose 1.7%, 130 basis points above the 0.4% growth for home values above $950,000.
This was in the top 9% of differential with values above $950,000.
Also on the list were the lower value segments across high-end markets of Sydney, with Northern Beaches properties below $1.5 million rising 0.9% compared to a flat result for higher end properties in the market.
Geelong and the Central Coast are also in the top 10 for outperformance and were also areas that had the capital city price thresholds for the scheme of $950,000 and $1.5 million respectively.
Figure 5 shows the top 10 markets where values below the price caps outperformed those above the caps most strongly in October.
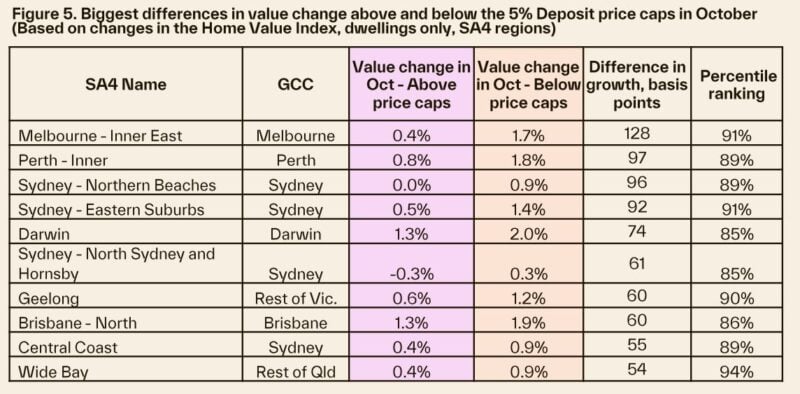
Darwin is also on the list, and this is a market where outperformance in lower-end home values may be explained by other factors, like an increase in investment activity, where investors also target relatively low value properties.
Importantly, Darwin was one of the few regions where price caps for the 5% deposit guarantee weren’t adjusted higher on October 1st.
Only 19% of Darwin suburbs have a median house value below the $600k price cap.
The data shows there has been a stronger uplift in property markets below the price caps of most regions through October.
However, historic growth trends suggest this was happening in recent months before the expansion of the 5% deposit scheme.
A causal relationship is difficult to establish, but it’s useful to have this perspective.
It is also worth noting that it might be too soon for the full impact of the expanded scheme to show up in price growth, and the numbers are worth reviewing over time.
Ultimately the expansion of the 5% Deposit scheme is one of many factors influencing strong growth at the lower-to-middle end of the market.


