Key takeaways
The Federal Government has fast-tracked its expanded Home Guarantee Scheme from January 2026 to October 1, 2025, allowing buyers to purchase with just a 5% deposit and no lenders mortgage insurance.
While this is good news for today’s first-home buyers, it is a demand-side policy that will drive up property prices in the short term.
History shows that similar grants and incentives – from the First Home Owners Grant to COVID-era buyer support – have only fuelled price growth rather than improved affordability.
This week, Cotality also reports that:
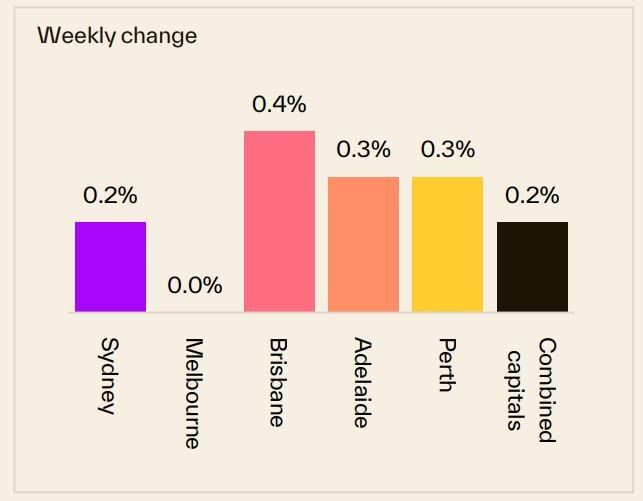
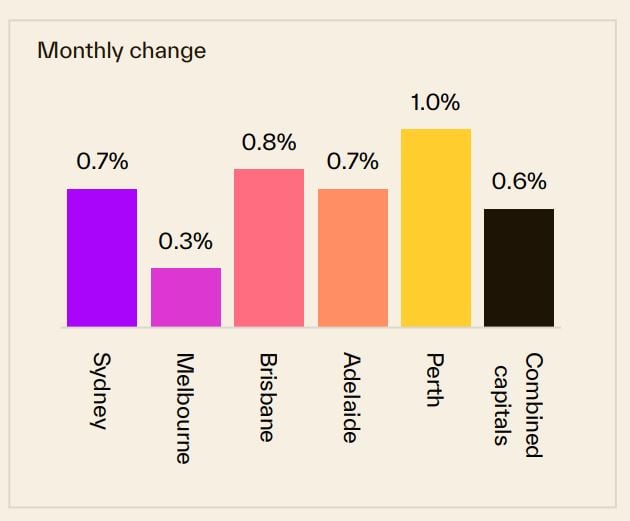
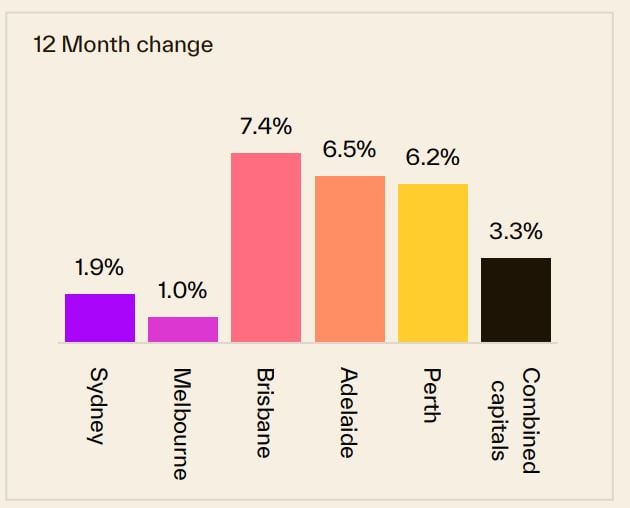
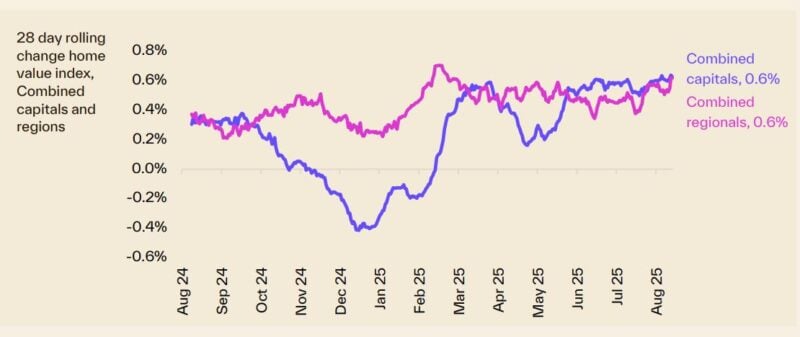
*Sydney property prices increased 0.2% over the last week, increased 0.7% over the last month and are 1.9% higher than they were 12 months ago.
*Melbourne property prices remained flat over the last week, increased 0.3% over the last month, and increased 1% compared to 12 months ago.
*Brisbane property prices increased 0.4% over the last week, increased 0.8% over the last month and are 7.4% higher than they were 12 months ago.
Overall, Australian capital dwelling prices increased 0.6% over the last month and are now 3.3% higher than they were 12 months ago.
There were 2,120 auctions held across the combined capitals last week.
The preliminary clearance rate nudged slightly higher, rising to 75.3% last week, the highest early result since the first week of April 2024 (75.9%).
This current property cycle has been driven by an undersupply of good properties relative to current demand pushing up property values and rents there was nothing to suggest there will be any significant change in the near future.
Unfortunately, the undersupply properties is going to persist for some time with all commentators agreeing that there is no way we're going to hit the housing construction targets required to meet our demand.
Interest rates are easing, auction clearance rates are at their highest levels in more than a year, and now the Federal Government has decided to add more demand-side stimulus into an already heated property market.
The recently announced changes to the Federal Government’s Home Guarantee Scheme, originally due to commence in January 2026, have been fast-tracked and will now begin on October 1 this year.
From October, buyers will be able to access the scheme with just a 5% deposit without having to pay costly lenders mortgage insurance. The program’s expansion will also extend eligibility to more groups – including permanent residents, non-couples buying together, and even some “rentvestors” purchasing outside their city of residence.
The aim is to help more Australians onto the property ladder sooner. But the timing couldn’t be more impactful.
Just as borrowing capacity is improving with lower rates, and demand is surging back into the market, the government has effectively poured more fuel onto already smouldering coals.
Every time a government introduces a new grant or scheme, they temporarily boost demand. More people can suddenly “afford” to bid at auction, which pushes prices higher.
-
Short-term winners: the current wave of first-home buyers who can access the scheme.
-
Long-term losers: the next wave of buyers who will face even higher prices.
It’s classic economic cause and effect.
On the auction front this week... 2,120 auctions held across the combined capitals last week.
The preliminary clearance rate nudged slightly higher, rising to 75.3% last week, the highest early result since the first week of April 2024 (75.9%)
This week, Cotality also reports that:
- Sydney property prices increased 0.2% over the last week, increased 0.7% over the last month and are 1.9% higher than they were 12 months ago.
- Melbourne property prices remained flat over the last week, increased 0.3% over the last month, and increased 1% compared to 12 months ago.
- Brisbane property prices increased 0.4% over the last week, increased 0.8% over the last month and are 7.4% higher than they were 12 months ago.
Overall, Australian capital dwelling prices increased 0.6% over the last month and are now 3.3% higher than they were 12 months ago.
Clearly, the property cycle is moving on but our markets are very fragmented.
Source: Cotality August 25th 2025
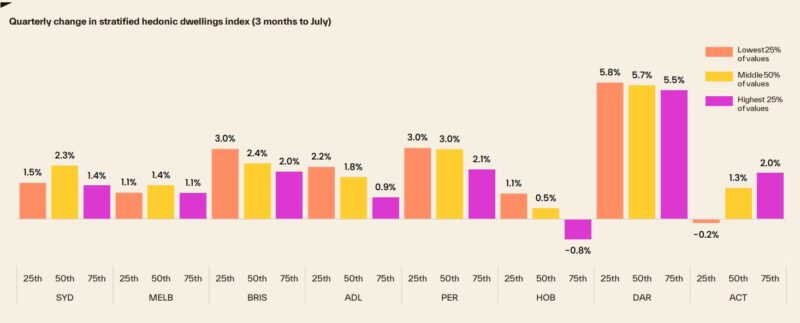
Of course, these are "overall" figures - there is not one Sydney or Melbourne or Brisbane property market.
And various segments of each market are performing differently.
At the beginning of this cycle the upper quartile of the market lead the upswing but last year the lower quartile across every capital city recorded a stronger outcome for housing values relative to its upper quartile counterpart.
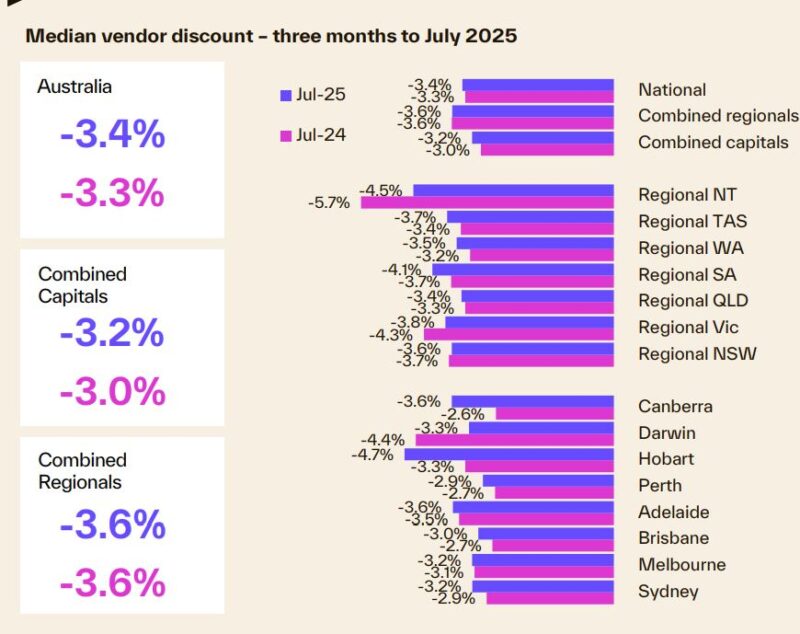
The following chart shows how various segments of each capital city market are performing differently with median-priced properties performing well.
To help keep you up-to-date with all that's happening in property, here is my updated weekly analysis of data and charts as of 25th August 2025 provided by SQM Research, Cotality, and realestate.com.au.
Current property asking prices
Property asking prices are a useful leading indicator for housing markets - giving a good indication of what's ahead.
Here is the latest data available:
Sydney
| Property type | Price ($) | Weekly Change | Monthly Change % | Annual % change |
|---|---|---|---|---|
| All Houses | 2,034,253 | 2.241 | -1.4% | 6.4% |
| All Units | 865,603 | -7.104 | 0.2% | 5.4% |
| Combined | 1,558,179 | -1.566 | -1.1% | 5.9% |
Source: SQM Research
Melbourne
| Property type | Price ($) | Weekly Change | Monthly Change % | Annual % change |
|---|---|---|---|---|
| All Houses | 1,294,365 | 0.379 | -0.3% | 4.5% |
| All Units | 633,783 | 2.017 | 1.2% | 4.2% |
| Combined | 1,086,862 | 0.897 | 0.0% | 4.3% |
Source: SQM Research
Brisbane
| Property type | Price ($) | Weekly Change | Monthly Change % | Annual % change |
|---|---|---|---|---|
| All Houses | 1,267,438 | 4.452 | 1.2% | 10.6% |
| All Units | 742,389 | -4.189 | 0.9% | 15.1% |
| Combined | 1,135,345 | 2.278 | 1.1% | 11.2% |
Source: SQM Research
Perth
| Property type | Price ($) | Weekly Change | Monthly Change % | Annual % change |
|---|---|---|---|---|
| All Houses | 1,155,109 | -9.180 | 0.6% | 10.1% |
| All Units | 660,285 | 2.531 | 1.7% | 19.0% |
| Combined | 1,025,425 | -6.111 | 0.8% | 11.4% |
Source: SQM Research
Adelaide
| Property type | Price ($) | Weekly Change | Monthly Change % | Annual % change |
|---|---|---|---|---|
| All Houses | 1,050,285 | -0.520 | 0.4% | 12.4% |
| All Units | 565,452 | 1.648 | 1.3% | 20.7% |
| Combined | 963,047 | -0.130 | 0.5% | 13.2% |
Source: SQM Research
Canberra
| Property type | Price ($) | Weekly Change | Monthly Change % | Annual % change |
|---|---|---|---|---|
| All Houses | 1,231,485 | 0.740 | 0.9% | 2.9% |
| All Units | 586,514 | -2.589 | -1.6% | -0.2% |
| Combined | 990,229 | -0.505 | 0.3% | 1.7% |
Source: SQM Research
Darwin
| Property type | Price ($) | Weekly Change | Monthly Change % | Annual % change |
|---|---|---|---|---|
| All Houses | 794,655 | -3.655 | -0.2% | 22.9% |
| All Units | 439,898 | 4.977 | 4.6% | 15.2% |
| Combined | 655,208 | -0.262 | 1.0% | 20.8% |
Source: SQM Research
Hobart
| Property type | Price ($) | Weekly Change | Monthly Change % | Annual % change |
|---|---|---|---|---|
| All Houses | 845,679 | 3.321 | 0.4% | 7.5% |
| All Units | 498,695 | 2.205 | -0.2% | 1.8% |
| Combined | 792,787 | 3.151 | 0.3% | 6.9% |
Source: SQM Research
National
| Property type | Price ($) | Weekly Change | Monthly Change % | Annual % change |
|---|---|---|---|---|
| All Houses | 1,008,330 | 1.879 | 0.4% | 8.3% |
| All Units | 594,954 | -2.489 | 0.9% | 6.7% |
| Combined | 918,829 | 0.933 | 0.4% | 8.0% |
Source: SQM Research
Cap City Average
| Property type | Price ($) | Weekly Change | Monthly Change % | Annual % change |
|---|---|---|---|---|
| All Houses | 1,479,697 | 1.120 | -0.6% | 6.7% |
| All Units | 742,375 | -7.212 | -0.2% | 6.9% |
| Combined | 1,259,860 | -1.364 | -0.5% | 6.6% |
Source: SQM Research
The value of property asking prices as a leading indicator for housing markets is quite significant.
In fact it's more valuable than median prices which can be quite misleading.
Let's delve into why this is the case and how it impacts the real estate market.
- Early Market Sentiment Indicator: Asking prices often reflect the current sentiment of sellers in the real estate market.
If sellers are confident, they might set higher asking prices, anticipating strong demand.
Conversely, if sellers are uncertain or perceive a market downturn, they might lower their asking prices to attract buyers.
This makes asking prices a real-time indicator of market sentiment, often preceding changes in actual sales prices. - Predictive of Future Price Trends: Trends in asking prices can be predictive of where the actual property prices are headed.
For example, a consistent rise in asking prices over a period can signal an upcoming rise in transaction prices. - Impact of Economic Factors: Economic factors such as interest rates, employment rates, and broader economic health influence asking prices.
For instance, changes in the Reserve Bank of Australia's policies or shifts in the job market can quickly reflect in the asking prices, providing insights into how these factors are influencing the housing market. - Regional Variations: In a diverse market like Australia's, asking prices can also provide insights into regional disparities.
For instance, the property markets in Melbourne and Sydney might behave differently from those in Brisbane or Perth. Asking prices can give early indications of these regional trends. - Influence of Supply and Demand: Asking prices are also a response to the balance of supply and demand in the market.
In areas with limited supply and high demand, asking prices tend to be higher and vice versa.
However, it's important to note that while asking prices are a valuable indicator, they should not be used in isolation.
Other factors like actual sales prices, time on the market, auction clearance rates, and economic conditions also play crucial roles in understanding the property market dynamics.
READ MORE: The latest median property prices in Australia’s major cities
Last weekend's auction report
Highest weekly volume of auctions since mid-June
The volume of auctions held surpassed the 2,000 mark for the first time since the end of June, with 2,120 auctions held across the combined capitals last week.
- Also read:Latest Property Price Forecasts Revealed. Australian Property Market Outlook 2025–26: Where Prices Are Headed After Three Rate Cuts.

- Also read:This week’s Australian Property Market Update – Latest Data, State by State August 26th 2025

- Also read:Everything you need to know about the state of Australia’s property markets in 20 charts – August 2025

- Also read:Melbourne property market forecast for 2026 | Is it a good time to invest in Melbourne?

- Also read:Sydney property market forecast for 2026. Is it a good time to invest in Sydney?

This was the highest weekly volume of auctions held since the week ending June 15 (2,183).
Auction activity is set to rise further this week, with approximately 2,430 capital city homes scheduled to go under the hammer.
The preliminary clearance rate nudged slightly higher, rising to 75.3% last week, the highest early result since the first week of April 2024 (75.9%).
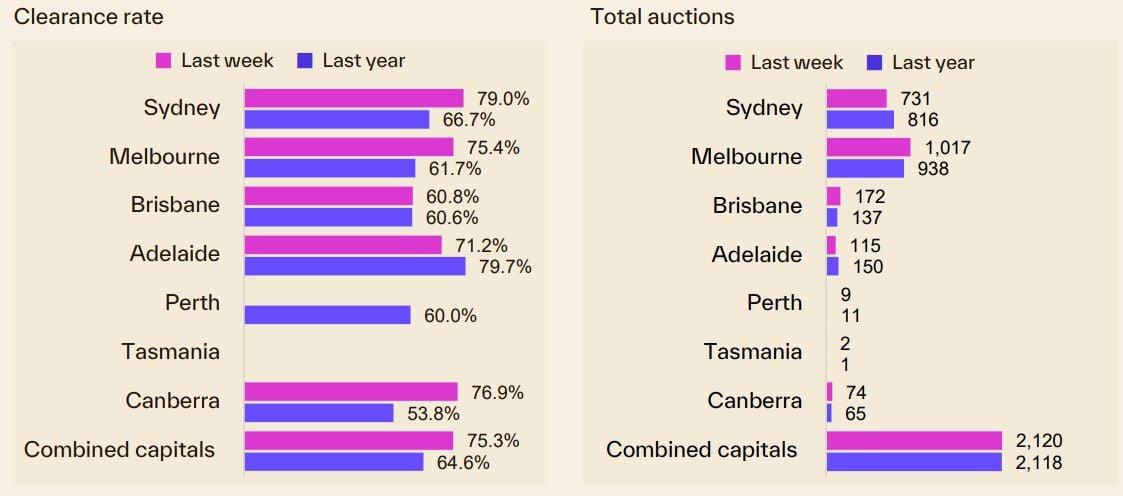
In Melbourne, 1,017 auctions were held last week; the highest volume of auctions since the week ending June 15 (1,018).
So far, 75.4% of auctions have reported a successful result, virtually on par with the previous week’s early result (75.5%) and the seventeenth consecutive week where the preliminary clearance rate has been above the 70% mark.
There were 731 auctions held in Sydney last week, up from 705 a week earlier and the highest volume since the last week of June (771).
79.0% of Sydney auctions have reported a successful result based on the preliminary numbers, the highest early result since the first week of April last year (81.6%).
Brisbane saw 172 auctions held last week, up from 136 the previous week, to be the highest volume in four weeks. The preliminary clearance rate has dipped across Brisbane, falling to 60.8%, the lowest in eleven weeks.
There were 115 auctions held in Adelaide last week, the largest volume since the week ending June 15 (121). 71.2% of auctions have reported a successful result so far, down from a preliminary result of 78.0% a week earlier.
The ACT hosted 74 auctions last week, up from 51 the week prior and the highest volume since the week ending June 15 (77).
76.9% of auctions have been reported as successful so far, down from 80.6% the previous week.
In Perth, seven of the nine auction results have been collected so far, all of which were successful, while the one auction result reported in Tasmania last week was passed in.
Our rental markets
According to Cotality, with rental vacancy rates holding close to historic lows,tracking at 1.7% nationally in July, there has been some evidence of reaccelerating growth trends.
On a seasonally adjusted basis, national rents were up 1.1% over the three months ending July, up from a recent low of 0.5% through the September quarter last year.
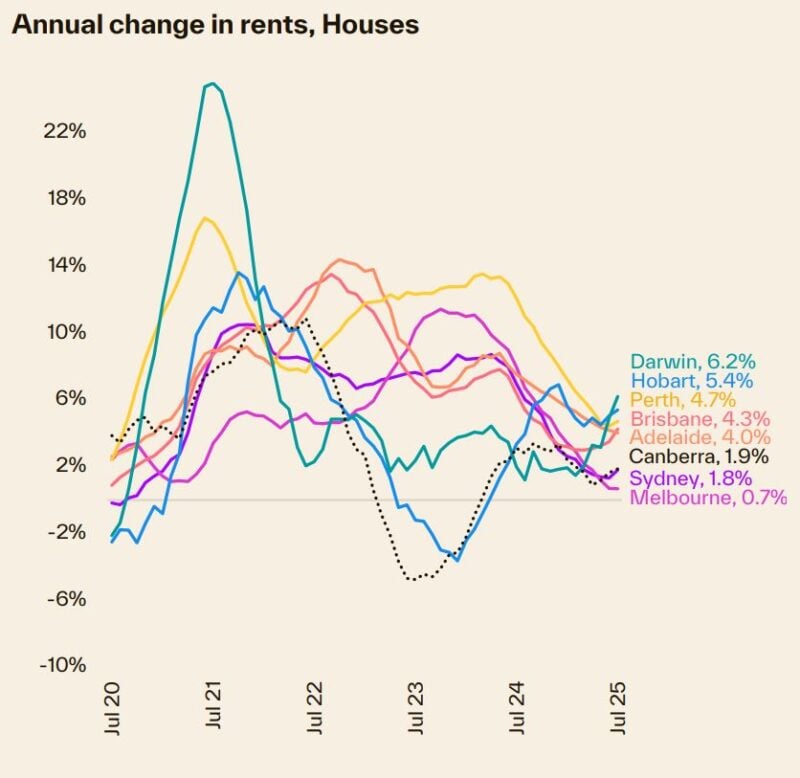
The unit sector has seen a stronger trend with seasonally adjusted rents up 1.3% over the past three months after dipping to a rolling quarterly change of just 0.5% through the end of last year.
However, growth in house rents has also picked up, rising to 1.1% after the three-month trend eased back to just 0.5% in Q3 last year.
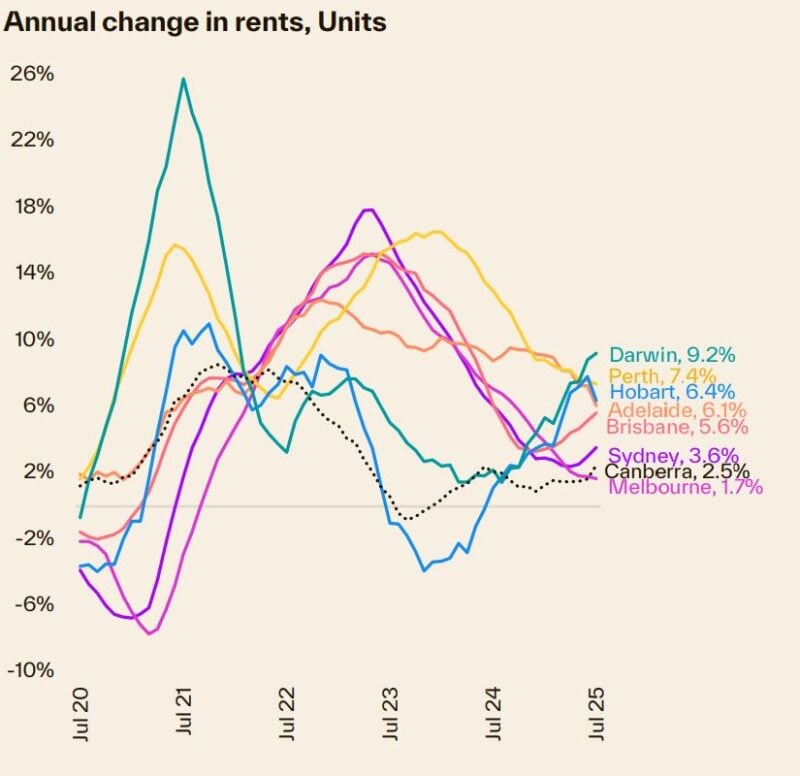
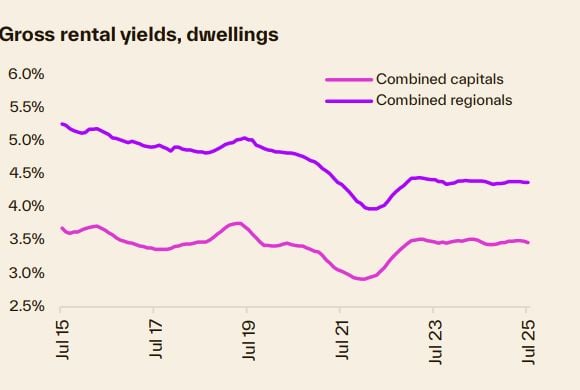
Although rental growth has picked up, gross rental yields edged lower in July, reducing to 3.68% nationally across all dwellings, down from 3.71% in April.
The highest capital city gross rental yields, by far, can be found in Darwin at 6.4%, a factor of relatively low purchase prices relative to rental income.
Sydney
| Property Type | Rent ($) | Weekly change | Monthly change | 12 Months change |
|---|---|---|---|---|
| All Houses | $1,083.95 | 7.05 | 1.2% | 5.6% |
| All Units | $711.87 | 1.13 | 1.0% | 2.8% |
| Combined | $862.76 | 3.53 | 1.1% | 4.2% |
Source: SQM Research
Melbourne
| Property Type | Rent ($) | Weekly change | Monthly change | 12 Months change |
|---|---|---|---|---|
| All Houses | $766.36 | -2.36 | -0.3% | 3.3% |
| All Units | $575.94 | 0.06 | 0.0% | 3.3% |
| Combined | $655.29 | -0.95 | -0.2% | 3.4% |
Source: SQM Research
Brisbane
| Property Type | Rent ($) | Weekly change | Monthly change | 12 Months change |
|---|---|---|---|---|
| All Houses | $771.40 | 4.60 | 0.9% | 6.0% |
| All Units | $613.23 | 1.77 | 1.2% | 7.0% |
| Combined | $700.19 | 3.33 | 1.1% | 6.4% |
Source: SQM Research
Perth
| Property Type | Rent ($) | Weekly change | Monthly change | 12 Months change |
|---|---|---|---|---|
| All Houses | $826.41 | -2.41 | -1.0% | 6.4% |
| All Units | $646.32 | 0.68 | -1.5% | 4.9% |
| Combined | $751.81 | -1.13 | -1.2% | 5.9% |
Source: SQM Research
Adelaide
| Property Type | Rent $) | Weekly change | Monthly change | 12 Months change |
|---|---|---|---|---|
| All Houses | $668.28 | 0.72 | -0.2% | 1.0% |
| All Units | $527.13 | -0.13 | 0.6% | 5.5% |
| Combined | $620.40 | 0.43 | 0.0% | 2.4% |
Source: SQM Research
Canberra
| Property Type | Rent ($) | Weekly change | Monthly change | 12 Months change |
|---|---|---|---|---|
| All Houses | $776.19 | 1.81 | 0.7% | -0.4% |
| All Units | $579.26 | -3.26 | -1.5% | 4.0% |
| Combined | $668.51 | -0.96 | -0.4% | 1.5% |
Source: SQM Research
Darwin
| Property Type | Rent ($) | Weekly change | Monthly change | 12 Months change |
|---|---|---|---|---|
| All Houses | $752.26 | 9.74 | -7.5% | 6.4% |
| All Units | $569.06 | 5.94 | 5.0% | 10.9% |
| Combined | $643.87 | 7.49 | -1.3% | 8.8% |
Source: SQM Research
Hobart
| Property Type | Rent 9$) | Weekly change | Monthly change | 12 Months change |
|---|---|---|---|---|
| All Houses | $575.15 | -8.15 | 0.8% | 7.4% |
| All Units | $504.16 | 1.84 | 2.6% | 10.6% |
| Combined | $546.81 | -4.16 | 1.5% | 8.6% |
Source: SQM Research
National
| Property Type | Rent ($) | Weekly change | Monthly change | 12 Months change |
|---|---|---|---|---|
| All Houses | $727.00 | 4.00 | 1.1% | 4.8% |
| All Units | $568.00 | -1.00 | 0.4% | 3.8% |
| Combined | $653.28 | 1.68 | 0.8% | 4.4% |
Source: SQM Research
Cap City Average
| Property Type | Rent ($) | Weekly change | Monthly change | 12 Months change |
|---|---|---|---|---|
| All Houses | $869.00 | 4.00 | 0.3% | 4.8% |
| All Units | $645.00 | 1.00 | 0.3% | 4.0% |
| Combined | $749.89 | 2.40 | 0.3% | 4.5% |
Source: SQM Research
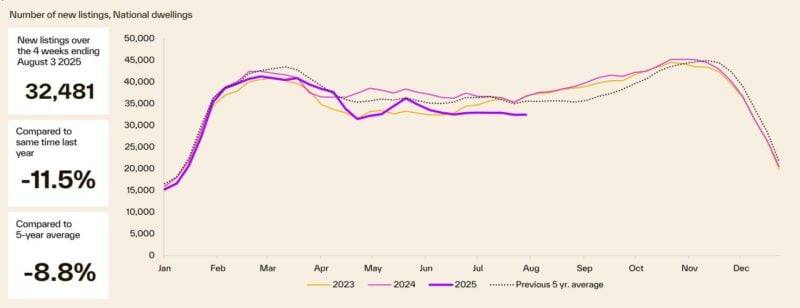
Sellers of good properties are on strike
The flow of newly advertised listings has continued to track well below average (-8.8%) through July, with just 32,481 newly listed properties nationally over the four weeks to August 3rd.
Although we typically see fewer new listings thought winter, current numbers are -11.5% below the levels seen this time last year and are roughly in line (-0.4%) with those seen in 2020 amid covid lockdowns and viewing restrictions.
With the flow of newly advertised listings holding well below average, total stock levels have continued to decline, with properties being absorbed faster than they are added to the market.
Over the four weeks to August 3rd, Cotality observed 121,113 total listings nationally, -9.5% below the counts seen this time last year and -19.4% lower than the average levels usually seen this time of year.
Vendor metrics
As the following chart shows, it's taking longer to sell a home.
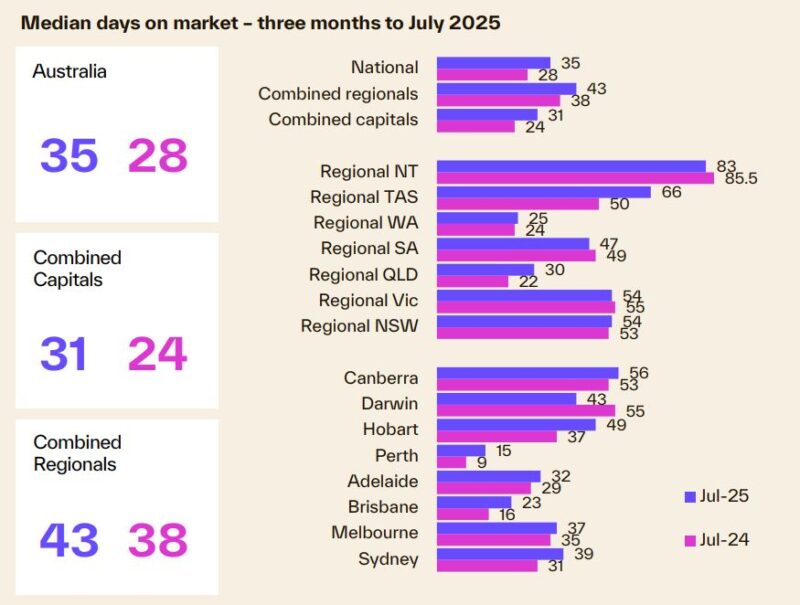
The national median time on market rose to 35 days over the three months to July after briefly dipping to 30 days over the three months to April.
Relative to this time last year, selling times have increased across all capitals except Darwin (43 days, down 12 days).
Hobart (49 days) saw the largest increase in median days on market, followed by Sydney (39 days) and Brisbane (23 days), up twelve, eight and seven days, respectively.