
Key takeaways
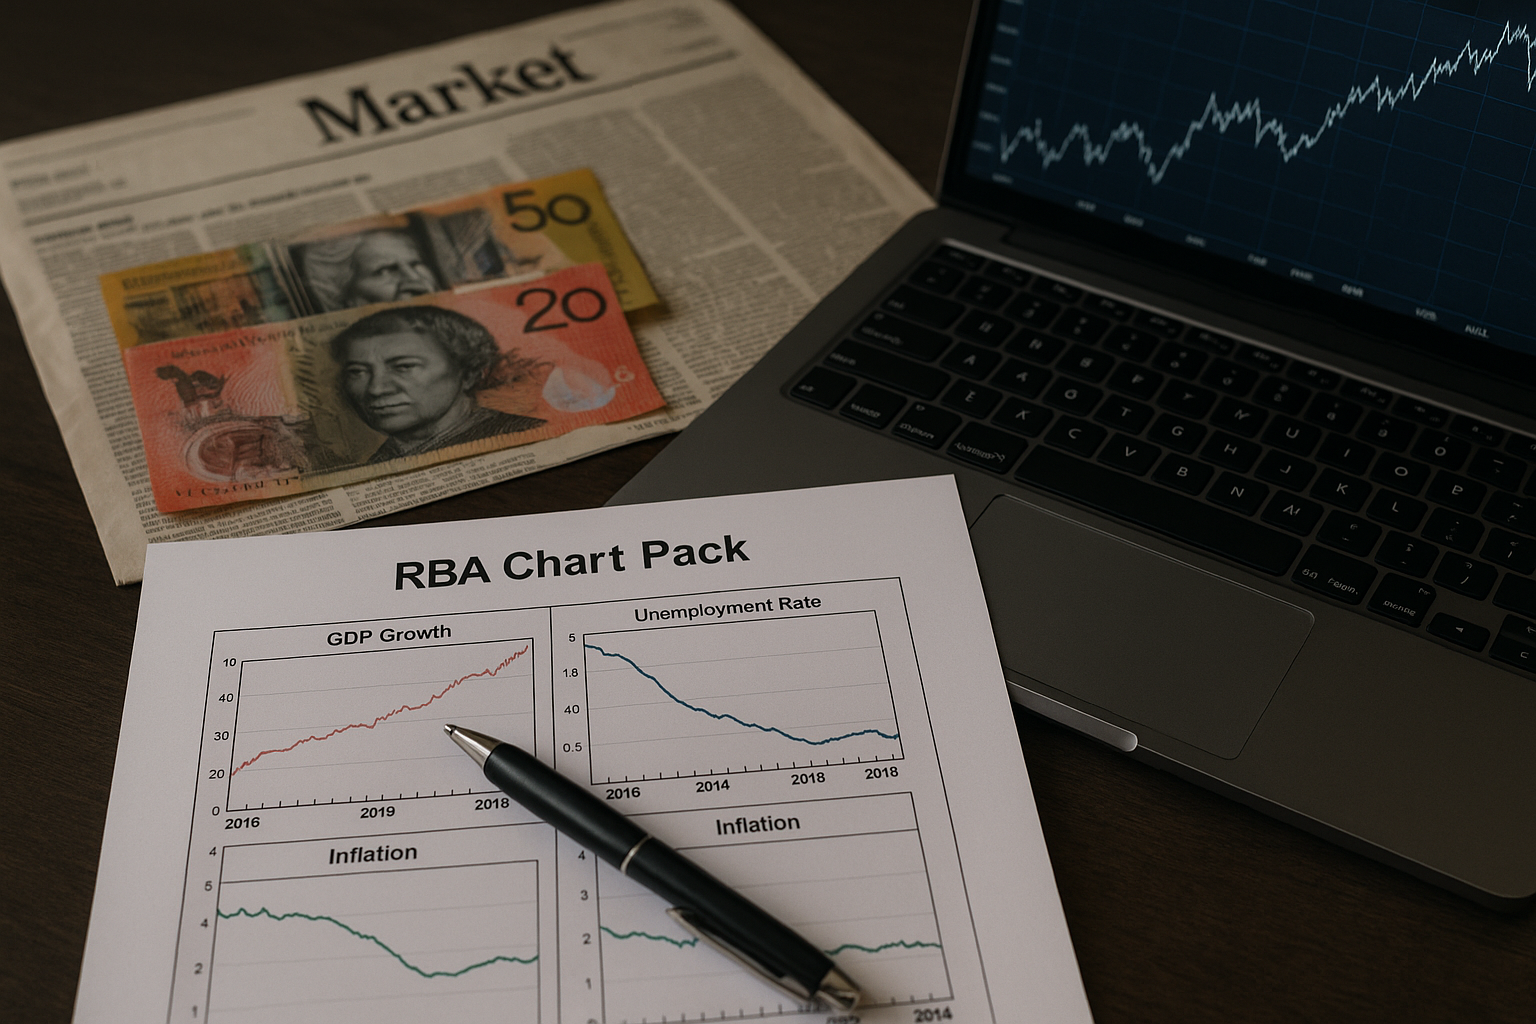
If a picture paints a thousand words, then this collection of charts should do a pretty good job of painting the landscape as it affects our economy and our property markets.
Australia's economy doesn't operate in isolation, so it's important to keep track of how the economies of our major trading partners are performing.
Despite concerns around the world about recessions, Australia's economy is still growing and creating jobs.
Inflation around the world has peaked and the latest stats show inflation in Australia is now coming under control allowing the RBA to cut interest rates in August.
It will be interesting to see what Trump's tariffs will do to the various economies around the world.
Despite high interest rates and inflation have eaten away at the average household budget, in general Aussies have significantly more equity in their homes than they had four years ago.
Australia's residential property market is valued at $11.4 trillion, yet only $2.4 trillion worth of debt is against this large asset base. In fact 50% of homeowners don't have a mortgage against their homes.
Currently, Australia has a significant shortfall of housing, and the cost of residential construction has risen substantially in the last few years. This means that most developments on the drawing board are not currently financially viable to get out of the ground.
Consumer confidence remains at low levels and is likely to remain shaky due to all the geo political problems in the world.
The unemployment rate is still low at 4.2%, meaning Australians can feel secure about their financial futures.
The labour force participation rate is an estimate of an economy's active workforce. The participation rate has increased over the last few years, and there are currently over 329,000 jobs advertised, but nobody to fill them.
If a picture paints a thousand words, then this collection of charts should do a pretty good job of painting the landscape as it affects our economy and our property markets.
Each month the RBA summarises macroeconomic and financial market trends in Australia by providing a detailed chart pack.
World Economy
- Australia's economy doesn't operate in isolation, so it's critical to keep track of how the economies of our major trading partners are performing.
-
Global ecomomic growth remains subdued, with major economies like the US and EU experiencing slower momentum due to high interest rates, persistent inflation, and tighter credit conditions and worries about Trump's tariffs.
-
The US economy is slowing, the latest jobs growth points to a US economy that may be slowing with Goldman Sachs forecasting growth to be just 1% in the final two quarters, due in part to slower consumer spending and a sharp slowdown in income growth, reflecting weaker jobs growth.
-
Inflation pressures are easing, and is projected to be back to central bank targets in most G20 economies by the end of 2025.

Source: AMP
-
After one of the most aggressive global tightening cycles in decades, interest rates have peaked in many parts of the world. Central banks across advanced economies had pushed rates sharply higher through 2022 and 2023 in a coordinated attempt to tame post-pandemic inflation. As a result, policy rates in the US, UK, Europe, and Australia all reached levels not seen in over a decade. However, in recent months, the narrative has shifted. Inflation is trending lower -albeit stubbornly - and growth is softening, prompting several central banks to signal that the hiking cycle is over.
- China’s recovery remains patchy, despite stimulus measures; its property crisis and demographic headwinds continue to weigh on consumer confidence and growth projections and of course it is experiencing the challenges of Trump's tariffs.
- Geopolitical risks remain elevated, particularly with conflicts in Eastern Europe and the Middle East, and increasing trade tensions between the US and China - adding uncertainty to global supply chains and investment flows.
- The International Monetary Fund (IMF) recently published its latest update on the state of the world economy. Global growth is projected at 3.0 percent for 2025 and 3.1 percent in 2026, an upward revision from the April 2025 World Economic Outlook. This reflects front-loading ahead of tariffs, lower effective tariff rates, better financial conditions, and fiscal expansion in some major jurisdictions. Global inflation is expected to fall, but US inflation is predicted to stay above target. Downside risks from potentially higher tariffs, elevated uncertainty, and geopolitical tensions persist.
- Global headline inflation is expected to decline to 4.2 percent in 2025 and to 3.5 percent in 2026, converging back to target earlier in advanced economies than in emerging market and developing economies.
Australia's Economy
- The Australian economy is still growing—but only just. Annual GDP growth has slowed to a crawl, hovering around 1.4%, well below the long-term average of 2–3%. The combination of elevated interest rates, cost-of-living pressures, and weak consumer sentiment is clearly taking a toll on household spending and business investment.
- And while we’ve technically avoided a recession, we are experiencing a “per capita recession.” That is, the economy might be growing in total terms thanks to strong population growth, but when you break it down per person, most Aussies are actually going backwards financially.
- Household consumption is weak, with discretionary spending slowing significantly. Consumers are reining in their spending as mortgage repayments eat into disposable income and inflation continues to pinch household budgets.
- Population growth is the main driver of GDP. Australia’s record net overseas migration has kept aggregate demand growing and helped prop up total GDP figures, but it also masks underlying economic softness.
- Business investment has softened, particularly among smaller enterprises, many of which are still grappling with the cost of capital and supply chain issues.
- Government spending remains a key support, especially via infrastructure projects at the state level. However, fiscal support is expected to moderate, meaning the private sector needs to step up—but it’s showing little appetite to do so yet.
- Exports are holding up, thanks to solid demand for commodities like iron ore and LNG—though this is increasingly reliant on a fragile China and could be vulnerable to a further slowdown in our largest trading partner.
- Confidence is fragile, both among consumers and businesses. NAB’s business conditions index remains positive but is trending lower, and consumer confidence remains stuck in pessimistic territory, a clear sign of ongoing household stress.
- Economic growth will likely remain subdued through the rest of 2025, with the RBA forecasting sub-trend growth and unemployment ticking slightly higher.
- In trend terms, in June 2025:
- unemployment rate increased to 4.2%.
- participation rate remained at 67.0%.
- employment increased to 14,637,800.
- employment to population ratio remained at 64.2%.
- underemployment rate remained at 5.9%.
- monthly hours worked increased to 1,976 million.
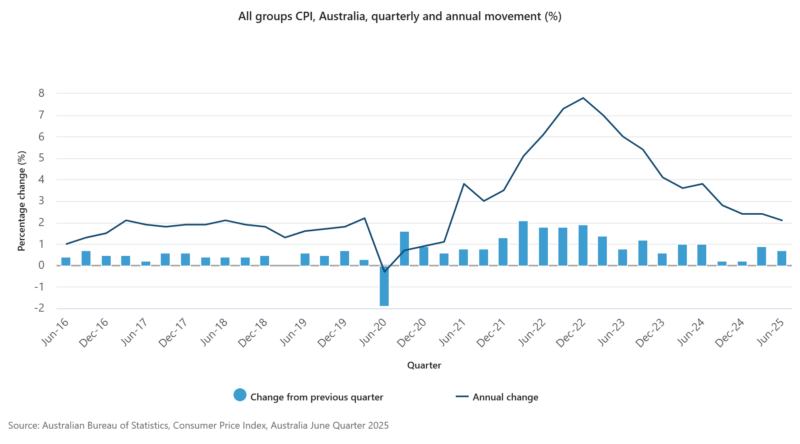
- The Consumer Price Index (CPI) rose 0.7% in June quarter.
- Over the twelve months to the June 2025 quarter, the CPI rose 2.1%.
- The most significant price rises this quarter were Housing (+1.2%), Food and non-alcoholic beverages (+1.0%) and Health (+1.5%).
- Partially offsetting the rise was Transport (-0.7%).
Household Sector
- The following chart shows how the disposable income for Aussie households has dropped over the last year as they have grappled with rising costs, yet it has picked up recently.
- Despite the Reserve Bank's best efforts to slow down household spending, we’re still spending up big on discretionary items such as clothes, restaurants, and lifestyle, defying cost of living pressures.
- According to the ABS: in June:
- Household spending rose 0.5% month-on-month on a current price, seasonally adjusted basis.
- In seasonally adjusted, current price terms household spending increased for six of the nine spending categories. The largest increases were in:
- furnishings and household equipment (+2.0%)
- clothing and footwear (+1.6%)
- food (+1.5%).
- In seasonally adjusted, current price terms, household spending on goods rose 1.3% month-on-month, driven by increased spending on food, purchase of vehicles, and goods for recreation and culture.
- In seasonally adjusted, current price terms, household spending increased for seven of the eight states and territories. The strongest increases were in:
- Northern Territory (+1.3%)
- New South Wales (+1.1%).
This chart also shows our savings ratio has dropped to below pre-pandemic levels as we kept spending our stashed cash to support our lifestyles but this is rising slowly again.
- I keep careful track of consumer confidence because it's a good leading indicator of what's ahead for our economy and property markets.
- The media's continual barrage of negative news about the economy, inflation and interest rates is having a significant impact on consumer sentiment.
- Lately, consumer confidence has been bouncing up from historically low levels
- I see consumer confidence rising moving forward as Aussies realise inflation has peaked and that interest rates will keep falling.
- While rising interest rates and inflation have eaten away at the average household budget, in general, Aussies have significantly more equity in their homes than they had before the pandemic, and they started the recent rising interest rate cycle with considerably more savings stashed in their savings or offset accounts than they had at the beginning the pandemic.
- The following chart shows our net wealth position, and that our main assets are in real estate (particularly our homes) and financial assets (including our superannuation.)
- As you can see, the net wealth position of Australian households is still high since asset growth has outpaced the increased debt levels, meaning our net wealth position, while falling a little lately, is very strong.
- The Australian residential property market is valued at over $11.4 trillion, yet there is only around $2.4 trillion worth of debt against this large asset base. In fact, 50% of homeowners don't have a mortgage against their homes.
- Also read:Sydney property market forecast for 2026 and 2027 | Why the short-term softness is a long-term opportunity

- Also read:Everything you need to know about the state of Australia’s property markets in 20 charts – April 2026

- Also read:Melbourne property market forecast for 2026 & 2027 | Why the opportunity is bigger than it looks

- Also read:Latest Property Price Forecasts Revealed. Australian Property Market Outlook 2026: Where To Now After The Rate Rise.

- Also read:Brisbane Property Market Forecast [2026] – What’s Ahead & Where to Invest

- Australian property values reached new heights in June, reversing a recent short downward trend earlier in the year. And with the further interest rate cuts on the horizon, I expect our property values to keep rising as buyers return.
- Currently, Australia has a shortfall of housing, which is particularly showing up in our rental markets with historically low vacancy rates and skyrocketing rents.
- The government has a plan to build 1.2 million homes in the next 5 years, but I can't see how this will be achieved.
- The cost of residential construction has risen substantially in the last few years, in part because of the lack of available skilled labour and supply chain restrictions.
- This means the cost to build new apartments has risen to such an extent that most developments on the drawing board (see the following chart of dwelling approvals) are not currently financially viable and won’t be built until the market is prepared to pay substantially more than the current prices.
- It has been estimated that currently we have a deficit of well over 200,000 properties, something that won't be made up any time soon.
- In other words... there is no end in sight for the undersupply of dwellings. It also means that there is substantial inbuilt equity in established properties as their replacement cost is very much higher than their current market value.
While the property pessimists were making a fuss about low housing loan commitments, which are clearly a leading indicator of what's ahead for our property markets, the following chart shows that they have picked up recently and are well above long-term averages.
In particular, investor lending is up over 30% in the last 12 months. In other words, strategic investors are taking advantage of the current window of opportunity to get into the housing market.
Business Sector
- Australian businesses are facing a continual conveyer belt of challenges, including the rising cost of living which is dampening discretionary spending as the RBA is hell-bent on slowing our economy.
- The near-term business outlook is one of softening consumption and investment growth, tightening government expenditures, and high debt costs.
- This troubled backdrop has been reflected in low business investment, which now seems to be picking up.
Labour Markets
- Australia's labour market continues to show impressive resilience in the face of high-interest rates and unprecedented global challenges.
- The ABS has reported the following Key Statistics
-
-
In trend terms, in June 2025:
- unemployment rate increased to 4.2%.
- participation rate remained at 67.0%.
- employment increased to 14,637,800.
- employment to population ratio remained at 64.2%.
- underemployment rate remained at 5.9%.
- monthly hours worked increased to 1,976 million.
-
- Australia's unemployment rate, a key indicator of labour market health, has been at very low levels for a number of months now.
- The labour force participation rate is an estimate of an economy’s active workforce. The formula is the number of people ages 16 and older who are employed or actively seeking employment, divided by the total non-institutionalized, civilian working-age population.
- The participation rate in Australia averaged 63.51% from 1978 until 2022, as you can see from the chart below the participation rate has increased over the last few years as a bigger percentage of Australians have entered or re-entered the workforce.
- As you can see from the chart below, service-related industries have had significant growth, and in particular, there has been strong growth in the healthcare, accommodation and food services industries.
- Currently, there are 339,400 jobs advertised an increase of 2.9% from February 2025..
- Private sector vacancies were 301,900, an increase of 3.2% from February 2025.
- Public sector vacancies were 37,500, an increase of 0.6% from February 2025.
- While national average wages have underperformed inflation over the last couple of years, meaning that “real” wages have actually fallen, we are now experiencing moderate wage increases.
- Recently the Fair Works Ombudsman increased the minimum award wage.
Interest Rates
- Interest rate levels set by the RBA respond to changes in inflation. When rates rise, they slow economic growth and discourage borrowing, typically signalling a strong economy. On the other hand, low interest rates promote economic growth.
- The RBA cut rates for the third time this cycle in August after disappointing mortgage holders by keeping rates steady in July. Financial markets think there will be at least another two rate cuts this cycle. .
- Despite the sharp rise in interest rates over the last few years, home loan arrears remain at post-GFC lows, defying those property pessimists who forecast that significant levels of mortgage stress would lead to forced sales by homeowners who got over their heads in debt.