


Key takeaways
Australian housing market profitability reached a 20-year high in the September 2025 quarter, with 95.5% of resales making a profit and the median gain hitting a record $335,000.
Houses significantly outperformed units, and Brisbane led all capital cities with a 99.8% profitability rate and the highest median gain of $444,000, while regional markets continued to show stronger profit rates than combined capitals.
Looking ahead, profitability may soften in 2026 due to potential interest rate increases and weakening market conditions, particularly in higher-value segments.
Australian residential property sellers enjoyed their highest rate of profitability in over two decades during the September 2025 quarter, according to Cotality's latest Pain & Gain report.
The analysis, which covered approximately 100,000 resales, shows that 95.5% of sellers made a nominal profit, up from 94.9% in the June quarter, marking the strongest result since July 2005.
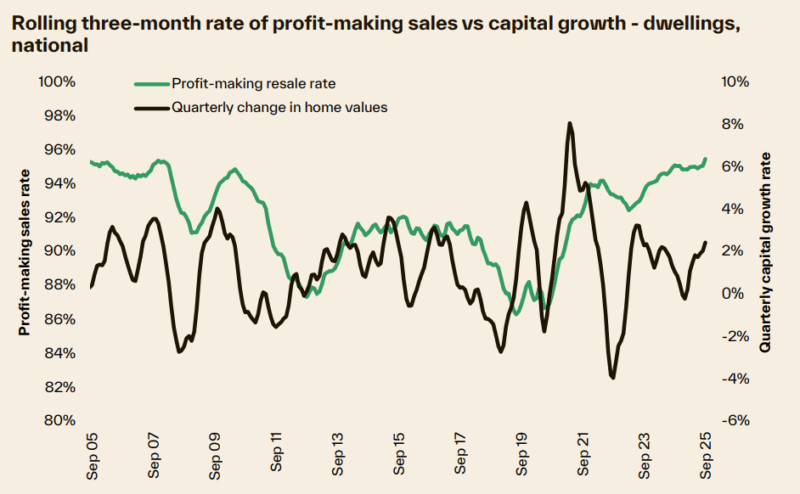
The surge in profitability was underpinned by a revitalised housing market, where national home values set new record highs for eight consecutive months leading up to the end of September 2025.
The median nominal gain from resale soared to a fresh record high of $335,000, surpassing the previous high of $325,600 in the December quarter of 2021.
The increase in profitability was strongly correlated with rising market values throughout 2025, driven partly by improved credit conditions after cash rate cuts earlier in the year.
In 2026, the path for profitability is less certain because of the changed outlook for interest rates, which will be an issue for recent home buyers in particular.
Key insights from the September 2025 quarter
- Median profit hits new high: The median nominal gain of $335,000 is the largest resale gain on record, even when adjusted for inflation to surpass the December 2021 peak.
- Melbourne unit losses ease: Loss-making unit resales in Melbourne fell by 13.5% (approximately 200 fewer cases) over the quarter, reflecting a strong turnaround. However, Melbourne units still accounted for the largest national share of loss-making sales at 29.1%.
- Houses outperform units: Houses remained significantly more profitable, with 97.9% of house resales turning a profit, compared to 90.6% for units. Units, despite making up only a third of resale activity, accounted for 68.9% of all loss-making sales.
- Brisbane leads the capitals: Brisbane was the most profitable market for the fourth consecutive quarter, with 99.8% of resales making a nominal gain, a new series high for the city. Brisbane sellers also saw the highest median nominal gain of the capitals, reaching $444,000 across all houses and units.
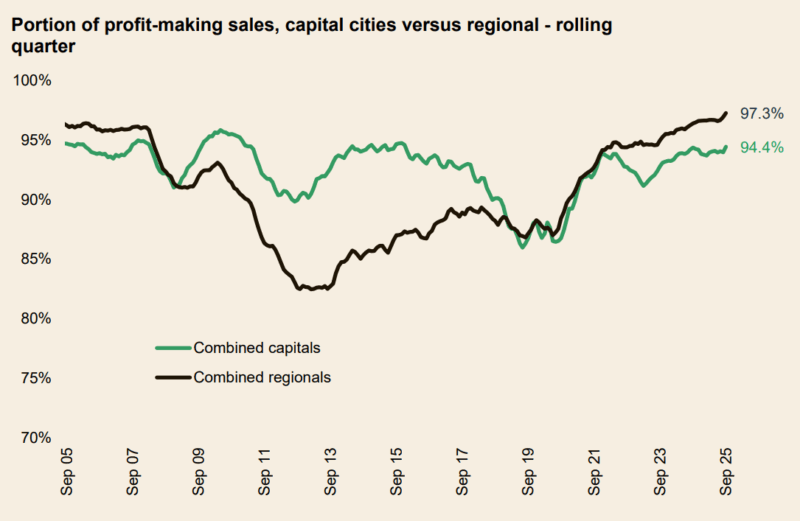
- Regional markets maintain lead: Regional Australia continued to post a higher rate of profitability (97.3%) than the combined capital cities (94.4%).
Regional and capital city performance
Regional Australia has maintained a higher rate of profitability than the combined capitals for over five years, since June 2020.
- Also read:National Weekly Auction Report – June 13th 2026 | Auction Clearance Rates Modest but Reasonably Steady Despite Listings Surge

- Also read:Latest Property Price Forecasts. Australian Property Market Outlook 2026: Where To Now After The Rate Rise & Budget Changes.

- Also read:Australia’s Rental Crisis Is Getting Worse – And the “Solutions” May Be Making It Worse | Property Insiders

- Also read:Supply Surges, Asking Prices Stall as Housing Market Reaches Turning Point | Latest SQM Listing Data
- Also read:Home Prices Now Falling Following Rate Rises | Latest stats from Dr. Andrew Wilson

Despite this higher chance of a profit-making sale, the dollar-value nominal gains are lower, with the median regional gain at $290,000, below the $370,000 gain in the combined capital city market.
Across the capital cities:
- Brisbane led in both the rate of profitability (99.8%) and the median nominal gain from resale ($444,000), and a record 99.9% of units made a gain from resale across Greater Brisbane in the quarter.
- Adelaide was a close second for profitability, with 99.3% of sales returning a nominal gain, and the second-highest median nominal gain at $407,500.
- Perth recorded the third-highest rate of profit-making sales of the capital cities, at 98.2% profitability rate.
- Darwin had the highest rate of loss-making sales (17.2%), but this was also the ‘most improved’ market for profits over the year to September, with the loss-making sales rate falling almost 14 percentage points.
- Melbourne had the second-highest rate of loss across the capital city markets, at 9.3% of resales in the September quarter, down from 10.6% in the June quarter of 2025 and 11.3% in the March quarter.
- Sydney saw the next-highest rate of loss-making sales at 7.5%, although it continued to lead nominal gains for houses, at $675,000.
- Hobart saw the biggest jump in the rate of loss-making sales across the capitals over the year to 5.7%, up from 5.1% a year ago.
- In Canberra, the rate of profit-making sales was 93.5%, up from 93.1% in the previous quarter. This coincided with a 1.5% quarterly lift in home values.
Hold periods and future outlook
The median hold period for all resales rose to 9.0 years in the quarter, slightly higher than the 8.2 years for loss-making resales.
Short selling times can increase the risk of making a loss, but the recent rise in profitability across most regions suggests a greater level of stability is returning to the market.
Looking ahead to 2026, the path for profitability is less certain due to emerging risks of a cash rate increase following a re-acceleration in inflation.
Weakening market conditions, as seen by the capital city clearance rate dipping below 60% at the end of 2025, often coincide with slowing rates of profitability.
We are now seeing some higher-value segments in Sydney already moving into decline, which could test the resilience of profitability for short-term sellers in the year ahead.


