

Key takeaways
Australia’s property markets have entered a more cautious phase, with higher interest rates, reduced borrowing capacity and policy uncertainty affecting buyer confidence.
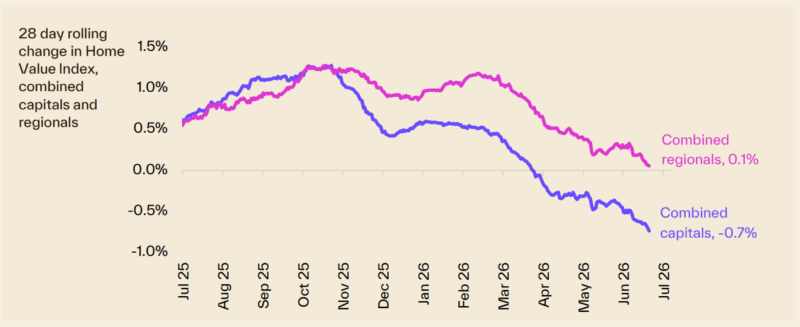
Capital city dwelling values declined by 0.7% over the past month, although they remain 5.7% higher than a year ago, confirming that this is a market slowdown rather than a broad-based collapse.
Sydney and Melbourne continue to experience the greatest price pressure, while Perth, Brisbane and Adelaide remain significantly higher than a year ago, despite momentum easing in some segments.
Auction conditions improved over the past week, with the combined capital city preliminary clearance rate rising to a seven-week high of 54.8%. However, auction volumes were lower, suggesting buyers remain selective rather than broadly confident.
Australia’s rental markets continue to favour property investors, with national rents rising 5.9% over the past financial year and gross rental yields gradually improving.
More properties are being listed for sale as buyer demand slows, giving purchasers greater choice and more negotiating power than they had earlier in the property cycle.
This increasingly fragmented market will reward careful property selection. Investors need to focus on locations with strong household incomes, limited supply and sustained owner-occupier demand rather than relying on general market growth.
Well, winter has well and truly settled over our property markets, and I don't just mean the weather.
The Reserve Bank left the cash rate on hold at 4.35% at its June meeting and won't sit down again until August 11, which gives borrowers a bit of breathing room. But nobody should read that as the end of the story.
Inflation is still running hotter than the RBA would like under the surface. Headline inflation eased slightly in May, but the trimmed mean, which strips out the noisy month to month swings, actually accelerated to 3.6%, well above the Bank's target range.
So while we've had a pause, the Board has been upfront that another rate rise remains firmly on the table if the numbers don't improve.
Meanwhile our auction markets have just been through one of their weakest winters in years. Clearance rates spent six consecutive weeks stuck below 50%, before bouncing back to 54.8% last week, the best result in seven weeks.
Cotality's national Home Value Index confirmed what the auction data has been hinting at, with dwelling values falling 0.4% in June, the steepest monthly drop in three and a half years.
Sydney and Melbourne have carried most of that weakness, with both markets now sitting well below the cyclical highs they reached late last year.
Yet despite all that, our overall dwelling values are still 7.3% higher than they were 12 months ago, which tells you this is a cooling market rather than a collapsing one.
And once again, the fragmented nature of our property landscape is on full display. While Sydney and Melbourne have been losing ground, Perth, Brisbane, Adelaide and Darwin have kept recording solid monthly and annual growth, supported by stronger population growth, tighter supply and more forgiving affordability.
Adding to the caution in our two largest cities is the federal government's move to phase out negative gearing on established properties, which is already starting to filter into buyer sentiment well ahead of the changes taking effect next year.
Rental markets remain the one part of this story that hasn't changed. Vacancy rates are still sitting near record lows, and rents keep climbing, which continues to support investors even while capital growth takes a breather.
To my mind, none of this changes the long-term fundamentals that have always underpinned Australian property.
We still have chronic undersupply, strong population growth and a shrinking pipeline of new dwellings, and those forces don't disappear just because sentiment has turned cautious for a season.
What has changed is that this has become a market where the quality of the individual asset matters more than the general direction of the headlines, and that's exactly the environment where a strategic, long-term approach to property selection pays off.
On the auction front this week... Auction clearance rates reach a seven-week high as auction volumes decline
Auction activity declined last week, with the number of auctions falling by 8.7% to 1,318, which was also 8.0% lower than the corresponding week a year ago.
The combined capitals preliminary clearance rate rose to 54.8%, the highest in seven weeks and the first time above 50% in three weeks, up from 49.8% the week before.
See Cotality's full auction report below.
This week, Cotality also reports that:
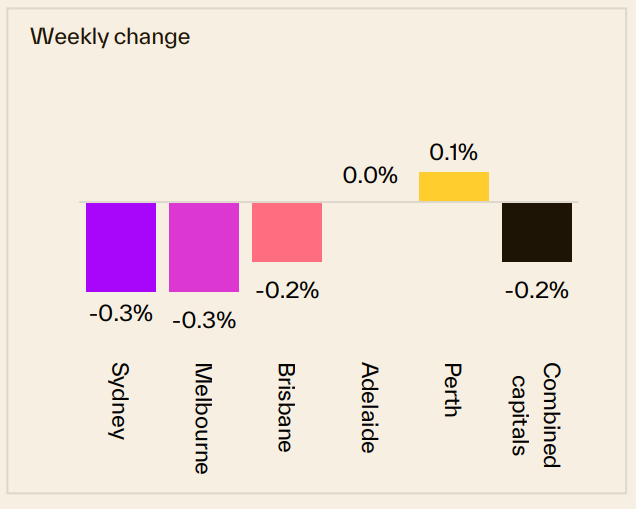
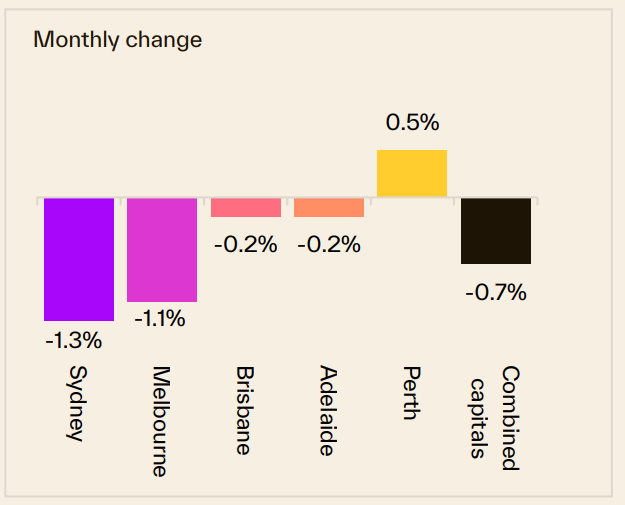
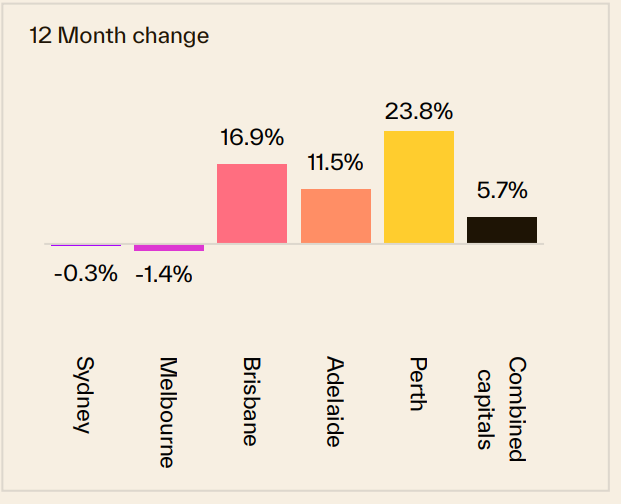
- Sydney property prices declined -0.3% over the last week, also declined -1.3% over the last month, and are -0.3% lower than they were 12 months ago.
- Melbourne property prices declined -0.3% over the last week, also declined -1.1% over the last month, are -1.4% lower compared to 12 months ago.
- Brisbane property prices declined -0.2% over the last week, also declined -0.2% over the last month and are 16.9% higher than they were 12 months ago.
Overall, Australian capital dwelling prices declined -0.7% over the last month and are now 5.7% higher than they were 12 months ago.
Clearly, the property cycle is moving on but our markets are very fragmented.
Source: Cotality July 13th 2026
Of course, these are "overall" figures - there is not one Sydney or Melbourne or Brisbane property market.
And various segments of each market are performing differently.
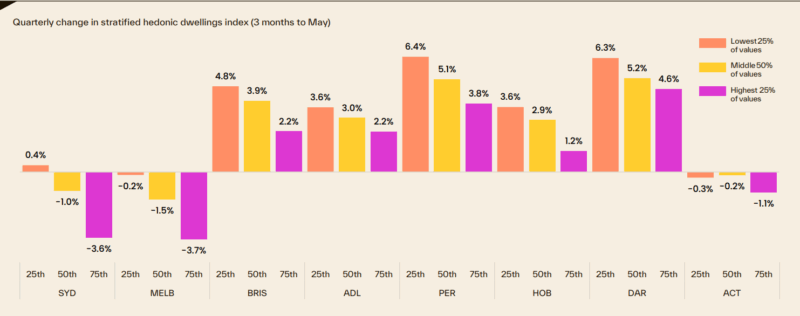
At the beginning of this cycle the upper quartile of the market lead the upswing but last year the lower quartile across every capital city recorded a stronger outcome for housing values relative to its upper quartile counterpart.
The following chart shows how various segments of each capital city market are performing differently, with median-priced properties performing well.
To help keep you up-to-date with all that's happening in property, here is my updated weekly analysis of data and charts as of 13th July 2026, provided by SQM Research, Cotality, and realestate.com.au.
Current property asking prices
Property asking prices are a useful leading indicator for housing markets - giving a good indication of what's ahead.
Here is the latest data available:
Sydney
| Property type | Price ($) | Weekly Change | Monthly Change % | Annual % change |
|---|---|---|---|---|
| All Houses | 2,053.288 | -15.909 | -3.1% | 0.9% |
| All Units | 896.190 | -3.790 | -3.2% | 5.5% |
| Combined | 1,580.031 | -11.061 | -3.1% | 1.8% |
Source: SQM Research
Melbourne
| Property type | Price ($) | Weekly Change | Monthly Change % | Annual % change |
|---|---|---|---|---|
| All Houses | 1,316.291 | -4.291 | -0.4% | 0.9% |
| All Units | 679.962 | -2.448 | -1.3% | 8.1% |
| Combined | 1,114.958 | -3.613 | -0.6% | 2.2% |
Source: SQM Research
Brisbane
| Property type | Price ($) | Weekly Change | Monthly Change % | Annual % change |
|---|---|---|---|---|
| All Houses | 1,393.603 | -3.203 | -1.0% | 11.2% |
| All Units | 870.319 | -4.869 | -2.1% | 18.8% |
| Combined | 1,260.964 | -3.744 | -1.2% | 12.4% |
Source: SQM Research
Perth
| Property type | Price ($) | Weekly Change | Monthly Change % | Annual % change |
|---|---|---|---|---|
| All Houses | 1,305.426 | 8.508 | 1.2% | 13.5% |
| All Units | 780.126 | -2.106 | -1.6% | 21.2% |
| Combined | 1,167.276 | 5.681 | 0.7 | 14.7% |
Source: SQM Research
Adelaide
| Property type | Price ($) | Weekly Change | Monthly Change % | Annual % change |
|---|---|---|---|---|
| All Houses | 1,138.245 | 4.545 | 0.4% | 7.2% |
| All Units | 641.029 | 16.771 | 2.5% | 14.3% |
| Combined | 1,048.560 | 6.713 | 0.6% | 7.9% |
Source: SQM Research
Canberra
| Property type | Price ($) | Weekly Change | Monthly Change % | Annual % change |
|---|---|---|---|---|
| All Houses | 1,269.111 | -7.874 | 0.6% | 4.8% |
| All Units | 608.251 | -3.001 | -0.6% | 2.0% |
| Combined | 1,017.297 | -6.416 | 0.3% | 3.6% |
Source: SQM Research
Darwin
| Property type | Price ($) | Weekly Change | Monthly Change % | Annual % change |
|---|---|---|---|---|
| All Houses | 849.259 | 1.741 | -0.7% | 9.3% |
| All Units | 473.447 | 2.803 | 1.8% | 14.4% |
| Combined | 701.425 | 2.168 | -0.1% | 10.5% |
Source: SQM Research
Hobart
| Property type | Price ($) | Weekly Change | Monthly Change % | Annual % change |
|---|---|---|---|---|
| All Houses | 931.102 | -0.739 | -0.7% | 10.6% |
| All Units | 557.860 | 4.840 | 1.1% | 12.1% |
| Combined | 873.882 | 0.090 | -0.5% | 10.7% |
Source: SQM Research
National
| Property type | Price ($) | Weekly Change | Monthly Change % | Annual % change |
|---|---|---|---|---|
| All Houses | 1,077.534 | 4.175 | -0.8% | 7.0% |
| All Units | 663.022 | 6.061 | -0.1% | 13.4% |
| Combined | 987.198 | 4.541 | -0.7% | 7.8% |
Source: SQM Research
Cap City Average
| Property type | Price ($) | Weekly Change | Monthly Change % | Annual % change |
|---|---|---|---|---|
| All Houses | 1,532.774 | -5.801 | -1.7% | 4.0% |
| All Units | 796.406 | 2.970 | -2.2% | 8.2% |
| Combined | 1,311.762 | -3.269 | -1.8% | 4.6% |
Source: SQM Research
The value of property asking prices as a leading indicator for housing markets is quite significant.
In fact it's more valuable than median prices which can be quite misleading.
Let's delve into why this is the case and how it impacts the real estate market.
- Early Market Sentiment Indicator: Asking prices often reflect the current sentiment of sellers in the real estate market.
If sellers are confident, they might set higher asking prices, anticipating strong demand.
Conversely, if sellers are uncertain or perceive a market downturn, they might lower their asking prices to attract buyers.
This makes asking prices a real-time indicator of market sentiment, often preceding changes in actual sales prices. - Predictive of Future Price Trends: Trends in asking prices can be predictive of where the actual property prices are headed.
For example, a consistent rise in asking prices over a period can signal an upcoming rise in transaction prices. - Impact of Economic Factors: Economic factors such as interest rates, employment rates, and broader economic health influence asking prices.
For instance, changes in the Reserve Bank of Australia's policies or shifts in the job market can quickly reflect in the asking prices, providing insights into how these factors are influencing the housing market. - Regional Variations: In a diverse market like Australia's, asking prices can also provide insights into regional disparities.
For instance, the property markets in Melbourne and Sydney might behave differently from those in Brisbane or Perth. Asking prices can give early indications of these regional trends. - Influence of Supply and Demand: Asking prices are also a response to the balance of supply and demand in the market.
In areas with limited supply and high demand, asking prices tend to be higher and vice versa.
However, it's important to note that while asking prices are a valuable indicator, they should not be used in isolation.
Other factors like actual sales prices, time on the market, auction clearance rates, and economic conditions also play crucial roles in understanding the property market dynamics.
- Also read:Brisbane Property Market Forecast [2026 & Beyond] – What The Olympics Decade Means for Investors.
- Also read:Sydney property market forecast for 2026 and 2027 | Why the short-term softness is a long-term opportunity

- Also read:Melbourne property market forecast for 2026 & 2027 | Separating the fundamentals from the sentiment

- Also read:Latest Property Price Forecasts. Australian Property Market Outlook 2026-2027: Navigating a Market Correction

- Also read:Everything you need to know about the state of Australia’s property markets in 20 charts – June 2026

READ MORE: The latest median property prices in Australia’s major cities
Last weekend's auction report
Auction clearance rates reach a seven-week high as auction volumes decline
Auction activity declined last week, with the number of auctions falling by 8.7% to 1,318, which was also 8.0% lower than the corresponding week a year ago.
The combined capitals preliminary clearance rate rose to 54.8%, the highest in seven weeks and the first time above 50% in three weeks, up from 49.8% the week before.
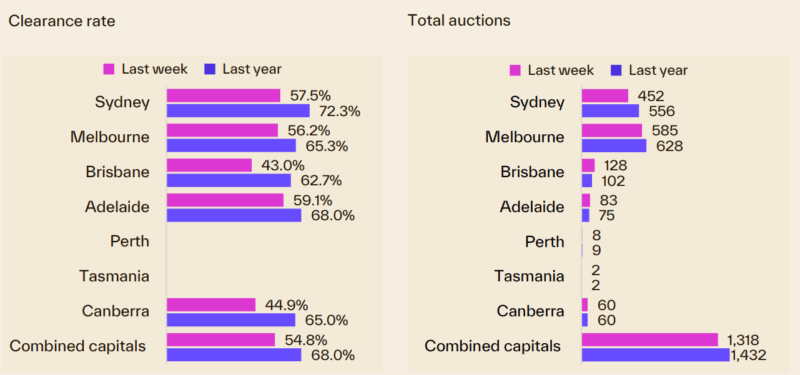
Across the combined capital cities, Melbourne accounted for the largest proportion of auction volume, with 585 homes brought to market.
While this represented a modest 0.3% increase on the week prior, it was 6.8% below its level a year earlier.
The preliminary clearance rate in Melbourne strengthened to 56.2%, up from 54.5% two weeks prior, representing the highest early result in four weeks.
Sydney saw the largest move in clearance rates, with the preliminary reading up to 57.5%.
That was its highest in ten weeks and well above the 47.3% low three weeks ago. That said volumes fell sharply to 452 auctions, down 18.7% both on the week and on a year ago.
Brisbane showed the most improvement among the mid-tier markets.
There were 128 auctions, up 7.6% from the previous week and 25.5% higher than a year ago. The preliminary clearance rate rose to 43.0%, up from a very weak 23.8% the week before.
Similarly, there was a sharp lift in Adelaide’s preliminary clearance rate, which rose to 59.1% from 45.7% a week earlier.
However, the auction volume fell 25.9% to 83.
Among the smaller capitals, Canberra held 60 auctions, down 4.8% from the previous week and unchanged from the same week last year, with a preliminary clearance rate of 44.9%.
Auction activity remained minimal in other regions, with eight auctions in Perth and two in Tasmania.
Our rental markets
Cotality’s national rental index rose half a per cent in seasonally adjusted terms (0.4% unadjusted) in June, on par with the 0.5% recorded in May, but slightly lower than the recent high point of 0.6% growth recorded in January.
Annual rental growth held at 5.9% nationally over the financial year, adding approximately $40/week to the median rent.
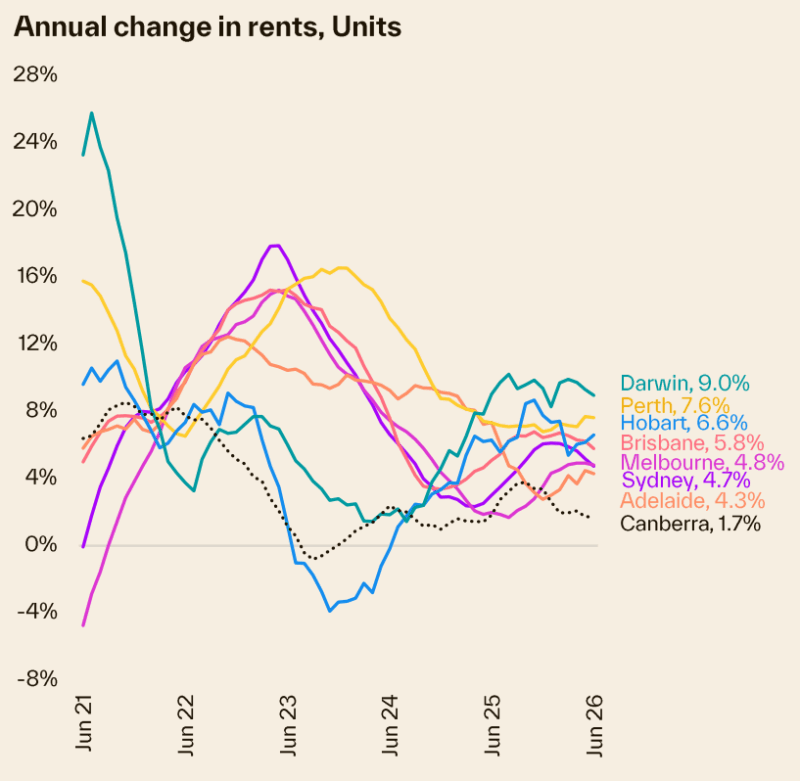
Across the broad regions of Australia, annual rental growth ranged from 10.1% in Darwin and regional Tasmania to 3.2% in the ACT and regional NT.
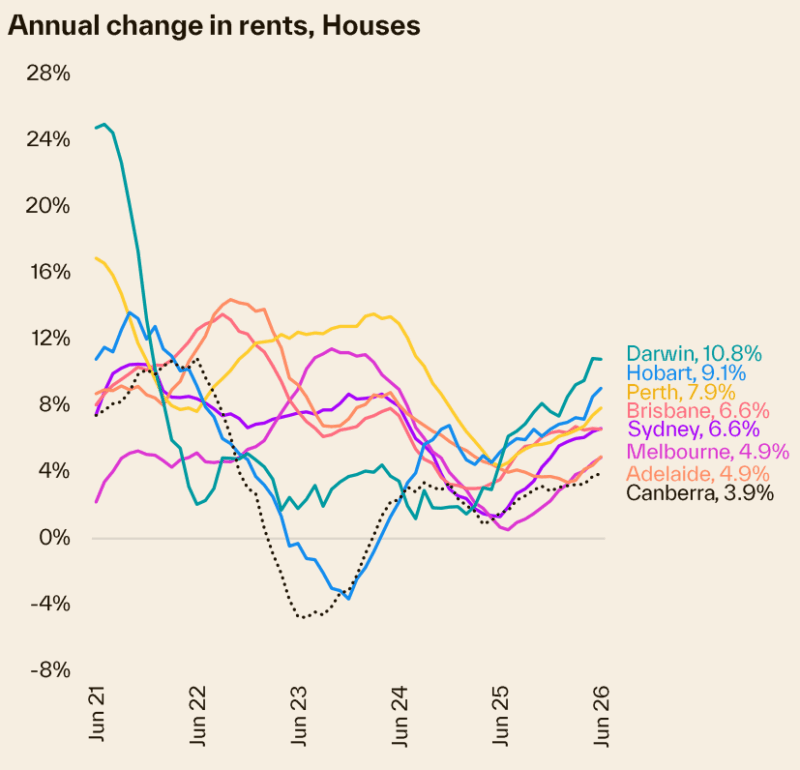
Capital city rents have risen by 41.7%, or $217 a week, over the past five years.
Sydney continues to record the most expensive rental rates, with a median of $883 a week for houses and $783 a week for units.
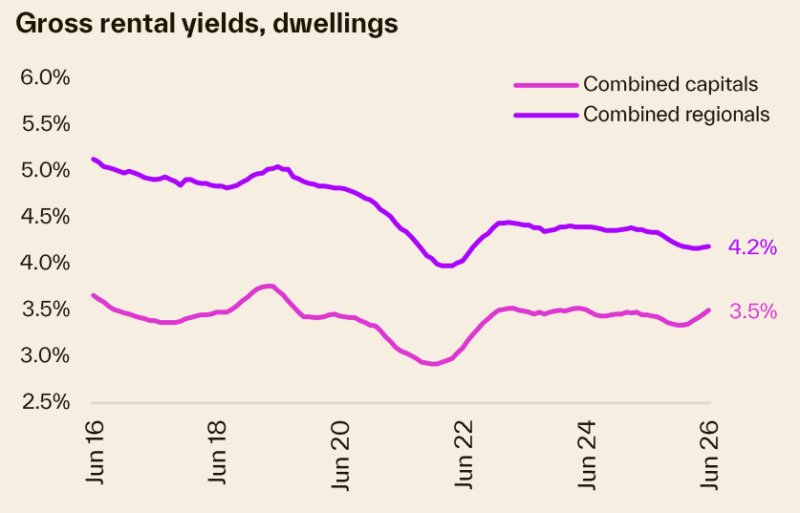
With rents rising faster than home values, we are seeing a gradual but consistent rise in gross rental yields.
Across the combined capitals, the gross rental yield is averaging 3.50%, up from a recent cyclical low of 3.34% in December last year and a record low of 2.92% in January 2022.
Sydney
| Property Type | Rent ($) | Weekly change | Monthly change | 12 Months change |
|---|---|---|---|---|
| All Houses | $1,149.81 | -9.82 | -0.5% | 7.4% |
| All Units | $757.53 | 0.47 | -0.4% | 7.8% |
| Combined | $916.73 | -3.71 | -0.4% | 7.6% |
Source: SQM Research
Melbourne
| Property Type | Rent ($) | Weekly change | Monthly change | 12 Months change |
|---|---|---|---|---|
| All Houses | $815.53 | 3.47 | -0.7% | 6.5% |
| All Units | $603.73 | -1.74 | 0.2% | 5.0% |
| Combined | $692.80 | 0.46 | -0.3% | 5.9% |
Source: SQM Research
Brisbane
| Property Type | Rent ($) | Weekly change | Monthly change | 12 Months change |
|---|---|---|---|---|
| All Houses | $840.90 | 1.11 | 1.2% | 10.4% |
| All Units | $643.99 | 0.01 | 0.6% | 7.1% |
| Combined | $752.16 | 0.61 | 1.0% | 9.1% |
Source: SQM Research
Perth
| Property Type | Rent ($) | Weekly change | Monthly change | 12 Months change |
|---|---|---|---|---|
| All Houses | $884.58 | -4.58 | -1.9% | 6.4% |
| All Units | $670.61 | -5.62 | -1.1% | 2.4% |
| Combined | $796.40 | -5.01 | -1.6% | 5.0% |
Source: SQM Research
Adelaide
| Property Type | Rent $) | Weekly change | Monthly change | 12 Months change |
|---|---|---|---|---|
| All Houses | $687.02 | -2.01 | 0.6% | 2.2% |
| All Units | $559.61 | 2.39 | 0.7% | 6.0% |
| Combined | $644.17 | -0.53 | 0.6% | 3.4% |
Source: SQM Research
Canberra
| Property Type | Rent ($) | Weekly change | Monthly change | 12 Months change |
|---|---|---|---|---|
| All Houses | $840.83 | -0.83 | 0.2% | 8.6% |
| All Units | $606.39 | 1.60 | 1.4% | 3.1% |
| Combined | $711.56 | 0.52 | 0.7% | 5.8% |
Source: SQM Research
Darwin
| Property Type | Rent ($) | Weekly change | Monthly change | 12 Months change |
|---|---|---|---|---|
| All Houses | $834.53 | -4.53 | -1.1% | 8.2% |
| All Units | $654.08 | 21.93 | 2.6% | 19.1% |
| Combined | $728.08 | 11.08 | 0.9% | 13.8% |
Source: SQM Research
Hobart
| Property Type | Rent 9$) | Weekly change | Monthly change | 12 Months change |
|---|---|---|---|---|
| All Houses | $627.70 | 1.31 | -0.2% | 9.8% |
| All Units | $576.80 | -11.79 | -1.9% | 16.0% |
| Combined | $607.44 | -3.91 | -0.9% | 12.1% |
Source: SQM Research
National
| Property Type | Rent ($) | Weekly change | Monthly change | 12 Months change |
|---|---|---|---|---|
| All Houses | $777.00 | 4.00 | -0.5% | 8.7% |
| All Units | $605.00 | 4.00 | -0.2% | 7.1% |
| Combined | $697.43 | 4.00 | -0.4% | 8.1% |
Source: SQM Research
Cap City Average
| Property Type | Rent ($) | Weekly change | Monthly change | 12 Months change |
|---|---|---|---|---|
| All Houses | $921.00 | -4.00 | -0.9% | 6.7% |
| All Units | $681.00 | 0.00 | -0.3% | 6.4% |
| Combined | $793.63 | -1.88 | -0.6% | 6.6% |
Source: SQM Research
Here's how many properties are for sale at the moment
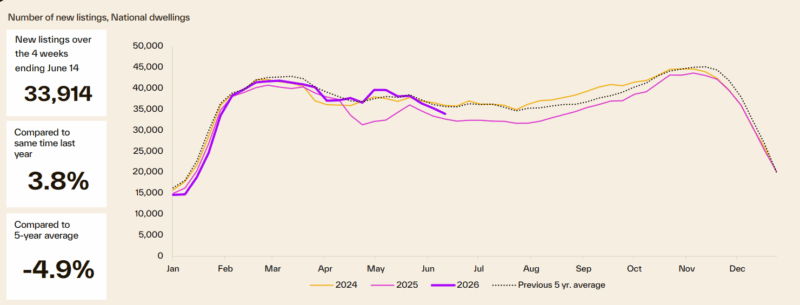
After tracking below last year and the five-year average for most of 2026, new listings increased through May to converge with seasonal norms, ending the period 3.8% above year-ago levels but still 4.9% below the five-year average.
Advertised stock levels are experiencing upward pressure as a steady rise in new listings coincides with a decline in consumer demand, leading to fewer home purchases.
Listings are only marginally ahead of last year and tracking 1.7% above the same time last year but remain 6.5% below the 5-year average.
Vendor metrics
Compared to a year ago, homes are selling faster.
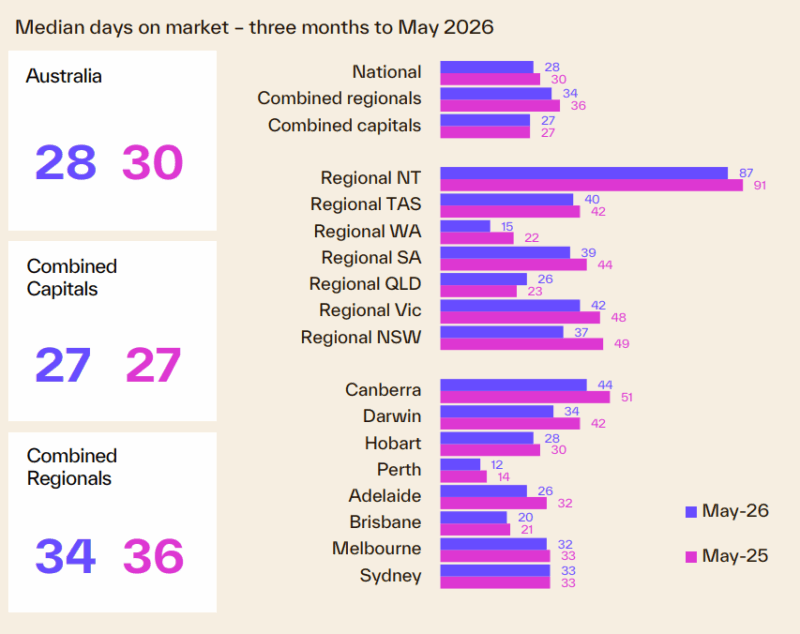
Nationwide, homes sold in a median of 28 days during the three months leading up to May 2026, a slight improvement from the 30-day median recorded in May 2025.
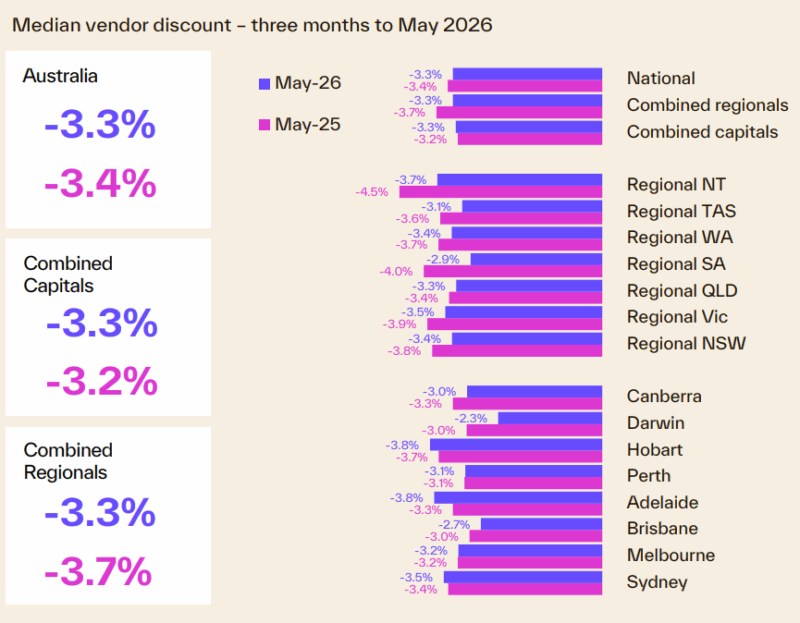
However, this momentum appears to be reducing as selling times have begun to rise in early 2026, a shift that suggests softening housing demand in the face uncertainty and macroeconomic pressures.