Key takeaways
The RBA kept interest rates on hold at its June meeting, leaving the cash rate at 4.35%, but borrowers should not assume the rate cycle is over.
Inflation remains the RBA’s main concern, and the Board made it clear that further rate rises are still possible if the data warrants it.
Auction markets softened again over the past week, with clearance rates now tracking around year-to-date lows in most capital cities.
The combined capital city preliminary auction clearance rate fell to 47.4%, its lowest reading since April 2020, showing buyer confidence has clearly weakened.
Sydney and Melbourne remain the softer major capital city markets, while Brisbane, Adelaide and Perth are still being supported by stronger medium-term fundamentals, although momentum is easing in some segments.
National dwelling values are not collapsing, but the market is clearly moving through a more cautious phase as higher rates, weaker sentiment and affordability constraints bite.
The rental market remains a strong support for investors, with tight vacancy rates and ongoing population growth keeping pressure on rents.
This is becoming a stock-picker’s market, where broad averages are becoming less useful and the right property in the right location matters more than ever.
Well, the RBA has now spoken, and for the first time this year borrowers received a little breathing space.
At its June meeting, the Reserve Bank kept the cash rate on hold at 4.35%, following three rate rises earlier this year.
That decision was widely expected, but it was not exactly a green light for borrowers or property buyers to relax.
The message from the RBA was clear enough: inflation is still too high, the economy is slowing, consumer spending is softening, and the housing market has lost some of its earlier momentum.
In other words, the Board has paused to see how the previous rate rises flow through the economy, but it has not ruled out doing more if inflation remains stubborn.
And that matters because confidence is a key ingredient in property markets.
Over the past week we have seen auction markets soften further, with the combined capital city preliminary clearance rate falling to 47.4%, its lowest level since April 2020. Clearance rates have now been below 60% for much of the past few months, and last week was the first time they slipped below 50% since the early pandemic period.
That tells us buyers are becoming more cautious, vendors are having to adjust their expectations, and the market is no longer being carried by the broad confidence we saw earlier in the cycle.
But this does not mean the property market is falling off a cliff.
As always, there is no single Australian property market. Sydney and Melbourne are clearly feeling the weight of higher borrowing costs and softer sentiment, while Perth remains the standout performer, and Brisbane and Adelaide are still showing resilience, even if their momentum is moderating.
The latest figures show Australian capital city dwelling values are now slightly lower over the month, but still well ahead of where they were a year ago. So this is not a crash, but it is a change in tempo.
To my mind, the market is entering a more selective phase. The easy gains are behind us for now, and investors will need to be more strategic than they have been over the last couple of years. Buying any property in a rising market is one thing, but buying an investment-grade asset that can outperform through a more cautious phase is something very different.
But the underlying fundamentals have not disappeared.
We still have a chronic undersupply of housing, strong population growth, tight rental markets, and construction costs that make it difficult to bring enough new dwellings to market. These factors will continue to underpin the value of well-located properties over the medium to long term.
However, in the short term, affordability constraints, higher interest rates, and uncertainty around future monetary policy are likely to keep many buyers cautious.
That is why I believe the best opportunities in this market will not come from following the headlines or chasing yesterday’s hotspots.
They will come from understanding where demand is deep, supply is constrained, household incomes are strong, and owner-occupiers want to live.
In markets like this, patience matters, but so does perspective.
On the auction front this week... Combined capitals preliminary clearance rate falls to 47.4%, lowest since April 2020
Across the combined capitals, the preliminary auction clearance rate fell to 47.4% last week, its lowest reading since the final week of April 2020.
The rate has held below 60% in ten of the past 12 weeks, but last week was the first time it fell under 50% since the early pandemic period.
See Cotality's full auction report below.
This week, Cotality also reports that:
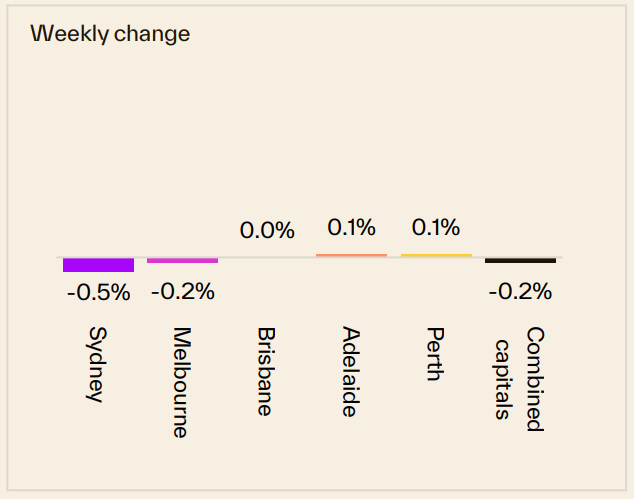
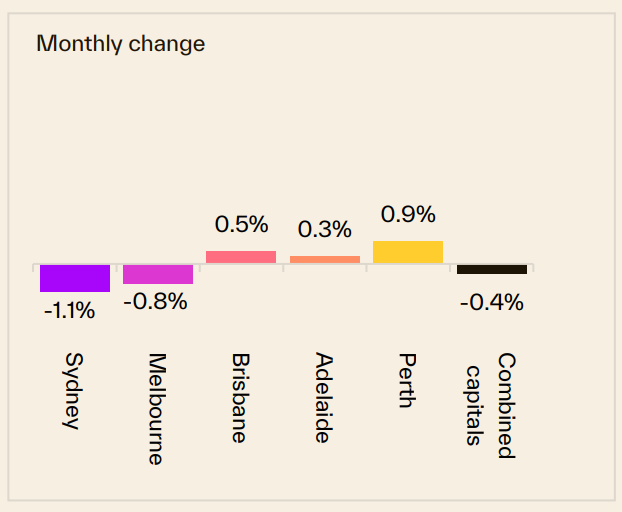
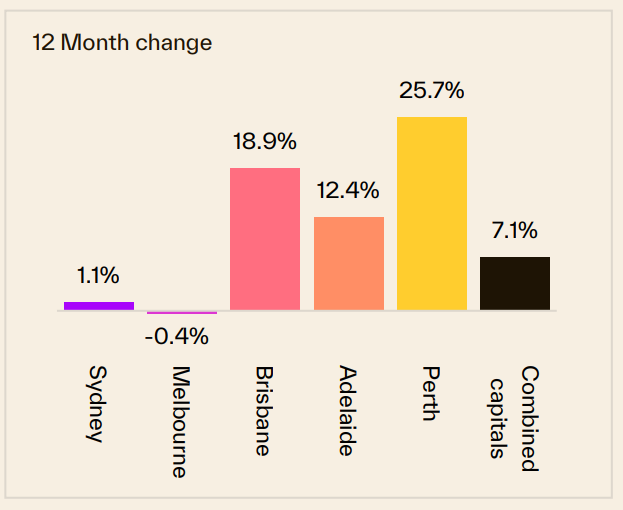
- Sydney property prices declined -0.5% over the last week, also declined -1.1% over the last month, but are 1.1% higher than they were 12 months ago.
- Melbourne property prices declined -0.2% over the last week, also declined -0.8% over the last month, are -0.4% lower compared to 12 months ago.
- Brisbane property prices remained over the last week, increased 0.5% over the last month and are 18.9% higher than they were 12 months ago.
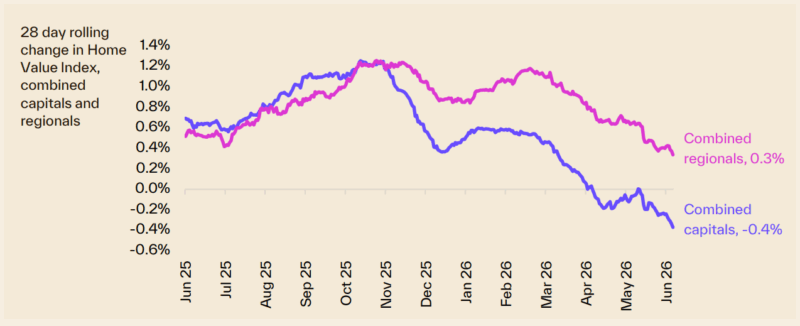
Overall, Australian capital dwelling prices declined -0.4% over the last month and are now 7.1% higher than they were 12 months ago.
Clearly, the property cycle is moving on but our markets are very fragmented.
Source: Cotality June 22nd 2026
Of course, these are "overall" figures - there is not one Sydney or Melbourne or Brisbane property market.
And various segments of each market are performing differently.
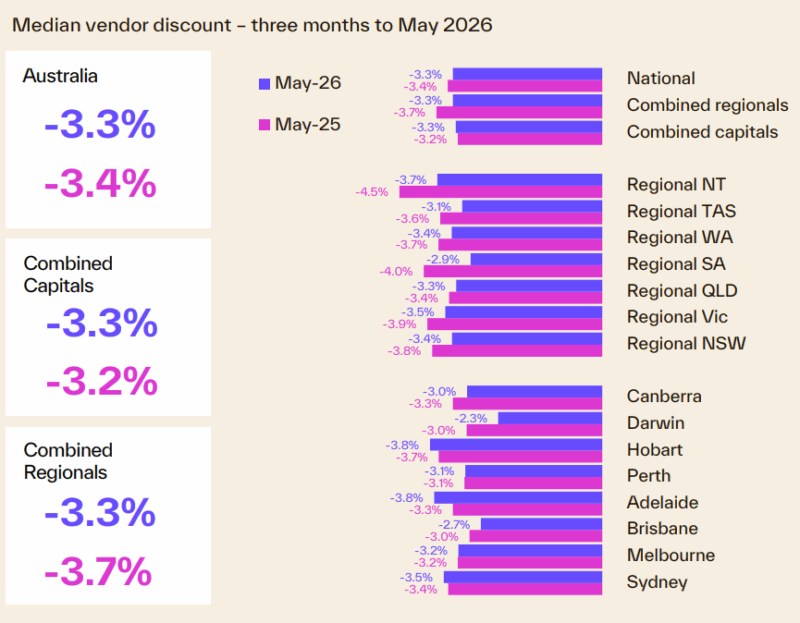
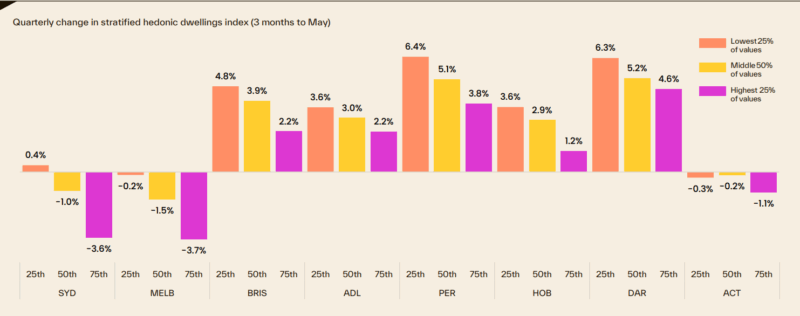
At the beginning of this cycle the upper quartile of the market lead the upswing but last year the lower quartile across every capital city recorded a stronger outcome for housing values relative to its upper quartile counterpart.
The following chart shows how various segments of each capital city market are performing differently, with median-priced properties performing well.
To help keep you up-to-date with all that's happening in property, here is my updated weekly analysis of data and charts as of 22nd June 2026, provided by SQM Research, Cotality, and realestate.com.au.
Current property asking prices
Property asking prices are a useful leading indicator for housing markets - giving a good indication of what's ahead.
Here is the latest data available:
Sydney
| Property type | Price ($) | Weekly Change | Monthly Change % | Annual % change |
|---|---|---|---|---|
| All Houses | 2,106.935 | -13.945 | -1.0% | 2.9% |
| All Units | 922.772 | -2.872 | -0.8% | 9.3% |
| Combined | 1,622.718 | -9.151 | -1.0% | 4.1% |
Source: SQM Research
Melbourne
| Property type | Price ($) | Weekly Change | Monthly Change % | Annual % change |
|---|---|---|---|---|
| All Houses | 1,315.244 | -3.540 | -1.0% | 1.2% |
| All Units | 686.296 | -2.396 | 0.1% | 8.3% |
| Combined | 1,116.152 | -3.178 | -0.8% | 2.5% |
Source: SQM Research
Brisbane
| Property type | Price ($) | Weekly Change | Monthly Change % | Annual % change |
|---|---|---|---|---|
| All Houses | 1,401.668 | -5.398 | -0.9% | 12.4% |
| All Units | 884.154 | -5.054 | -1.4% | 20.5% |
| Combined | 1,270.610 | -5.311 | -1.0% | 13.7% |
Source: SQM Research
Perth
| Property type | Price ($) | Weekly Change | Monthly Change % | Annual % change |
|---|---|---|---|---|
| All Houses | 1,284.005 | -5.605 | -0.9% | 12.8% |
| All Units | 789.030 | -5.342 | -1.8% | 23.9% |
| Combined | 1,153.864 | -5.536 | -1.1 | 14.6% |
Source: SQM Research
Adelaide
| Property type | Price ($) | Weekly Change | Monthly Change % | Annual % change |
|---|---|---|---|---|
| All Houses | 1,136.593 | 4.652 | 0.1% | 7.3% |
| All Units | 625.507 | -0.857 | 0.0% | 12.3% |
| Combined | 1,044.444 | 3.658 | 0.1% | 7.8% |
Source: SQM Research
Canberra
| Property type | Price ($) | Weekly Change | Monthly Change % | Annual % change |
|---|---|---|---|---|
| All Houses | 1,260.030 | 0.457 | 1.2% | 7.3% |
| All Units | 614.257 | 2.993 | 1.1% | 2.5% |
| Combined | 1,014.351 | 1.422 | 1.2% | 5.7% |
Source: SQM Research
Darwin
| Property type | Price ($) | Weekly Change | Monthly Change % | Annual % change |
|---|---|---|---|---|
| All Houses | 854.273 | -1.273 | 0.2% | 11.5% |
| All Units | 472.323 | 7.427 | -0.3% | 15.8% |
| Combined | 704.015 | 2.150 | 0.1% | 12.6% |
Source: SQM Research
Hobart
| Property type | Price ($) | Weekly Change | Monthly Change % | Annual % change |
|---|---|---|---|---|
| All Houses | 937.052 | -0.052 | 1.1% | 10.8% |
| All Units | 552.377 | 0.523 | 3.2% | 12.2% |
| Combined | 878.106 | 0.036 | 1.3% | 10.9% |
Source: SQM Research
National
| Property type | Price ($) | Weekly Change | Monthly Change % | Annual % change |
|---|---|---|---|---|
| All Houses | 1,077.226 | -8.480 | -0.9% | 7.6% |
| All Units | 661.968 | -1.691 | 0.2% | 13.3% |
| Combined | 986.773 | -7.001 | -0.7% | 8.3% |
Source: SQM Research
Cap City Average
| Property type | Price ($) | Weekly Change | Monthly Change % | Annual % change |
|---|---|---|---|---|
| All Houses | 1,546.268 | -11.182 | -1.0% | 4.5% |
| All Units | 810.925 | -3.476 | -1.2% | 10.8% |
| Combined | 1,325.663 | -8.870 | -1.0% | 5.4% |
Source: SQM Research
The value of property asking prices as a leading indicator for housing markets is quite significant.
In fact it's more valuable than median prices which can be quite misleading.
Let's delve into why this is the case and how it impacts the real estate market.
- Early Market Sentiment Indicator: Asking prices often reflect the current sentiment of sellers in the real estate market.
If sellers are confident, they might set higher asking prices, anticipating strong demand.
Conversely, if sellers are uncertain or perceive a market downturn, they might lower their asking prices to attract buyers.
This makes asking prices a real-time indicator of market sentiment, often preceding changes in actual sales prices. - Predictive of Future Price Trends: Trends in asking prices can be predictive of where the actual property prices are headed.
For example, a consistent rise in asking prices over a period can signal an upcoming rise in transaction prices. - Impact of Economic Factors: Economic factors such as interest rates, employment rates, and broader economic health influence asking prices.
For instance, changes in the Reserve Bank of Australia's policies or shifts in the job market can quickly reflect in the asking prices, providing insights into how these factors are influencing the housing market. - Regional Variations: In a diverse market like Australia's, asking prices can also provide insights into regional disparities.
For instance, the property markets in Melbourne and Sydney might behave differently from those in Brisbane or Perth. Asking prices can give early indications of these regional trends. - Influence of Supply and Demand: Asking prices are also a response to the balance of supply and demand in the market.
In areas with limited supply and high demand, asking prices tend to be higher and vice versa.
However, it's important to note that while asking prices are a valuable indicator, they should not be used in isolation.
Other factors like actual sales prices, time on the market, auction clearance rates, and economic conditions also play crucial roles in understanding the property market dynamics.
READ MORE: The latest median property prices in Australia’s major cities
Last weekend's auction report
Combined capitals preliminary clearance rate falls to 47.4%, lowest since April 2020
- Also read:Melbourne property market forecast for 2026 & 2027 | Why the opportunity is bigger than it looks

- Also read:Sydney property market forecast for 2026 and 2027 | Why the short-term softness is a long-term opportunity

- Also read:Latest Property Price Forecasts. Australian Property Market Outlook 2026: Where To Now After The Rate Rise & Budget Changes.

- Also read:Brisbane Property Market Forecast [2026 & Beyond] – What The Olympics Decade Means for Investors.

- Also read:This week’s Australian Property Market Update – Latest Data, State by State June 23rd 2026

Across the combined capitals, the preliminary auction clearance rate fell to 47.4% last week, its lowest reading since the final week of April 2020.
The rate has held below 60% in ten of the past 12 weeks, but last week was the first time it fell under 50% since the early pandemic period.
Digging deeper into the data, 23.6% of scheduled auctions were withdrawn, and nearly half (48%) sold prior to going under the hammer.
This could mean that vendors are unwilling to test the market under auction conditions.
Auction volumes across the capital cities remained relatively low.
Only 1,869 capital city homes went to auction, a 10.8% drop on the previous week and 6.7% fewer than the same week a year ago.
That made it the fifth consecutive week auction numbers have come in below year-ago levels.
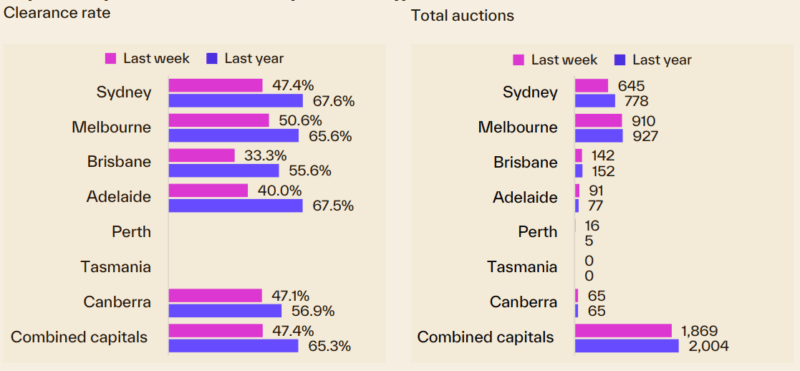
Melbourne’s auction market recorded a weaker result last week, with 910 homes taken to auction, down roughly 6.7% from two weeks ago and approximately 1.8% lower than the same week last year.
The preliminary clearance rate fell to 50.6%, from 57.6% the previous week, marking the city’s weakest early result since September 2021, when Melbourne was in its sixth COVID lockdown.
Similarly, Sydney’s auction market lost momentum last week, with auction volumes falling to 645, down 17.5% on the previous week and 17.1% below the same time last year.
The preliminary clearance rate was also noticeably lower compared to previous weeks, falling to 47.4% from 52.8%, its lowest early result since the week ending 19 April 2020.
Brisbane experienced another soft auction result last week, with its preliminary clearance rate at just 33.3%.
Brisbane held 142 auctions, unchanged from the previous week but 6.6% lower than the same time last year.
It was the fifth consecutive week Brisbane’s preliminary clearance rate has fell below 50%, although the result was slightly higher than the 31.9% recorded three weeks ago.
Adelaide’s auction market also lost momentum last week, with the preliminary clearance rate falling to 40.0%, its weakest early result since May 2020.
Across the capital, 91 homes were taken to auction, down 14.2% on the previous week but 18.2% higher than the same time last year.
The ACT was one of the few markets to record an improvement in clearance rates last week, with the preliminary result rising by 1.4 percentage points to 47.1%.
Auction volumes eased to 65, down 14.5% from a week earlier, but were in line with the same time last year.
Perth remained subdued, with only 16 auctions held and 40.0% reporting a successful result, while Tasmania had no scheduled auctions.
Auction volumes look set to ease further over the coming weeks, partly a seasonal trend but also likely in response to weaker selling conditions.
Around 1,800 auctions are scheduled this week, dropping to less than 1,500 the following week.
Our rental markets
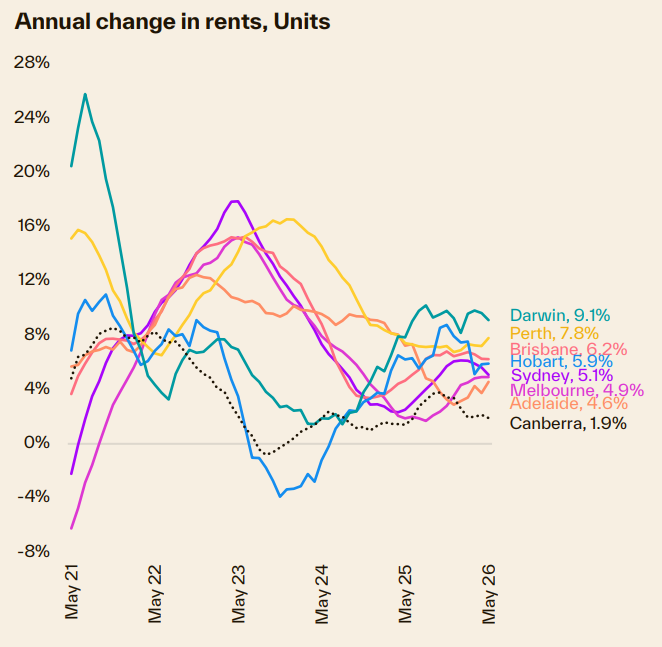
Rents rose 0.6% in May, matching the increase recorded in April, but easing from the 0.7% monthly gains seen through the first three months of 2026.
The monthly rise pushed annual national rent growth to 5.9%, the largest annual increase since the 12 months ending September 2024.
Most capitals have seen annual rental growth regain some momentum in recent months.
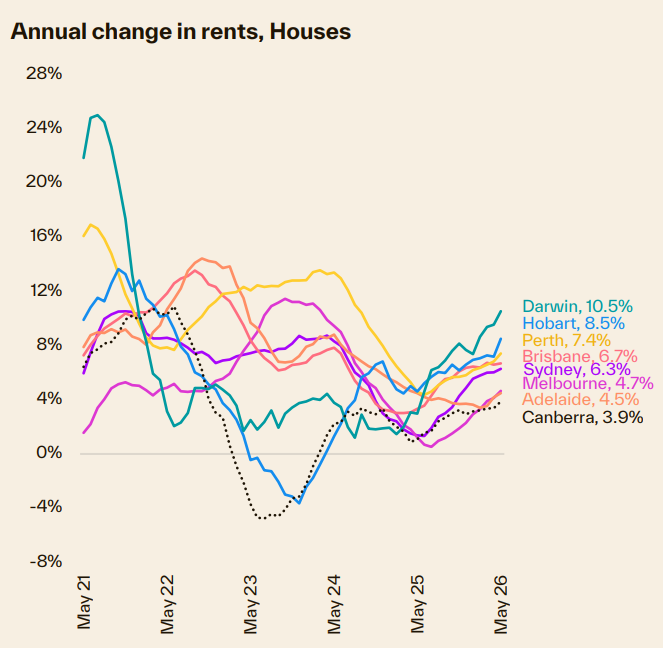
Upward pressure on rents is likely to persist due to very low vacancy rates.
The national vacancy rate dipped to 1.5% in May, in line with the record lows seen in 2022 and 2023, when the catch-up phase of overseas migration pushed vacancy rates lower.
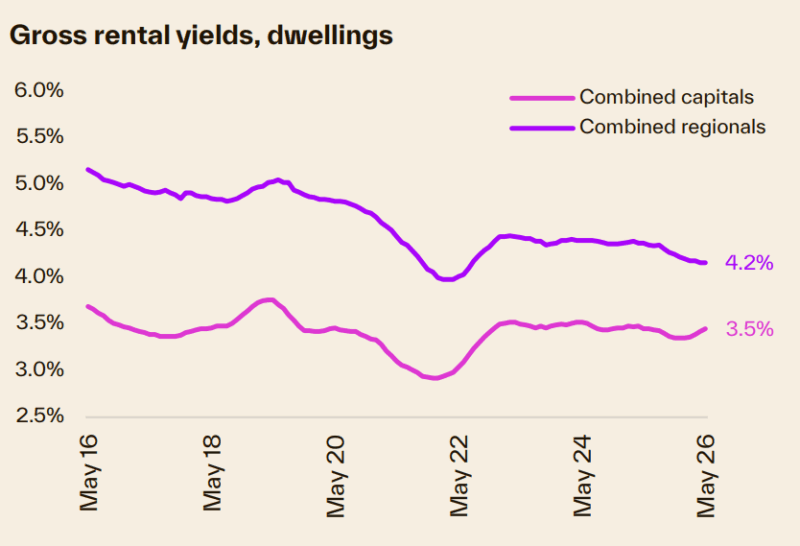
With rents continuing to rise while home value growth eases or turns negative, gross rental yields are coming under some upward pressure, albeit from a low base.
At 3.45%, the combined capitals gross rental yield is at its highest level since June last year.
Sydney
| Property Type | Rent ($) | Weekly change | Monthly change | 12 Months change |
|---|---|---|---|---|
| All Houses | $1,161.51 | 6.50 | -0.1% | 8.7% |
| All Units | $760.50 | -0.49 | 0.5% | 8.1% |
| Combined | $923.24 | 2.34 | 0.2% | 8.4% |
Source: SQM Research
Melbourne
| Property Type | Rent ($) | Weekly change | Monthly change | 12 Months change |
|---|---|---|---|---|
| All Houses | $819.47 | -2.48 | 0.6% | 5.0% |
| All Units | $603.38 | 1.62 | 0.6% | 5.0% |
| Combined | $694.19 | -0.10 | 0.6% | 6.4% |
Source: SQM Research
Brisbane
| Property Type | Rent ($) | Weekly change | Monthly change | 12 Months change |
|---|---|---|---|---|
| All Houses | $830.05 | -1.06 | 0.5% | 9.5% |
| All Units | $643.56 | 3.44 | 0.4% | 7.3% |
| Combined | $746.02 | 0.97 | 0.5% | 8.7% |
Source: SQM Research
Perth
| Property Type | Rent ($) | Weekly change | Monthly change | 12 Months change |
|---|---|---|---|---|
| All Houses | $898.13 | -3.13 | 1.3% | 8.0% |
| All Units | $676.92 | -0.91 | -0.6% | 3.4% |
| Combined | $806.94 | -2.22 | 0.6% | 6.4% |
Source: SQM Research
Adelaide
| Property Type | Rent $) | Weekly change | Monthly change | 12 Months change |
|---|---|---|---|---|
| All Houses | $686.76 | 4.25 | 0.5% | 3.4% |
| All Units | $558.49 | 1.51 | -0.4% | 6.6% |
| Combined | $643.60 | 3.33 | 0.3% | 4.4% |
Source: SQM Research
Canberra
| Property Type | Rent ($) | Weekly change | Monthly change | 12 Months change |
|---|---|---|---|---|
| All Houses | $833.63 | -5.62 | -1.0% | 4.9% |
| All Units | $600.15 | 1.86 | 1.0% | 3.2% |
| Combined | $705.00 | -1.51 | -0.1% | 4.0% |
Source: SQM Research
Darwin
| Property Type | Rent ($) | Weekly change | Monthly change | 12 Months change |
|---|---|---|---|---|
| All Houses | $829.24 | -14.24 | 1.6% | 8.0% |
| All Units | $636.62 | -0.61 | 2.9% | 15.4% |
| Combined | $715.57 | -6.21 | 2.3% | 11.8% |
Source: SQM Research
Hobart
| Property Type | Rent 9$) | Weekly change | Monthly change | 12 Months change |
|---|---|---|---|---|
| All Houses | $621.06 | -6.06 | -1.7% | 8.3% |
| All Units | $584.37 | -5.38 | 0.8% | 17.0% |
| Combined | $606.45 | -5.79 | -0.8% | 11.5% |
Source: SQM Research
National
| Property Type | Rent ($) | Weekly change | Monthly change | 12 Months change |
|---|---|---|---|---|
| All Houses | $778.00 | -3.00 | 0.5% | 7.5% |
| All Units | $604.00 | -2.00 | 0.2% | 6.9% |
| Combined | $697.50 | -2.54 | 0.4% | 7.3% |
Source: SQM Research
Cap City Average
| Property Type | Rent ($) | Weekly change | Monthly change | 12 Months change |
|---|---|---|---|---|
| All Houses | $930.00 | 1.00 | 0.2% | 8.1% |
| All Units | $683.00 | 0.00 | 0.3% | 6.7% |
| Combined | $798.91 | 0.47 | 0.3% | 7.5% |
Source: SQM Research
Here's how many properties are for sale at the moment
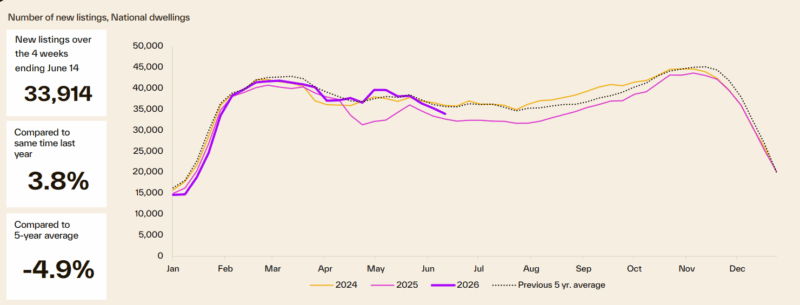
After tracking below last year and the five-year average for most of 2026, new listings increased through May to converge with seasonal norms, ending the period 3.8% above year-ago levels but still 4.9% below the five-year average.
Advertised stock levels are experiencing upward pressure as a steady rise in new listings coincides with a decline in consumer demand, leading to fewer home purchases.
Listings are only marginally ahead of last year and tracking 1.7% above the same time last year but remain 6.5% below the 5-year average.
Vendor metrics
Compared to a year ago, homes are selling faster.
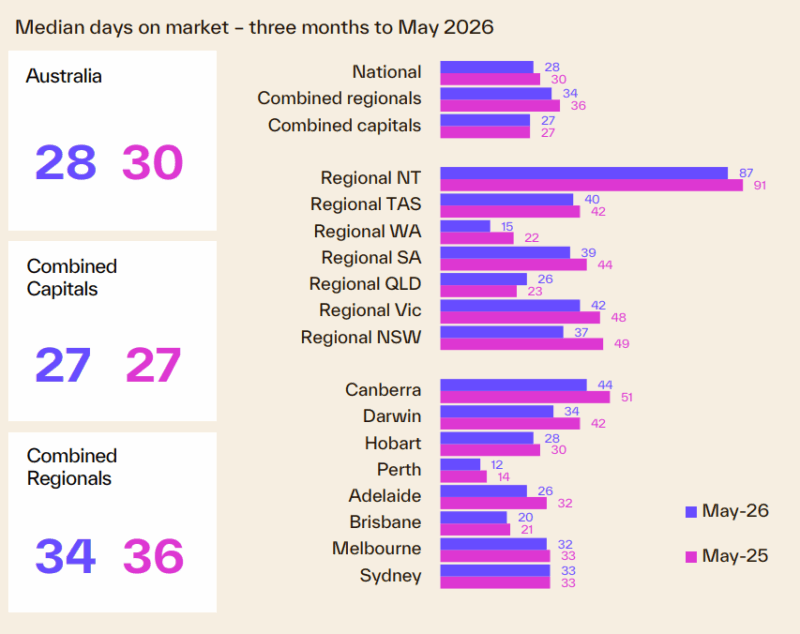
Nationwide, homes sold in a median of 28 days during the three months leading up to May 2026, a slight improvement from the 30-day median recorded in May 2025.
However, this momentum appears to be reducing as selling times have begun to rise in early 2026, a shift that suggests softening housing demand in the face uncertainty and macroeconomic pressures.