Key takeaways
The RBA meets today (May 5th) and all four major banks are forecasting another 25 basis point rise, which would take the cash rate to 4.35% - that's three hikes in 2026 already.
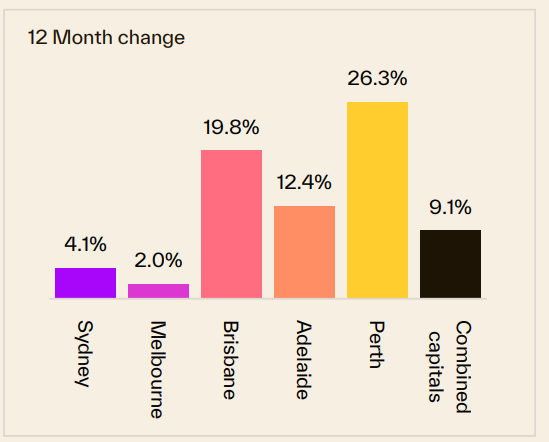
Despite rising rates, national capital city dwelling prices are still 9.1% higher than a year ago, proving once again that the fundamentals matter more than the headlines.
The market is deeply fragmented - Brisbane is up 19.8% annually, Perth up 18.6%, while Sydney and Melbourne have softened in the short term but remain positive over the year.
Preliminary auction clearance rates have now held above 60% for two consecutive weeks across the combined capitals, suggesting buyers and sellers are finding their footing despite the rate uncertainty.
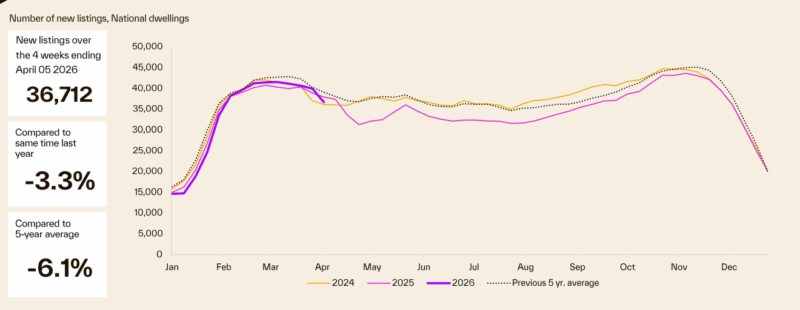
Quality vendors remain on strike - new listings are 3.3% below year-ago levels and 6.1% below the five-year average, keeping a firm floor under prices.
Total advertised stock is 11.5% lower than this time last year and 15.1% below the five-year average - this is not a market being flooded with supply.
The rental market is tightening again, with national rents up 5.7% annually and the national vacancy rate holding at just 1.6%, well below the decade average of 3.3%.
Melbourne asking prices are actually up 5.7% annually on a combined basis - a reminder that the negativity around Melbourne doesn't always match what the data is saying.
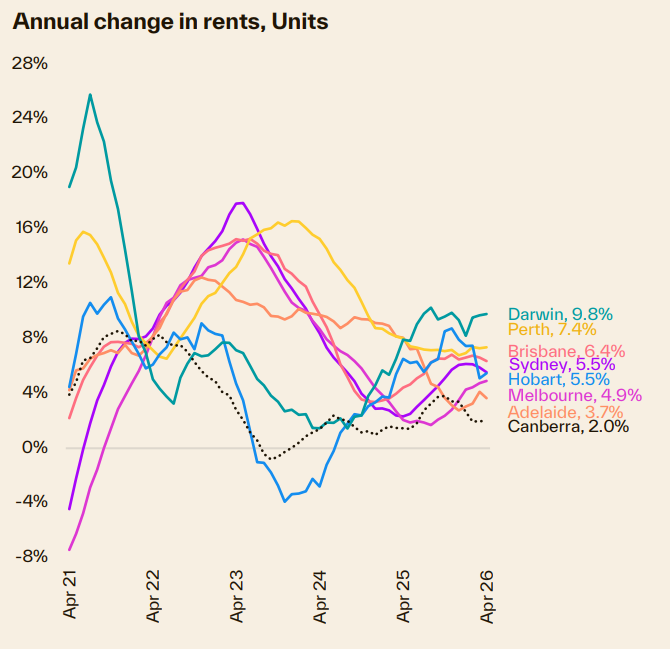
Brisbane units are the standout performer on asking prices, up 24.7% over the past year - the Queensland capital continues to attract strong demand.
The structural case for Australian property remains intact - chronic undersupply, strong population growth, and a decade-long construction deficit aren't going away because of a rate rise or two.
Every week I sit down with the latest property data and try to cut through the noise to find what actually matters for serious investors.
And right now, there is quite a bit of noise.
Annual CPI jumped to 4.6% in March, up from 3.7% in February, driven largely by housing costs, transport, and food - and the RBA is likely to respond to this by lifting the cash rate once again at its May meeting.
ANZ, CBA, and NAB are all forecasting another 25 basis point rise, which would take the cash rate to 4.35%. Westpac has gone further, tipping three more hikes through to August. That is a meaningful shift from where sentiment was just a few months ago, when most economists were still talking about rate cuts.
The RBA has flagged that rising oil prices, driven by Middle East tensions, are a key near-term inflation driver, and that most board members consider further rate hikes likely necessary to return inflation to target.
I understand why that backdrop makes some investors nervous. Higher rates reduce borrowing capacity, slow buyer activity, and create short-term uncertainty about where prices are heading.
I've been investing through rate cycles for 50 years, and the pattern is consistent - the investors who stay patient and strategic during uncertain periods are the ones who look back and wish they had bought more.
Remember the underlying fundamentals that have driven this cycle have not changed.
What has changed is sentiment, and sentiment is always the most volatile - and least reliable - part of any property cycle.
Let me walk you through what the data is showing us this week, city by city.
On the auction front this week... Auction volumes bounce back as clearance rates steady
Auction activity increased last week, with 2,529 properties going under the hammer, a solid rise from 757 two weeks ago, which was impacted by ANZAC Day commemorations and long weekends in some states.
Compared with the same week last year, volumes were substantially higher (1,595, a 59% increase), with the year earlier result at least partly distorted by the timing of long weekends.
See Cotality's full auction report below.
This week, Cotality also reports that:
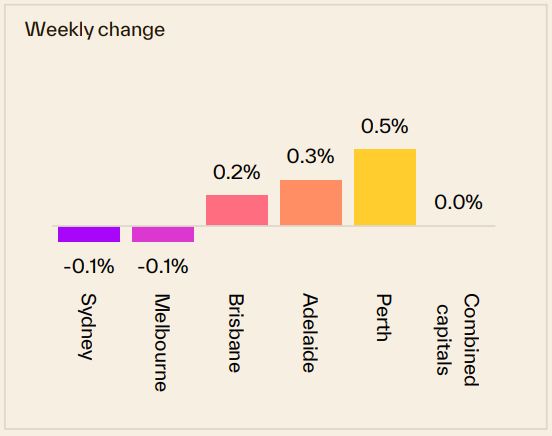
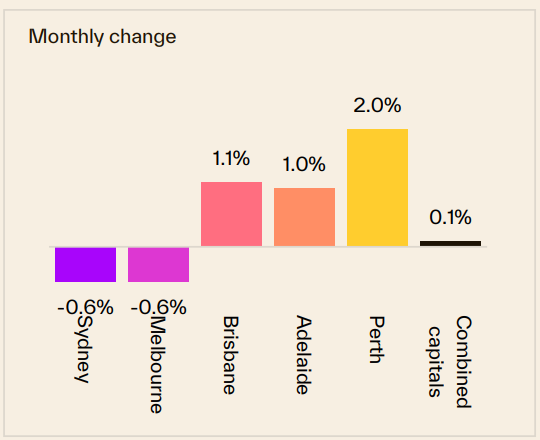
- Sydney property prices declined -0.1% over the last week, also declined -0.6% over the last month but are 4.1% higher than they were 12 months ago.
- Melbourne property prices declined -0.1%t over the last week, also declined -0.6% over the last month, and increased 2% compared to 12 months ago.
- Brisbane property prices increased 0.2% over the last week, increased 1.1% over the last month and are 19.8% higher than they were 12 months ago.
Overall, Australian capital dwelling prices increased 0.31% over the last month and are now 9.1% higher than they were 12 months ago.
Clearly, the property cycle is moving on but our markets are very fragmented.
Source: Cotality May 4th 2026
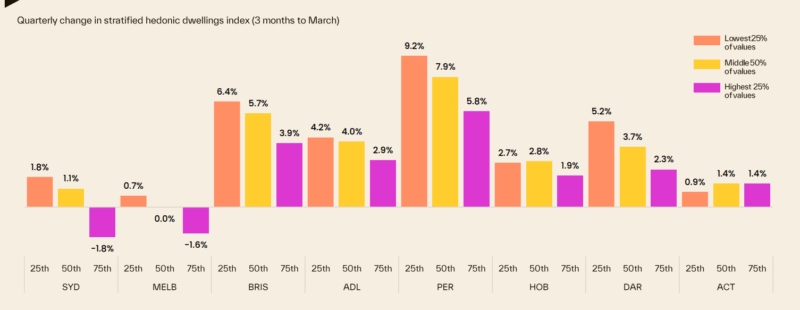
Of course, these are "overall" figures - there is not one Sydney or Melbourne or Brisbane property market.
And various segments of each market are performing differently.
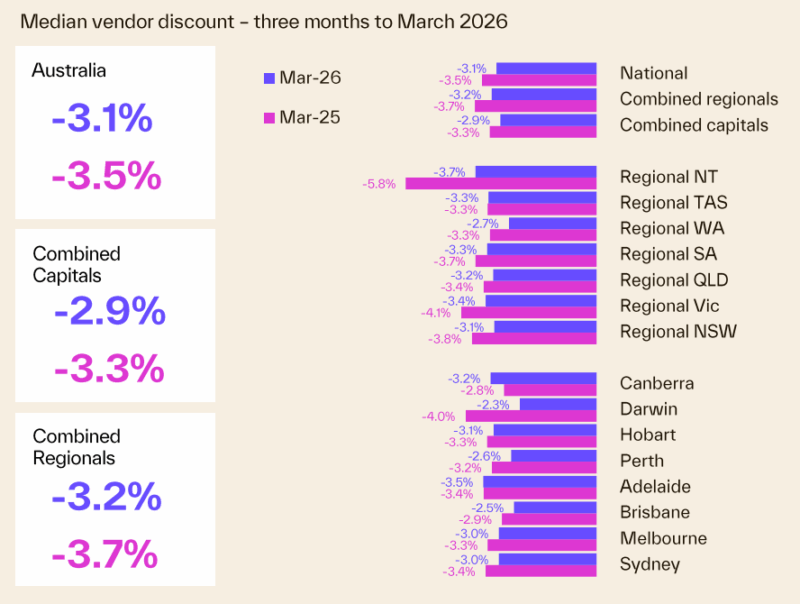
At the beginning of this cycle the upper quartile of the market lead the upswing but last year the lower quartile across every capital city recorded a stronger outcome for housing values relative to its upper quartile counterpart.
The following chart shows how various segments of each capital city market are performing differently, with median-priced properties performing well.
To help keep you up-to-date with all that's happening in property, here is my updated weekly analysis of data and charts as of 4th April 2026, provided by SQM Research, Cotality, and realestate.com.au.
Current property asking prices
Property asking prices are a useful leading indicator for housing markets - giving a good indication of what's ahead.
Here is the latest data available:
Sydney
| Property type | Price ($) | Weekly Change | Monthly Change % | Annual % change |
|---|---|---|---|---|
| All Houses | 2,138.491 | -10.091 | -1.1% | 4.9% |
| All Units | 930.426 | 0.324 | 1.4% | 9.5% |
| Combined | 1,644.749 | -5.834 | -0.5% | 5.7% |
Source: SQM Research
Melbourne
| Property type | Price ($) | Weekly Change | Monthly Change % | Annual % change |
|---|---|---|---|---|
| All Houses | 1,344.477 | -1.371 | 0.1% | 5.1% |
| All Units | 683.121 | 0.379 | 0.3% | 8.9% |
| Combined | 1,135.033 | -0.817 | 0.1% | 5.7% |
Source: SQM Research
Brisbane
| Property type | Price ($) | Weekly Change | Monthly Change % | Annual % change |
|---|---|---|---|---|
| All Houses | 1,426.576 | -9.857 | -1.5% | 16.5% |
| All Units | 894.370 | -3.070 | -0.1% | 24.7% |
| Combined | 1,292.012 | -8.141 | -1.3% | 17.8% |
Source: SQM Research
Perth
| Property type | Price ($) | Weekly Change | Monthly Change % | Annual % change |
|---|---|---|---|---|
| All Houses | 1,321.347 | -6.759 | 1.0% | 17.6% |
| All Units | 801.363 | -5.980 | -0.6% | 23.6% |
| Combined | 1,184.696 | -6.554 | 0.7% | 18.6% |
Source: SQM Research
Adelaide
| Property type | Price ($) | Weekly Change | Monthly Change % | Annual % change |
|---|---|---|---|---|
| All Houses | 1,150.514 | -5.514 | 1.6% | 14.5% |
| All Units | 607.327 | 4.563 | -0.6% | 11.0% |
| Combined | 1,052.629 | -3.698 | 1.4% | 14.1% |
Source: SQM Research
Canberra
| Property type | Price ($) | Weekly Change | Monthly Change % | Annual % change |
|---|---|---|---|---|
| All Houses | 1,241.122 | -15.760 | -2.6% | 7.6% |
| All Units | 599.605 | -4.355 | -0.9% | 0.4% |
| Combined | 997.791 | -11.434 | -2.3% | 5.4% |
Source: SQM Research
Darwin
| Property type | Price ($) | Weekly Change | Monthly Change % | Annual % change |
|---|---|---|---|---|
| All Houses | 826.595 | -0.795 | -1.0% | 8.6% |
| All Units | 489.810 | 2.690 | 2.2% | 20.7% |
| Combined | 694.110 | 0.576 | -0.2% | 11.6% |
Source: SQM Research
Hobart
| Property type | Price ($) | Weekly Change | Monthly Change % | Annual % change |
|---|---|---|---|---|
| All Houses | 918.005 | 6.749 | 1.6% | 8.0% |
| All Units | 535.303 | 4.097 | 4.5% | 6.3% |
| Combined | 859.431 | 6.343 | 1.9% | 7.8% |
Source: SQM Research
National
| Property type | Price ($) | Weekly Change | Monthly Change % | Annual % change |
|---|---|---|---|---|
| All Houses | 1,087.863 | 0.699 | -0.3% | 11.3% |
| All Units | 655.940 | 5.328 | 0.3% | 12.4% |
| Combined | 993.887 | 1.706 | -0.2% | 11.5% |
Source: SQM Research
Cap City Average
| Property type | Price ($) | Weekly Change | Monthly Change % | Annual % change |
|---|---|---|---|---|
| All Houses | 1,573.573 | -8.507 | -1.0% | 7.4% |
| All Units | 816.807 | -1.167 | 0.5% | 11.4% |
| Combined | 1,346.770 | -6.307 | -0.7% | 8.0% |
Source: SQM Research
The value of property asking prices as a leading indicator for housing markets is quite significant.
In fact it's more valuable than median prices which can be quite misleading.
Let's delve into why this is the case and how it impacts the real estate market.
- Early Market Sentiment Indicator: Asking prices often reflect the current sentiment of sellers in the real estate market.
If sellers are confident, they might set higher asking prices, anticipating strong demand.
Conversely, if sellers are uncertain or perceive a market downturn, they might lower their asking prices to attract buyers.
This makes asking prices a real-time indicator of market sentiment, often preceding changes in actual sales prices. - Predictive of Future Price Trends: Trends in asking prices can be predictive of where the actual property prices are headed.
For example, a consistent rise in asking prices over a period can signal an upcoming rise in transaction prices. - Impact of Economic Factors: Economic factors such as interest rates, employment rates, and broader economic health influence asking prices.
For instance, changes in the Reserve Bank of Australia's policies or shifts in the job market can quickly reflect in the asking prices, providing insights into how these factors are influencing the housing market. - Regional Variations: In a diverse market like Australia's, asking prices can also provide insights into regional disparities.
For instance, the property markets in Melbourne and Sydney might behave differently from those in Brisbane or Perth. Asking prices can give early indications of these regional trends. - Influence of Supply and Demand: Asking prices are also a response to the balance of supply and demand in the market.
In areas with limited supply and high demand, asking prices tend to be higher and vice versa.
However, it's important to note that while asking prices are a valuable indicator, they should not be used in isolation.
Other factors like actual sales prices, time on the market, auction clearance rates, and economic conditions also play crucial roles in understanding the property market dynamics.
READ MORE: The latest median property prices in Australia’s major cities
Last weekend's auction report
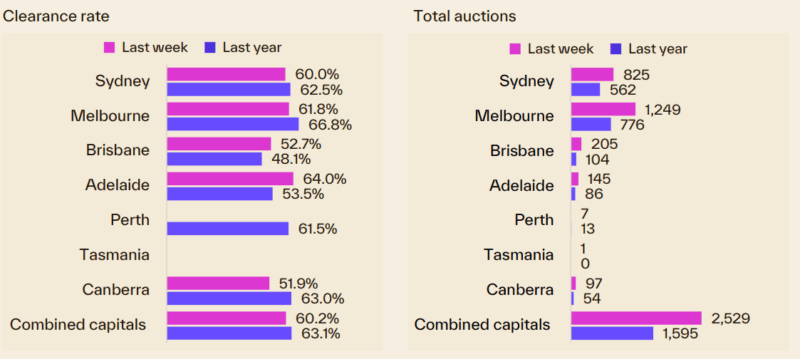
Auction volumes bounce back as clearance rates steady
Auction activity increased last week, with 2,529 properties going under the hammer, a solid rise from 757 two weeks ago, which was impacted by ANZAC Day commemorations and long weekends in some states.
Compared with the same week last year, volumes were substantially higher (1,595, a 59% increase), with the year earlier result at least partly distorted by the timing of long weekends.
- Also read:This week’s Australian Property Market Update – Latest Data, State by State May 5th 2026

- Also read:Melbourne property market forecast for 2026 & 2027 | Why the opportunity is bigger than it looks

- Also read:Sydney property market forecast for 2026 and 2027 | Why the short-term softness is a long-term opportunity

- Also read:Latest Property Price Forecasts Revealed. Australian Property Market Outlook 2026: Where To Now After The Rate Rise.

- Also read:Brisbane Property Market Forecast [2026 & Beyond] – What The Olympics Decade Means for Investors.

The preliminary clearance rate across the combined capitals came in at 60.2%, down slightly from 60.7% two weeks ago (albeit this was revised down to 54.9% on final numbers).
However, this was the second week running where the preliminary clearance rate held above the 60% mark, suggesting a slightly better fit between buyer and seller pricing expectations.
Melbourne recorded the most auctions last week, with 1,249 events, up from 244 two weeks ago and a 61% increase on the same week a year ago.
61.8% of auctions reported a successful result, down from 62.5% two weeks ago (revised lower to 54.9% once finalised).
This was the second week in a row where the early clearance rate held above the 60% mark.
825 homes were auctioned in Sydney last week, up from 257 two weeks ago and 46.8% higher than the same time last year.
The preliminary clearance rate reached 60.0%, the highest early outcome in six weeks.
Across the mid-sized capitals, Brisbane led the way with 205 auctions, up from 87 two weeks ago and nearly double (+97%) the number held the same time last year.
The preliminary clearance rate was 52.7%, on par with two weeks ago as the lowest preliminary clearance rate in twelve months.
145 auctions were held in Adelaide last week, up from 135 two weeks ago and 68.6% higher than the same week last year.
64.0% of auctions reported a successful result, down from 69.4% two weeks ago, and this was the lowest preliminary clearance rate since the Easter long weekend.
The ACT hosted 97 auctions last week with a preliminary clearance rate of 51.9%, up from 50.0% two weeks ago.
Only seven auctions were held in Perth last week and one in Tasmania.
Cotality is currently tracking approximately 2,270 homes scheduled for auction this week, and close to 2,000 auctions the week after.
Our rental markets
There is no evidence that the rental market is starting to loosen, with the rental vacancy rate holding at 1.6% across Australia in April, lower in the unit sector (1.5%) and higher for houses (1.7%).
Every capital city recorded a vacancy rate of 1.8% or lower, well below the national average of 2.5% over the decade.
Over the ten years before 2020, the national rental vacancy rate averaged 3.3%.
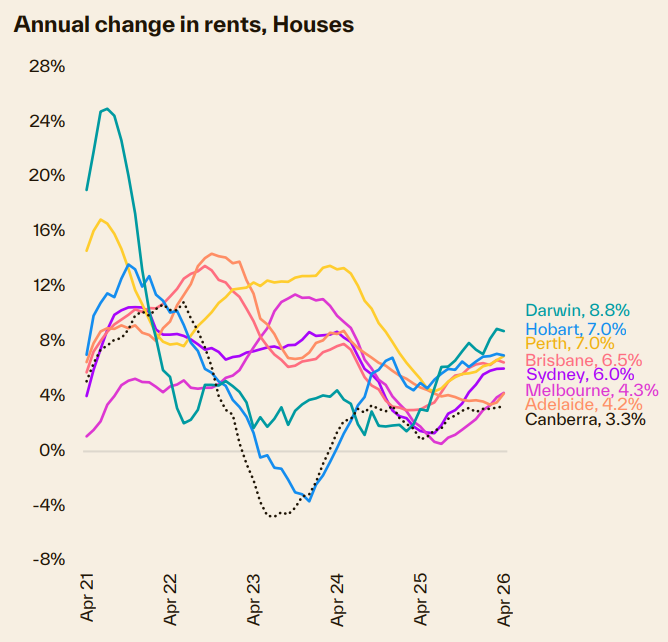
With vacancy rates remaining low, rents continue to rise, up a further 0.6% in April.
Rents were 5.7% higher over the year, the fastest annual pace of growth since October 2024, adding approximately $38 per week to the national median rent.
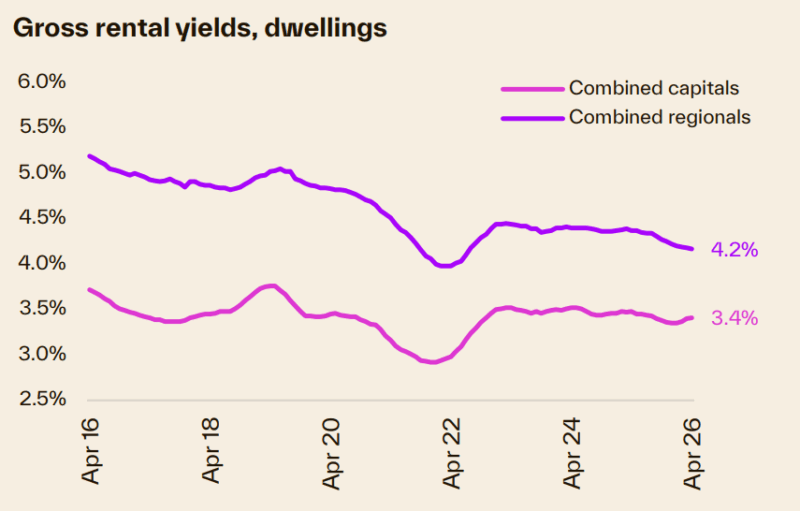
In Sydney and Melbourne, as well as Canberra’s unit market, annual rental growth is now outpacing value growth, placing some upward pressure on gross rental yields, albeit from very low levels.
Sydney
| Property Type | Rent ($) | Weekly change | Monthly change | 12 Months change |
|---|---|---|---|---|
| All Houses | $1,155.44 | 5.55 | 0.1% | 8.7% |
| All Units | $754.20 | -0.20 | 0.1% | 5.7% |
| Combined | $917.01 | 2.19 | 0.1% | 7.3% |
Source: SQM Research
Melbourne
| Property Type | Rent ($) | Weekly change | Monthly change | 12 Months change |
|---|---|---|---|---|
| All Houses | $811.90 | 2.10 | 0.9% | 6.6% |
| All Units | $598.69 | 1.31 | 0.4% | 5.7% |
| Combined | $688.22 | 1.72 | 0.7% | 6.2% |
Source: SQM Research
Brisbane
| Property Type | Rent ($) | Weekly change | Monthly change | 12 Months change |
|---|---|---|---|---|
| All Houses | $820.87 | 3.12 | 0.7% | 8.3% |
| All Units | $638.32 | 1.68 | 1.5% | 7.1% |
| Combined | $738.62 | 2.47 | 1.0% | 7.8% |
Source: SQM Research
Perth
| Property Type | Rent ($) | Weekly change | Monthly change | 12 Months change |
|---|---|---|---|---|
| All Houses | $883.32 | -1.31 | -1.2% | 6.1% |
| All Units | $684.60 | 2.40 | 0.7% | 5.6% |
| Combined | $801.36 | 0.24 | -0.5% | 6.0% |
Source: SQM Research
Adelaide
| Property Type | Rent $) | Weekly change | Monthly change | 12 Months change |
|---|---|---|---|---|
| All Houses | $685.83 | -6.83 | -1.2% | 3.0% |
| All Units | $558.95 | 3.04 | 2.3% | 8.5% |
| Combined | $643.12 | -3.48 | -0.2% | 4.7% |
Source: SQM Research
Canberra
| Property Type | Rent ($) | Weekly change | Monthly change | 12 Months change |
|---|---|---|---|---|
| All Houses | $823.54 | 4.47 | 2.4% | 1.3% |
| All Units | $590.89 | -3.88 | -0.9% | 0.8% |
| Combined | $695.48 | -0.23 | 0.8% | 0.9% |
Source: SQM Research
Darwin
| Property Type | Rent ($) | Weekly change | Monthly change | 12 Months change |
|---|---|---|---|---|
| All Houses | $812.38 | -0.37 | 1.8% | 9.5% |
| All Units | $589.43 | 12.57 | 0.3% | 10.4% |
| Combined | $680.79 | 7.31 | 1.0% | 10.0% |
Source: SQM Research
Hobart
| Property Type | Rent 9$) | Weekly change | Monthly change | 12 Months change |
|---|---|---|---|---|
| All Houses | $625.41 | -3.42 | 1.6% | 14.2% |
| All Units | $563.92 | 2.09 | -3.7% | 15.7% |
| Combined | $600.92 | -1.21 | -0.5% | 14.8% |
Source: SQM Research
National
| Property Type | Rent ($) | Weekly change | Monthly change | 12 Months change |
|---|---|---|---|---|
| All Houses | $774.00 | 3.00 | 0.3% | 7.1% |
| All Units | $600.00 | -2.00 | 0.3% | 5.8% |
| Combined | $693.48 | 0.71 | 0.3% | 6.6% |
Source: SQM Research
Cap City Average
| Property Type | Rent ($) | Weekly change | Monthly change | 12 Months change |
|---|---|---|---|---|
| All Houses | $923.00 | 4.00 | 0.3% | 7.5% |
| All Units | $679.00 | 1.00 | 0.2% | 6.1% |
| Combined | $793.47 | 2.44 | 0.3% | 6.9% |
Source: SQM Research
Sellers of good properties are on strike
Vendor activity has been lower than average for this time of the year.
The flow of new listings moved through a seasonal high in early March but has tracked below the five-year average through the year-to-date.
Over the four weeks to April 5 th, the number of new listings added to the market nationally was 3.3% lower than a year ago and 6.1% below the five - year average.
Cotality was tracking close to 122,500 house and unit listings over the four weeks to April 5th.
With a softer than average flow of new listings to market, total advertised stock levels were tracking 11.5% lower than at the same time a year ago and 15.1% below the five - year average.
Vendor metrics
Compared to a year ago, homes are selling faster.
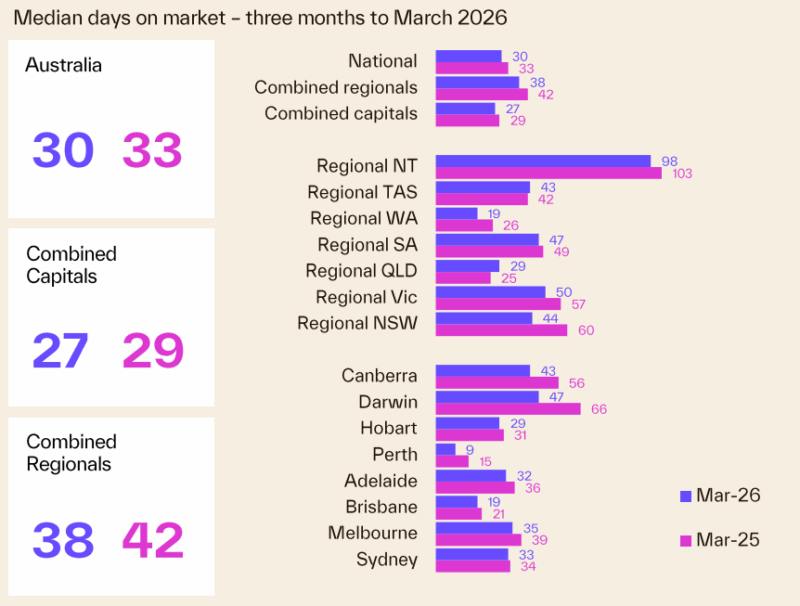
Homes are selling faster, with a median of 30 days on market in the March quarter, down from 33 days in Q1 2025.
However, the median selling time has risen through early 2026, reflecting a combination of seasonality alongside a slowdown in housing demand.