

Australian employment increased over 350,000 over the last year.
Jobs confidence and employment security leads consumer confidence and that's good for our economy and of course for our property markets.
Employment increased by a seasonally adjusted 15,900 to a new high of 12,522,300 in May.

That still wasn't enough to stop the annual pace of jobs growth slowing from a sizzling 3.4pc just a few months earlier to a still-reasonable 2.5pc.And, importantly, the pace of full time jobs growth has faded over the past four months too.
And as usual Melbourne and Sydney continue to be the employment powerhouses of Australia.
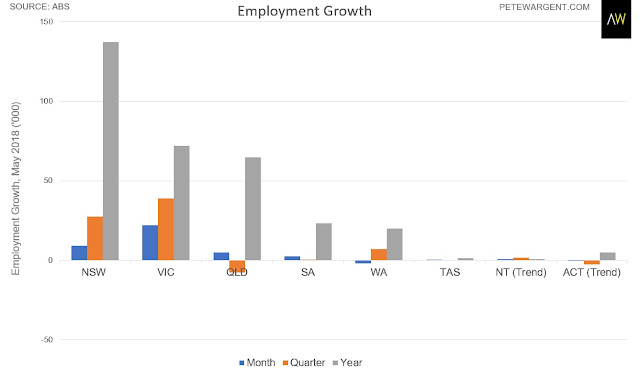
New South Wales has seen by far the greatest employment growth over the past year at 137,200, with Victoria (72,000) and Queensland (64,900) also performing well in terms of headline employment growth.
The latest data for the Roy Morgan employment series for May shows:
- The workforce is 13,461,000 comprised of employed and unemployed, up a large 387,000 on a year ago;
- 12,415,000 Australians were employed in May, up a significant 355,000 over the past year;
- The increase was driven by full-time employment which rose 307,000 to 7,859,000 while part-time employment was up 48,000 to 4,286,000;
- 1,316,000 Australians were unemployed (9.8% of the workforce); an increase of 32,000 (unchanged in percentage terms) on a year ago. In addition 1,251,000 Australians (9.3% of the workforce) are now under-employed, working part-time and looking for more work, a fall of 87,000 in a year (down 0.9%);
But what's the "real" unemployment rate?
According to Roy Morgan the "real" unemployment figure is 9.8% for May which is substantially higher than the current ABS estimate for April 2018 of 5.6%.

Source: Roy Morgan Single Source October 2005 – May 2018. Average monthly interviews 4,000.
Michele Levine, Chief Executive Officer, Roy Morgan, said employment growth in Australia has been strong over the last year but has made only a slight difference to overall unemployment and under-employment which has averaged just over 2.5 million for the year:
“Roy Morgan employment estimates show employment growth of 355,000 over the past year with full-time employment increasing by 307,000 and part-time employment up by 48,000.
“Although employment growth has been strong, the increasing Australian population, and the increasing size of the Australian workforce, means this strong employment growth has had only a small impact on overall unemployment and under-employment.
“In May 2.567 million Australians were unemployed or under-employed comprising over 1.3 million unemployed and over 1.25 million under-employed. This is only slightly down on the 2.622 million Australians unemployed or under-employed a year ago. In fact, overall unemployment and under-employment has now averaged over 2.5 million since December 2016 despite strong jobs growth.
- Also read:Brisbane’s property market forecast for 2024
- Also read:Melbourne property market forecast for 2024
- Also read:Sydney property market forecast for 2024
- Also read:Latest property price forecasts for 2024 revealed. What’s ahead in our housing markets in the next year or two?
- Also read:This week’s Australian Property Market Update – Latest Data, State by State June 26th 2024
“The Fair Work Commission’s decision earlier this month to raise the minimum wage by 3.5% to almost $720 per week will do nothing to reduce the ‘true’ high levels of unemployment and under-employment. The decision was based on the misleading ABS unemployment figure that under-states the ‘true’ level of unemployment and under-employment in Australia.
“In future the Fair Work Commission needs to consider the more accurate Roy Morgan employment figures that consistently records there are more than 2.5 million Australians looking for work or looking for more work.
“Last month’s Federal Budget did include some good news with income tax cuts due to take effect from July and wage subsidies provided to employers to take on certain types of older workers. However, these reforms are unlikely to have a big impact on Australia’s over 2.5 million unemployed and under-employed.
“The Turnbull Government’s policy of cutting company tax rates from 30% to 25% which will spur greater investment and hiring by businesses with more money to spend was announced in early 2017 and is still yet to be legislated.
“The booming US economy with record low levels of unemployment following substantial cuts to company tax rates by US President Donald Trump is a powerful example of what this tax reform could achieve when enacted.”
This Roy Morgan survey on Australia’s unemployment and ‘under-employed’* is based on weekly face-to-face interviews of 583,399 Australians aged 14 and over between January 2007 – May 2018 and includes 3,897 face-to-face interviews in May 2018.


*The ‘under-employed’ are those people who are in part-time work or consultants who are looking for more work. (Unfortunately the ABS does not release this figure in their monthly unemployment survey results).
Roy Morgan Unemployed and ‘Under-employed’* Estimates
| Unemployed or
‘Under-employed’* |
Unemployed | Unemployed looking for | ‘Under-employed’* | |||||
| Full-time | Part-time | |||||||
| 2017 | ‘000 | % | ‘000 | % | ‘000 | ‘000 | ‘000 | % |
| Jan-Mar 2017 | 2,377 | 17.9 | 1,261 | 9.5 | 591 | 670 | 1,116 | 8.4 |
| Apr-Jun 2017 | 2,525 | 19.0 | 1,234 | 9.3 | 607 | 627 | 1,291 | 9.7 |
| Jul-Sep 2017 | 2,508 | 19.1 | 1,254 | 9.6 | 598 | 656 | 1,254 | 9.5 |
| Oct-Dec 2017 | 2,442 | 18.5 | 1,275 | 9.7 | 659 | 616 | 1,167 | 8.8 |
| 2018 | ||||||||
| Jan-Mar 2018 | 2,561 | 18.9 | 1,246 | 9.2 | 626 | 620 | 1,314 | 9.7 |
| Months | ||||||||
| April 2017 | 2,307 | 17.6 | 1,217 | 9.3 | 612 | 605 | 1,090 | 8.3 |
| May 2017 | 2,622 | 20.0 | 1,284 | 9.8 | 659 | 625 | 1,338 | 10.2 |
| June 2017 | 2,645 | 19.6 | 1,200 | 8.9 | 550 | 650 | 1,445 | 10.7 |
| July 2017 | 2,462 | 18.8 | 1,236 | 9.4 | 568 | 668 | 1,226 | 9.4 |
| August 2017 | 2,565 | 19.7 | 1,324 | 10.2 | 639 | 685 | 1,241 | 9.5 |
| September 2017 | 2,498 | 18.9 | 1,202 | 9.1 | 586 | 616 | 1,296 | 9.8 |
| October 2017 | 2,334 | 18.0 | 1,226 | 9.5 | 658 | 568 | 1,108 | 8.5 |
| November 2017 | 2,394 | 18.2 | 1,288 | 9.8 | 624 | 664 | 1,106 | 8.4 |
| December 2017 | 2,600 | 19.4 | 1,312 | 9.8 | 696 | 616 | 1,288 | 9.6 |
| January 2018 | 2,590 | 19.3 | 1,219 | 9.1 | 642 | 577 | 1,371 | 10.2 |
| February 2018 | 2,520 | 18.6 | 1,310 | 9.7 | 658 | 652 | 1,210 | 8.9 |
| March 2018 | 2,572 | 18.9 | 1,210 | 8.9 | 578 | 632 | 1,362 | 10.0 |
| April 2018 | 2,545 | 19.3 | 1,196 | 9.1 | 561 | 635 | 1,349 | 10.2 |
| May 2018 | 2,567 | 19.1 | 1,316 | 9.8 | 627 | 689 | 1,251 | 9.3 |
*Workforce includes those employed and those looking for work – the unemployed.
Roy Morgan Research vs. ABS Unemployment Estimates


