


Key takeaways
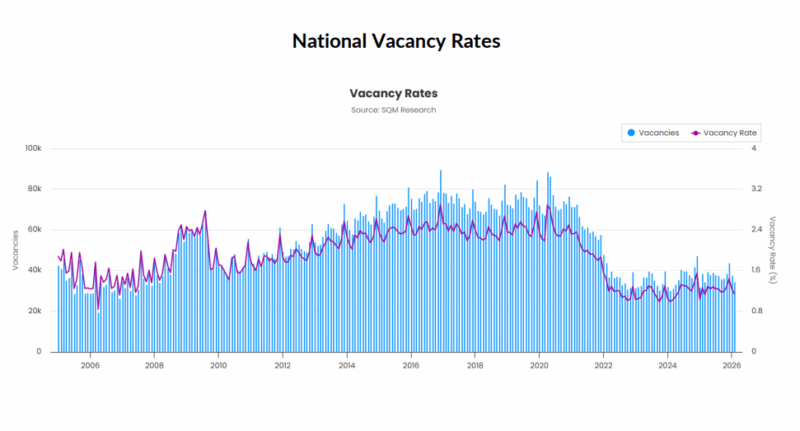
Australia’s national residential vacancy rate fell to 1.1% in February 2026, down from 1.2% in January and notably down from February 2025 (1.3%).
The total number of residential vacancies declined to 34,572 dwellings, indicating continued tightening in rental market conditions across most capital cities.
The February result suggests that the seasonal tightening typically observed at the start of the year has continued and expanded, with strong tenant demand absorbing available rental listings down to levels below what was recorded this time last year
SQM Research released its latest data on residential rental property vacancy rates.
Australia’s national residential vacancy rate fell to 1.1% in February 2026, down from 1.2% in January and notably down from February 2025 (1.3%).
The total number of residential vacancies declined to 34,572 dwellings, indicating continued tightening in rental market conditions across most capital cities.
The February result suggests that the seasonal tightening typically observed at the start of the year has continued and expanded, with strong tenant demand absorbing available rental listings down to levels below what was recorded this time last year.
Vacancy Rates - February 2026
| City | Feb 2025 Vacancies | Feb 2025 Vacancy Rate | Jan 2026 Vacancies | Jan 2026 Vacancy Rate | Feb 2026 Vacancies | Feb 2026 Vacancy Rate |
|---|---|---|---|---|---|---|
| Sydney | 11,155 | 1.5% | 10,987 | 1.5% | 9,491 | 1.3% |
| Melbourne | 9,326 | 1.8% | 9,197 | 1.7% | 8,294 | 1.6% |
| Brisbane | 3,445 | 1.0% | 3,339 | 0.9% | 3,002 | 0.8% |
| Perth | 1,201 | 0.6% | 1,153 | 0.6% | 1,130 | 0.6% |
| Adelaide | 1,070 | 0.7% | 1,216 | 0.8% | 1,203 | 0.8% |
| Canberra | 961 | 1.6% | 870 | 1.4% | 688 | 1.1% |
| Darwin | 277 | 1.1% | 195 | 0.8% | 144 | 0.6% |
| Hobart | 174 | 0.6% | 112 | 0.4% | 132 | 0.5% |
| National | 38,427 | 1.3% | 37,630 | 1.2% | 34,572 | 1.1% |
Source: SQM Research
Capital city highlights
Sydney:
Vacancy rates declined to 1.3%, down from 1.5% in January, with 9,491 dwellings available.
The city continues to see strong tenant demand following the summer leasing period.
Melbourne:
Vacancy rates tightened to 1.6%, from 1.7%, with 8,294 vacancies recorded.
Rental conditions remain relatively balanced compared with other major capitals.
Brisbane:
Vacancy rates tightened slightly to 0.8%, down from 0.9%, with 3,002 dwellings available, maintaining one of the tighter markets nationally.
Perth:
Vacancy rates held steady at 0.6%, with 1,130 dwellings available.
The city continues to experience strong rental demand amid extremely limited new supply.
Adelaide:
Vacancy rates remained unchanged at 0.8%, with 1,203 vacancies recorded.
Supply constraints continue to keep rental conditions tight.
Canberra:
Vacancy rates declined to 1.1%, from 1.4%, with 688 dwellings available.
The drop reflects stronger leasing activity in early 2026.
Darwin:
Vacancy rates fell to 0.6%, down from 0.8%, with 144 dwellings vacant, marking one of the lowest vacancy levels among the capital cities.
Hobart:
Vacancy rates increased slightly to 0.5%, from 0.4%, with 132 dwellings available.
Despite the increase, Hobart remains one of the tightest rental markets nationally.
Advertised rents analysis
National advertised rents continued to rise through early March, with combined rents increasing 1.0% over the past 30 days and 6.6% higher year-on-year, reflecting ongoing supply shortages across most capital cities.
This represents an acceleration in rents compared to the same period in 2025.
The national combined rent average now stands at $688.76 per week, while the capital city average has increased to $782.57, supported by gains in both house and unit rents.
Nationally, house rents rose 1.6% for the month and 7.8% over the year, while unit rents increased 0.1% monthly and 4.6% annually, indicating steady demand for medium-density accommodation.
Sydney:
Combined rents rose 0.5% for the month and 7.3% year-on-year, driven by strong house rent growth with houses averaging $1,145.45 per week.
Melbourne:
Combined rents increased 0.8% monthly and 5.0% annually, supported by continued leasing activity across both houses and units.
Brisbane:
Combined rents rose 0.6% for the month and 8.0% over the year, reflecting sustained population inflows.
Perth:
Combined rents lifted 1.3% month-on-month and 5.5% year-on-year, highlighting the city’s ongoing rental supply shortages.
Adelaide:
Combined rents increased 0.3% for the month and 2.8% annually, with house rents averaging $690.13 per week.
Canberra:
Combined rents declined 1.1% over the month and 2.5% over the year, indicating some short-term easing in the ACT market.
Darwin:
Combined rents rose 1.9% for the month and 12.7% annually, representing one of the strongest rental growth rates nationally.
Hobart:
Combined rents increased 2.9% for the month and 12.2% year-on-year, reflecting ongoing supply constraints.
Weekly rents index
Sydney
| Property Type | Rent ($) | Weekly change | Monthly change | 12 Months change |
|---|---|---|---|---|
| All Houses | $1,145.45 | 5.55 | 0.7% | 9.2% |
| All Units | $743.84 | 0.17 | 0.2% | 5.4% |
| Combined | $906.69 | 2.39 | 0.5% | 7.3% |
Source: SQM Research
Melbourne
| Property Type | Rent ($) | Weekly change | Monthly change | 12 Months change |
|---|---|---|---|---|
| All Houses | $800.82 | 4.18 | 1.0% | 5.2% |
| All Units | $589.73 | 0.28 | 0.7% | 4.5% |
| Combined | $678.21 | 1.98 | 0.8% | 5.0% |
Source: SQM Research
Brisbane
| Property Type | Rent ($) | Weekly change | Monthly change | 12 Months change |
|---|---|---|---|---|
| All Houses | $812.46 | 2.54 | 0.9% | 8.9% |
| All Units | $630.90 | -0.89 | 0.1% | 6.8% |
| Combined | $730.67 | 0.99 | 0.6% | 8.0% |
Source: SQM Research
Perth
| Property Type | Rent ($) | Weekly change | Monthly change | 12 Months change |
|---|---|---|---|---|
| All Houses | $886.48 | 6.52 | 1.5% | 5.7% |
| All Units | $670.32 | -0.31 | 0.9% | 4.8% |
| Combined | $797.27 | 3.75 | 1.3% | 5.5% |
Source: SQM Research
Adelaide
| Property Type | Rent $) | Weekly change | Monthly change | 12 Months change |
|---|---|---|---|---|
| All Houses | $690.13 | 0.87 | 0.0% | 2.3% |
| All Units | $535.37 | -7.38 | 0.8% | 3.9% |
| Combined | $637.96 | -1.87 | 0.3% | 2.8% |
Source: SQM Research
Canberra
| Property Type | Rent ($) | Weekly change | Monthly change | 12 Months change |
|---|---|---|---|---|
| All Houses | $774.51 | -7.51 | -2.0% | -5.5% |
| All Units | $583.89 | -0.90 | -0.1% | 1.2% |
| Combined | $669.72 | -3.93 | -1.1% | -2.5% |
Source: SQM Research
Darwin
| Property Type | Rent ($) | Weekly change | Monthly change | 12 Months change |
|---|---|---|---|---|
| All Houses | $805.17 | 21.84 | 2.7% | 10.3% |
| All Units | $582.95 | -0.95 | 1.2% | 14.8% |
| Combined | $673.92 | 8.41 | 1.9% | 12.7% |
Source: SQM Research
Hobart
| Property Type | Rent 9$) | Weekly change | Monthly change | 12 Months change |
|---|---|---|---|---|
| All Houses | $610.16 | -0.16 | 2.3% | 9.0% |
| All Units | $563.08 | 7.92 | 4.0% | 17.6% |
| Combined | $591.39 | 3.06 | 2.9% | 12.2% |
Source: SQM Research
National
| Property Type | Rent ($) | Weekly change | Monthly change | 12 Months change |
|---|---|---|---|---|
| All Houses | $774.36 | 3.63 | 1.6% | 7.8% |
| All Units | $589.50 | 0.50 | 0.1% | 4.6% |
| Combined | $688.76 | 2.20 | 1.0% | 6.6% |
Source: SQM Research
Cap City Average
| Property Type | Rent ($) | Weekly change | Monthly change | 12 Months change |
|---|---|---|---|---|
| All Houses | $912.86 | 4.13 | 0.8% | 6.9% |
| All Units | $667.56 | -0.56 | 0.4% | 5.2% |
| Combined | $782.57 | 1.67 | 0.6% | 6.1% |
Source: SQM Research
Commentary
The national vacancy rate falling to 1.1% shows the rental market remains very tight across most of the country.
While some seasonal tightening is expected at this time of year, demand for rental housing is clearly continuing to outstrip available supply and so this move goes beyond normal seasonality.
Vacancy rates below one per cent in cities such as Brisbane, Perth and Darwin highlight just how constrained rental supply remains in parts of Australia.
With advertised rents continuing to accelerate higher, the data suggests tenants are still facing strong competition for available properties.
Without a meaningful lift in new housing supply and an easing in demand, rental pressures are likely to remain a feature of the market through much of 2026, which may feed into the CPI.


