


Key takeaways
Australia’s housing market is heating up, with September delivering the strongest monthly rise in national dwelling values since October 2023. The Cotality HVI jumped 0.8%, driven by capital city momentum and record-low listings.
Supply squeeze fuels price growth as listings hit historic lows. From Darwin to Brisbane, advertised stock levels are well below average- down 53% in Darwin alone - while buyer demand surges.
First home buyers face fierce competition as deposit guarantee launches. With nearly half of suburbs sitting under new price caps, the expanded Home Deposit Guarantee is unlocking opportunity- but also intensifying buyer competition amid already tight supply.
Australian housing markets are gathering strength as we head further into spring, with September marking the strongest monthly gain for national dwelling values since October 2023.
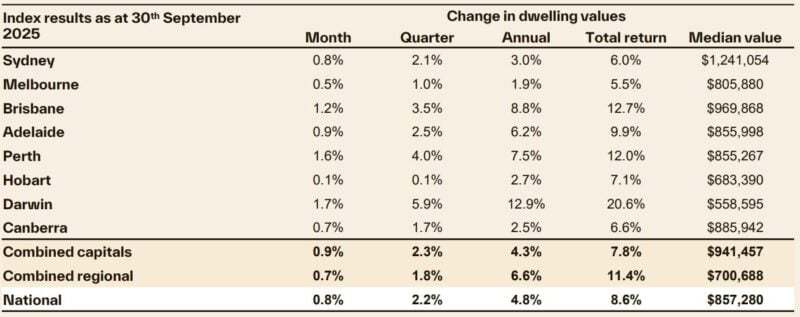
The Cotality Home Value Index (HVI) recorded a 0.8% increase in September, powered by robust growth conditions across the capital cities, where values rose 0.9% over the month.
On a quarterly basis, the national HVI increased 2.2%, up from a 1.5% lift in the June quarter and double the 1.1% increase seen over the three months to March.
In dollar terms, the September quarter rise was equivalent to a $18,215 increase in the median dwelling value.
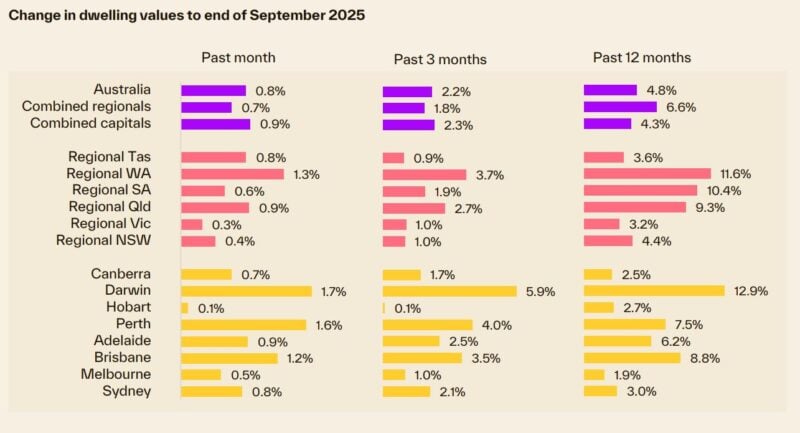
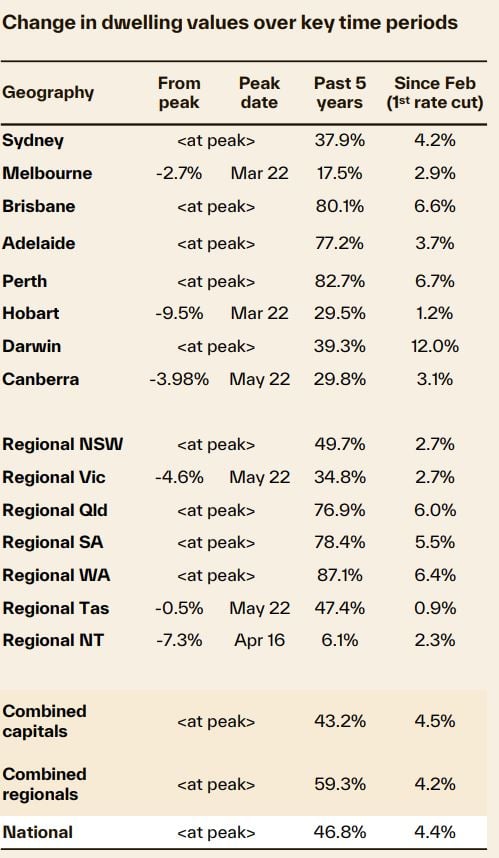
Growth has once again become broad-based, with every capital city and rest-of-state region recording an increase in dwelling values over the month, quarter and most recent 12-month period.
That being said, some divergence in the pace of growth is once again emerging.
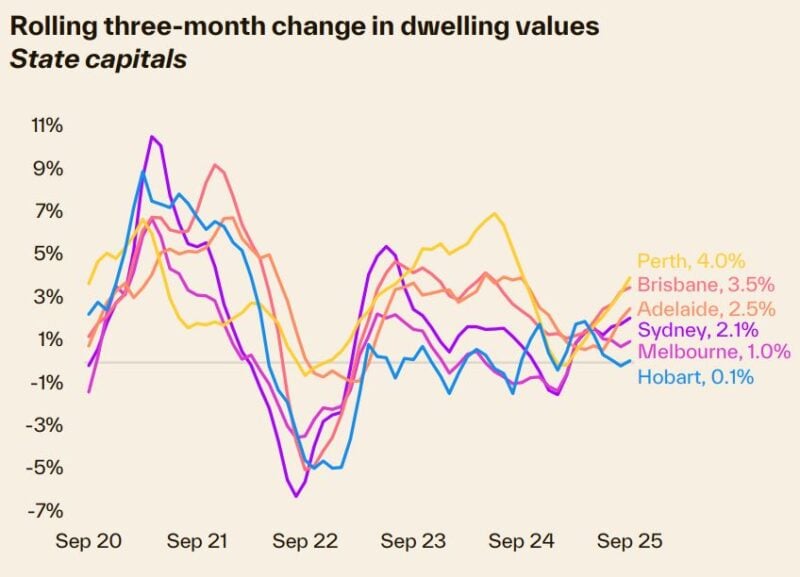
Perth and Brisbane are again pulling ahead of the larger capitals
Their values are up 4.0% and 3.5% respectively through the September quarter, with the pace of gains being led by the unit market.
Darwin is showing an even stronger run of growth with values jumping 5.9% higher over the past three months.
Each of these cities continue to show a severe lack of advertised supply.
The number of homes for sale at the end of September was about 53% lower than average in Darwin, 45% below average in Perth and down 31% in Brisbane.
At the same time, estimates for quarterly home sales are tracking above average, demonstrating a clear disconnect between demand and supply.
Most cities are seeing stronger growth rates for houses than units, with capital city values up 2.4% and 1.7% respectively through the September quarter.
However, Brisbane is the outlier, with unit values consistently rising at a faster pace than house values over the past seven quarters due to a severe supply shortage.
Perth and Hobart have also seen unit values outpace houses in the September quarter, though this trend has been less consistent than in Brisbane.
Home values have risen across each of the broad value tiers
However, the strongest pace of growth has rippled from the lower quartile of the market to the broad middle.
This is likely a reflection of increased borrowing capacity thanks to lower interest rates, which in turn is supporting demand at slightly higher price points.
Across the combined capitals, lower quartile dwelling values were up 2.6% through the September quarter, compared with a 2.7% rise across the middle of the market and a 1.8% increase in upper quartile values.
Advertised stock levels are below average across every capital city adding to the momentum in home value growth.
Over the four weeks to September 28th, capital city listings tracked about 18% below the previous five-year average.
Meanwhile, estimates of sales activity through the September quarter were 7.3% above the previous five-year average.
- Also read:Latest Property Price Forecasts Revealed. Australian Property Market Outlook 2026: Where To Now After The Rate Rise.

- Also read:March Home Prices Still Rising | Latest stats from Dr. Andrew Wilson

- Also read:National Weekly Auction Report – March 28th 2026 | Auction Clearance Rates Still Fading Over Super Week of Listings

- Also read:RBA raises interest rates again. Here’s what this means for property. | Property Insiders

- Also read:This week’s Australian Property Market Update – Latest Data, State by State March 24th 2026

The disconnect between supply and demand has seen selling conditions strengthen.
Auction clearance rates have been holding around the 70% mark since midAugust, up from an average of roughly 63% through the June quarter and 62% in the three months to March.
Outlook
The spring selling season is shaping up to be a strong one, with vendors claiming the driver's seat.
Low advertised stock levels and higher buyer demand are a recipe for solid selling conditions that will likely see prices lift further through spring and into the end of the year.
Demand is supported by lower interest rates, rising real income growth, tight labour markets and a gradual rise in sentiment.
The seventy-five basis point cut to the cash rate has played a key role in supporting housing activity.
Borrowing capacity (based on the median household income of $106,000) has increased by around 7.0% since the first rate cut in February, and lower interest rates have supported a lift in consumer sentiment, which is important for high-commitment decision-making.
Despite a minor slip in September, the monthly consumer sentiment index from Westpac and the Melbourne Institute is 12.8% higher than a year ago, with the upswing in confidence accompanied by a rise in purchasing activity.
Real wages growth, at 1.3% per annum, is at its highest level since June 2020 and is about 2 ½ times the preCOVID decade average of just 0.5% per annum.
Stronger wages growth, alongside lower debt servicing costs, should help to further support purchasing activity and sentiment.
The jobs market remains tight, with the unemployment rate holding at 4.2% in August.
The under-employment rate, at 5.7%, hasn’t been this low since 1991.
Although labour markets are expected to loosen a little, labour market conditions are expected to remain tight, which will further support housing demand and higher prices.
With the expanded Home Deposit Guarantee going live today, the opportunity to get into the market early with as little as a 5% deposit, without the added cost of LMI, is likely to be popular with prospective first home buyers.
We expect to see higher levels of demand concentrated around the new price caps in the coming months.
Amid already scarce supply, prospective first home buyers looking to utilise the deposit guarantee may be feeling anxious as competition among buyers picks up.
We could see the value of houses in well-located areas, recently unlocked by the expanded caps, surpass those new price caps quite rapidly.
As at the end of September, 49.9% of Australian suburbs had a median house value at or under the new price caps, while 93.2% of suburbs had a median unit value at or under the new price caps.
Although the outlook for housing markets is looking increasingly positive, some headwinds remain that will likely keep the rate of growth in check.
Stretched affordability is arguably the most significant factor keeping a lid on value growth.
Based on data to June, the median national dwelling value to household income ratio was only marginally off record highs at 7.9, with Sydney recording a ratio as high as 9.6.


