

Key takeaways
National listings rose 5.2% month-on-month, signalling renewed seller confidence, but remain 4.2% lower year-on-year.
Sydney and Melbourne led monthly growth, with listings up 9.8% and 11.5% respectively, though Melbourne trails year-on-year.
New listings surged nationally by 14.4%, with Sydney and Melbourne posting over 26% monthly gains.
National asking prices rose across all property types, with houses leading the charge, according to SQM Research’s Weekly Asking Prices Index for
The national average asking price for houses climbed to $1,296,482—up 2.25% from the previous week and 6.9% year-on-year.
Units followed suit, rising 1.53% weekly and 6.8% annually.
Sydney recorded the sharpest weekly increase in house asking prices, jumping 9.17% to $2,081,082.
This spike, paired with stable listing volumes, suggests renewed vendor confidence and potential upward pressure on buyer budgets heading into spring. Unit prices in Sydney also rose 2.05% weekly, reaching $867,029.
Melbourne’s house prices rose modestly (+0.77% weekly), but annual growth remains strong at 8.0%, indicating steady recovery despite softer listing volumes.
Perth and Hobart continue to show resilience, with annual house price growth of 8.2% and 6.2% respectively.
Brisbane and Canberra saw weekly declines in asking prices, down 2.37% and 2.13% for houses, despite moderate listing increases.
This divergence may reflect buyer resistance to recent price levels or a shift in demand dynamics.
Darwin posted the steepest weekly decline in house prices (-2.63%), reinforcing its position as the most volatile capital city market.
However, unit prices in Darwin rose slightly over the rolling month, suggesting some stabilisation in the lower end of the market.

Australia’s property landscape in August 2025 reflected a dynamic interplay between seasonal listing momentum and longer-term structural shifts.
Total national listings rose to 239,044—up 5.2% from July—driven by a surge in new stock across Sydney, Melbourne and Canberra.
However, the annual decline of 4.2% suggests lingering caution among sellers and buyers alike.
Sydney’s total listings remained flat year-on-year, underscoring its consistent market depth.
Melbourne, while posting the strongest monthly growth (+11.5%), saw a 4.8% annual decline, hinting at a recalibration in vendor expectations.
Brisbane’s 11.6% annual drop in listings signals a tightening market, possibly influenced by affordability constraints and migration shifts.
Darwin’s listings held steady at 1,001 in August but remain down 36.9% year-on-year— highlighting a sharp contraction in available stock. Despite low supply, distressed listings remain elevated, pointing to underlying financial strain.
Hobart saw a 3.0% monthly dip in listings to 2,721, with new stock falling 13.6%.
Annual supply is down 5.5%, yet asking prices continue to rise, suggesting resilient buyer demand amid cautious vendor activity.
Adelaide posted a 4.6% monthly rise in listings to 8,363, up 2.1% year-on-year.
New listings increased steadily, while older stock remained contained—indicating balanced market conditions and pricing alignment.
Total Listings of Properties for Sale
| City | Aug 2025 Total | July 2025 Total | Aug 2024 Total | Monthly change | Yearly Change % |
|---|---|---|---|---|---|
| Sydney | 33,798 | 30,776 | 33,790 | 9.8% | 0.0% |
| Melbourne | 39,721 | 35,618 | 41,729 | 11.5% | -4.8% |
| Brisbane | 16,106 | 15,659 | 18,224 | 2.9% | -11.6% |
| Perth | 14,824 | 13,834 | 13,078 | 3.3% | 9.2% |
| Adelaide | 8,363 | 7,993 | 8,190 | 4.6% | 2.1% |
| Canberra | 4,362 | 4,097 | 4,241 | 6.5% | 2.9% |
| Darwin | 1,001 | 997 | 1,587 | 0.4% | -36.9% |
| Hobart | 2,721 | 2,804 | 2,878 | -3.0% | -5.5% |
| National | 239,044 | 227,135 | 249,523 | 5.2% | -4.2% |
Source: SQM Research
New Listings
New listings under 30 days surged nationally by 14.4%, with Sydney and Melbourne leading the charge—up 26.4% and 27.5% respectively.
This influx of fresh stock may reflect pent-up supply following winter lulls, as well as strategic vendor timing ahead of spring campaigns.
Canberra’s 24.6% monthly rise in new listings, paired with a 7.6% annual increase, suggests
growing market confidence in the capital.
New Listings of properties for sale (less than 30 days)
| City | Aug 2025 Total | July 2025 Total | Aug 2024 Total | Monthly change | Yearly Change % |
|---|---|---|---|---|---|
| Sydney | 16,214 | 12,831 | 16,306 | 26.4% | -0.6% |
| Melbourne | 17,937 | 14,066 | 18,178 | 27.5% | -1.3% |
| Brisbane | 6,867 | 6,790 | 8,146 | 1.1% | -15.7% |
| Perth | 5,950 | 5,524 | 5,621 | 7.7% | 5.9% |
| Adelaide | 3,865 | 3,659 | 4,067 | 5.6% | -5.0% |
| Canberra | 1,916 | 1,538 | 1,780 | 24.6% | 7.6% |
| Darwin | 296 | 332 | 225 | -10.8% | 31.6% |
| Hobart | 483 | 559 | 499 | -13.6% | -3.2% |
| National | 71,815 | 62,798 | 73,665 | 14.4% | -2.5% |
Source: SQM Research
Old Listings
The rise in older listings (180+ days) across most cities points to pockets of stagnation.
Nationally, aged stock grew 5.0% month-on-month and 6.7% year-on-year.
Canberra’s 64.3% annual increase in old listings is particularly notable, potentially indicating mismatched pricing or buyer hesitancy in higher-value segments.
| City | Aug-25 | Jul-25 | Aug-24 | Monthly change | Yearly Change % |
|---|---|---|---|---|---|
| Sydney | 6,132 | 5,926 | 5,022 | 3.5% | 22.1% |
| Melbourne | 8,744 | 8,347 | 7,6924 | 4.8% | 13.7% |
| Brisbane | 1,791 | 1,680 | 1,818 | 6.6% | -1.5% |
| Perth | 1,602 | 1,558 | 1,459 | 2.8% | 9.8% |
| Adelaide | 1,176 | 1,157 | 1,115 | 1.6% | 5.5% |
| Canberra | 953 | 821 | 580 | 16.1% | 64.3% |
| Darwin | 329 | 322 | 694 | 2.2% | -52.6% |
| Hobart | 1,221 | 1,137 | 1,068 | 7.4% | 14.3% |
| National | 76,931 | 73,261 | 72,084 | 5.0% | 6.7% |
Source: SQM Research
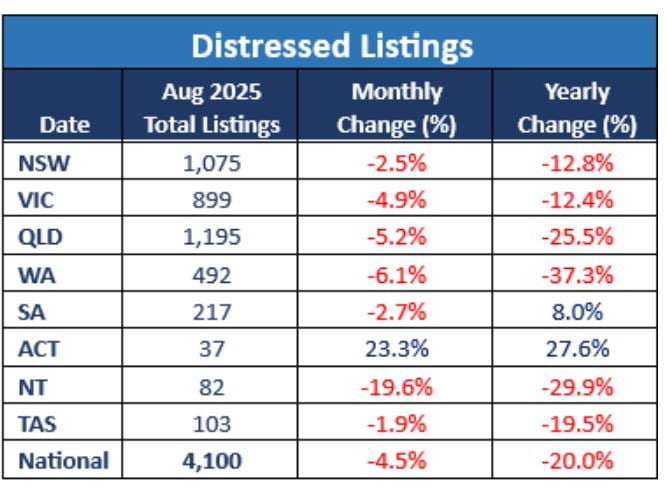
Distressed Listings
Distressed listings continued their downward trajectory, falling 4.5% nationally from July and 20.0% year-on-year.
Queensland and Western Australia saw the steepest annual declines— down 25.5% and 37.3% respectively—suggesting improved financial resilience among homeowners.
The ACT was the outlier, with distressed listings rising 23.3% month-on-month and 27.6% year-on-year, warranting closer scrutiny of local economic pressures.
Distressed Property Listings
Source: SQM Research
Asking Prices
Sydney Weekly Asking Prices Index
| Property type | Price ($) | Weekly Change | Monthly Change % | Annual % change |
|---|---|---|---|---|
| All Houses | 2,061,082 | 9.917 | 1.4% | 7.5% |
| All Units | 867,029 | 9.271 | -0.6% | 6.0% |
| Combined | 1,574,659 | 9.654 | 0.9% | 6.9% |
Source: SQM Research
Melbourne Weekly Asking Prices Index
| Property type | Price ($) | Weekly Change | Monthly Change % | Annual % change |
|---|---|---|---|---|
| All Houses | 1,295,563 | 1.369 | 0.1% | 4.6% |
| All Units | 638,243 | 1.757 | 1.0% | 4.6% |
| Combined | 1,087,776 | 1.491 | 0.3% | 4.5% |
Source: SQM Research
Perth Weekly Asking Prices Index
| Property type | Price ($) | Weekly Change | Monthly Change % | Annual % change |
|---|---|---|---|---|
| All Houses | 1,172,705 | 6.984 | 1.2% | 10.3% |
| All Units | 662,165 | -0.737 | 1.1% | 19.1% |
| Combined | 1,038,903 | 4.960 | 1.2% | 11.6% |
Source: SQM Research
Brisbane Weekly Asking Prices Index
| Property type | Price ($) | Weekly Change | Monthly Change % | Annual % change |
|---|---|---|---|---|
| All Houses | 1,279,750 | 3.303 | 1.4% | 10.4% |
| All Units | 751,179 | -0.479 | 1.1% | 16.7% |
| Combined | 1,146,770 | 2.352 | 1.4% | 11.3% |
Source: SQM Research.
Adelaide Weekly Asking Prices Index
| Property type | Price ($) | Weekly Change | Monthly Change % | Annual % change |
|---|---|---|---|---|
| All Houses | 1,058,321 | 4.352 | 0.7% | 11.9% |
| All Units | 568,192 | -0.992 | 0.4% | 21.5% |
| Combined | 966,342 | 4.189 | 0.7% | 13.5% |
Source: SQM Research
Canberra Weekly Asking Prices Index
| Property type | Price ($) | Weekly Change | Monthly Change % | Annual % change |
|---|---|---|---|---|
| All Houses | 1,229,927 | -6.565 | 0.3% | 4.6% |
| All Units | 588,940 | -0.203 | -0.5% | -0.3% |
| Combined | 990,162 | -4.185 | 0.1% | 2.9% |
Source: SQM Research
Darwin Weekly Asking Prices Index
| Property type | Price ($) | Weekly Change | Monthly Change % | Annual % change |
|---|---|---|---|---|
| All Houses | 788,039 | -2.039 | -1.2% | 20.6% |
| All Units | 437,318 | -6.318 | 1.2% | 14.5% |
| Combined | 650,178 | -3.721 | -0.6% | 18.9% |
Source: SQM Research
Hobart Weekly Asking Prices Index
| Property type | Price ($) | Weekly Change | Monthly Change % | Annual % change |
|---|---|---|---|---|
| All Houses | 851,013 | 5.168 | 1.7% | 7.6% |
| All Units | 495,424 | -1.124 | 0.3% | 0.6% |
| Combined | 796,809 | 4.209 | 1.6% | 6.9% |
Source: SQM Research
National Weekly Asking Prices Index
| Property type | Price ($) | Weekly Change | Monthly Change % | Annual % change |
|---|---|---|---|---|
| All Houses | 1,020,854 | 7.671 | 1.1% | 9.2% |
| All Units | 599,086 | 1.698 | 1.0% | 7.7% |
| Combined | 929,536 | 6.378 | 1.1% | 8.8% |
Source: SQM Research
Capital City Average Weekly Asking Prices Index
| Property type | Price ($) | Weekly Change | Monthly Change % | Annual % change |
|---|---|---|---|---|
| All Houses | 1,498,173 | 3.037 | 1.3% | 7.8% |
| All Units | 752,018 | 11.074 | 0.3% | 8.9% |
| Combined | 1,275,703 | 5.433 | 1.1% | 7.8% |
Source: SQM Research
Final note...
The August surge in listings is a seasonal lift we anticipated, but the underlying trends tell a more nuanced story.
While total national listings rose 5.2% month-on-month, we’re still down 4.2% compared to August last year.
That’s not insignificant—it suggests sellers remain cautious, and buyers are still price-sensitive."
The rise in new listings—up 14.4% nationally—is encouraging.
It means fresh stock is entering the market, which is vital for liquidity. However, the increase in older listings, particularly in Canberra where stock over 180 days jumped 64%, suggests some properties are missing the mark on pricing or presentation.
That’s a red flag for agents and vendors alike."
Overall, the market is showing signs of life, but it’s uneven.
We’re not in boom territory, and vendors need to be realistic.
Buyers are still discerning, and overpriced stock is sitting.
The spring season will be a litmus test for sentiment and price elasticity
- Also read:Sydney housing market update [video] | September 2025

- Also read:National Vacancy Rates Hold Steady at 1.2% in August | SQM Research

- Also read:The Surprising Fix for Our Housing Crisis: Property Prices Must Rise | Property Insiders

- Also read:Melbourne housing market update [video] | September 2025

- Also read:This week’s Australian Property Market Update – Latest Data, State by State September 16th 2025


