

Key takeaways
Affordability is reshaping where buyers search and how they participate in the market.
Detached houses show the biggest misalignment between buyer budgets and listing prices.
Townhouses have become the true “missing middle” and the affordability bridge.
Units are the most buyer-aligned dwelling type nationwide.
The market’s centre of gravity is shifting outward and toward medium density.
If you want to understand where Australia’s property market is truly heading, don’t just look at what’s listed; look at what buyers are actually searching for.
That’s what Domain’s latest Matching Demand report uncovers by comparing millions of buyer search budgets with the actual prices of properties listed for sale across every capital city.
And the findings are striking.
In some parts of the country, buyer expectations and listing prices are finally aligning.
In others, the gap is widening—sometimes dramatically. But everywhere, affordability pressures and shifting behaviour are reshaping how Australians participate in the market.
As Domain’s Chief of Research and Economics, Dr Nicola Powell, explains:
“We’re seeing a structural adjustment in how Australians participate in the market. Buyers are stretching, shifting outward, and reshaping their expectations faster than supply is adapting.”
This report sheds light on exactly where that adjustment is happening, and where it’s falling short.
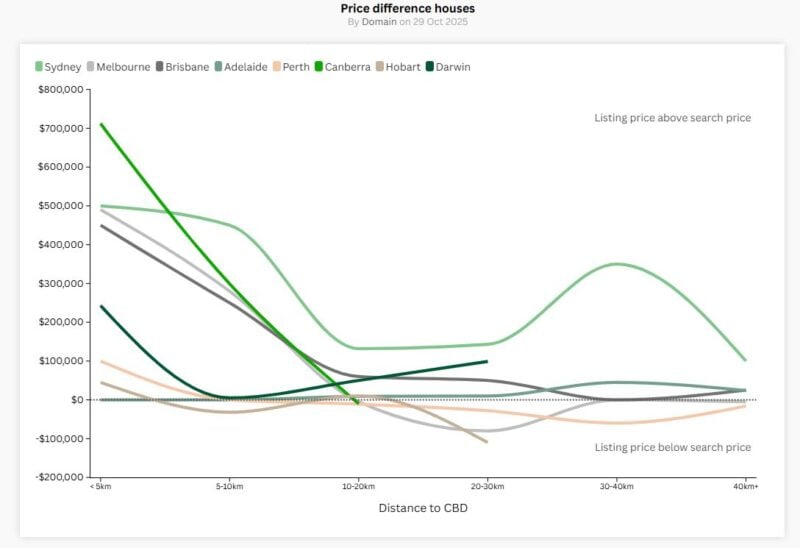
Houses: still the most aspirational and the most misaligned
According to the report, detached houses remain the dwelling type with the largest disconnect between what people want and what they can afford.
Table 1. The price difference between listing and buyer searches, houses
| Inner (0-10km from CBD) | Middle (10-20km from CBD ) | Outer (30km+ from CBD) | |||||||
| Listing | Searched | Gap | Listing | Searched | Gap | Listing | Searched | Gap | |
| Sydney | $2.8m | $2.5m | $300k | $1.8m | $1.6m | $150k | $1.3m | $1m | $280k |
| Melbourne | $1.5m | $1.2m | $300k | $800k | $900k | -$100k | $750k | $800k | -$50k |
| Brisbane | $1.5m | $1.2m | $300k | $998k | $900k | $98k | $829k | $800k | $29k |
| Adelaide | $1m | $1m | $29k | $825k | $850k | -$25k | $715k | $700k | $15k |
| Perth | $975k | $900k | $75k | $770k | $800k | -$30k | $694k | $750k | -$56k |
| Canberra | $1.8m | $1.1m | $712k | $1m | $1m | $25k | $875k | $950k | -$75k |
| Hobart | $795k | $750k | $45k | $668k | $700k | -$32k | $724k | $750k | -$26k |
| Darwin | $993k | $750k | $243k | $700k | $700k | $0 | $784k | $650k | $134k |
Across all capital cities:
-
Inner-ring houses are priced well above what buyers are searching for.
Sydney, Melbourne, Brisbane and Canberra show large gaps, evidence that the most desirable suburbs remain inaccessible for many. -
Middle-ring markets are more balanced.
In several capitals, Melbourne, Adelaide, Perth and Hobart, buyers are now searching at or even above current listing prices in these areas. That’s where affordability meets lifestyle. -
Outer suburbs show the closest alignment.
In many cities, the outer ring is where buyer search budgets finally match or exceed listings.
Sydney is the exception, where even the fringes remain above what buyers are looking for.
The report highlights a clear trend:
- The closer you are to the CBD, the bigger the affordability gap.
- The further out you go, the more balanced the market becomes.
This is the new hierarchy of Australian housing.
Townhouses: the missing middle steps up
One of the key messages in the report is the rising importance of townhouses as a bridge between lifestyle and affordability.
Because they offer more space than an apartment and more affordability than a freestanding house, townhouses are now:
-
closely aligned with buyer search budgets in many markets
-
attracting demand across middle-ring suburbs
-
becoming a preferred choice for young families, professionals and downsizers
Table 2. The price difference between listing and buyer searches, townhouses.
| City | Inner (0-10km from CBD) | Middle (10-20km from CBD) | Outer (30km+ from CBD) | ||||||
| Listing | Searched | Gap | Listing | Searched | Gap | Listing | Searched | Gap | |
| Sydney | $1.7m | $1.6m | $100k | $1.1m | $1.1m | $0 | $1m | $850k | $170k |
| Melbourne | $1m | $850k | $150k | $850k | $750k | $100k | $660k | $650k | $10k |
| Brisbane | $900k | $900k | $0 | $676k | $750k | -$74k | $600k | $650k | -$50k |
| Adelaide | $754k | $850k | -$96k | $660k | $750k | -$90k | $560k | $650k | -$90k |
| Perth | $799k | $800k | -$1k | $750k | $800k | -$50k | $672k | $700k | -$28k |
| Canberra | $1.3m | $900k | $350k | $730k | $800k | -$70k | $689k | $700k | -$11k |
The report shows:
-
Inner-ring townhouses still command a premium, especially in Sydney, Melbourne and Canberra, due to scarcity and strong owner-occupier demand.
-
Middle-ring suburbs are the balance point, where townhouse listings and buyer budgets most closely meet.
-
In Adelaide, Brisbane and Perth, buyers are already searching above listing prices for townhouses, signalling tightening markets and strong demand for medium-density living.
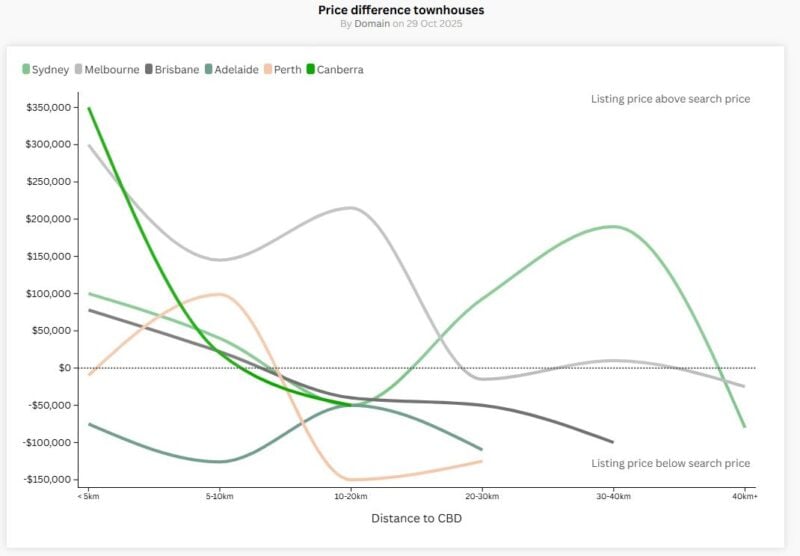
Townhouses, long discussed as the “missing middle,” are quickly becoming the backbone of affordability in our urban housing mix.
Units: the most balanced segment of the market
The report makes one thing very clear: units are now the most buyer-aligned dwelling type across the country.
Table 3. The price difference between listing and buyer searches, units
| Inner (0-10km from CBD) | Middle (10-20km from CBD) | Outer (30+km from CBD) | |||||||
| Listing | Searched | Gap | Listing | Searched | Gap | Listing | Searched | Gap | |
| Sydney | $965k | $950k | $15k | $715k | $750k | -$35k | $646k | $700k | -$54k |
| Melbourne | $600k | $600k | $0 | $590k | $600k | -$10k | $570k | $600k | -$30k |
| Brisbane | $700k | $750k | -$50k | $550k | $650k | -$100k | $630k | $700k | -$70k |
| Adelaide | $550k | $600k | -$50k | $550k | $600k | -$50k | $469k | $550k | -$81k |
| Perth | $540k | $600k | -$60k | $525k | $600k | -$75k | $487k | $500k | -$13k |
| Canberra | $625k | $700k | -$75k | $479k | $600k | -$121k | - | - | - |
| Hobart | $562k | $650k | -$88k | $501k | $650k | -$149k | $480k | $650k | -$170k |
| Darwin | $450k | $500k | -$50k | $360k | $400k | -$40k | - | - | - |
Two forces are driving this:
-
Buyers priced out of houses and townhouses are shifting into the apartment market.
-
Many are searching for better-quality apartments than currently exist, meaning search budgets often exceed existing stock.
Across most capital cities:
-
Buyer search budgets meet or exceed listing prices in the middle and outer rings.
-
Even inner suburbs show only modest premiums in markets like Sydney.
-
Brisbane, Adelaide, Hobart and Canberra are dominated by buyer-led conditions, with search budgets far above typical listings.
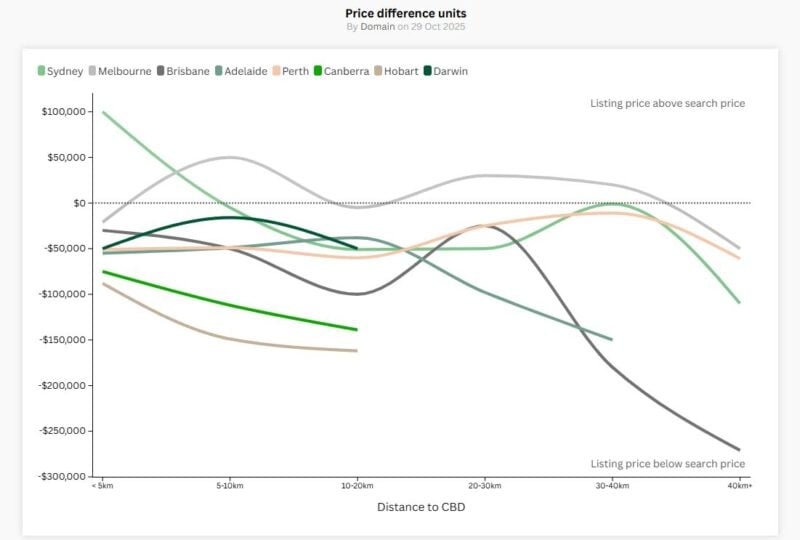
This doesn’t indicate underpricing, it reflects the gap between what buyers want and what the current apartment stock delivers.
Modern buyers want:
- Also read:National Weekly Auction Report – March 28th 2026 | Auction Clearance Rates Still Fading Over Super Week of Listings

- Also read:RBA raises interest rates again. Here’s what this means for property. | Property Insiders

- Also read:This week’s Australian Property Market Update – Latest Data, State by State March 24th 2026

- Also read:Latest Property Price Forecasts Revealed. Australian Property Market Outlook 2026: Where To Now After The Rate Rise.

- Also read:Perth housing market update | March 2026

-
larger floorplans
-
good natural light
-
quality construction
-
strong local amenity
-
walkability and transport access
And many older apartments simply don’t meet those expectations.
Where the gaps Are largest and why it matters
The report highlights three clear patterns across Australia:
1. Prestige suburbs still operate in a world of their own
Blue-chip pockets in Sydney, Melbourne and Canberra show enormous gaps between listing prices and what buyers search for.
These markets are driven by scarcity, wealth concentration and low turnover, so alignment is unlikely anytime soon.
2. Middle-ring suburbs are the most efficient markets
This is where buyer budgets and listings are most in sync across houses, townhouses and units.
These areas offer the best mix of affordability, amenity and improved infrastructure.
3. Outer suburbs are increasingly buyer-led
In many capitals, buyers are searching above current listing prices, which often signals the early stages of tightening markets and rising competition.
Taken together, the findings from Domain’s Matching Demand report show a structural shift:
-
Distance from the CBD still matters, but not in the way it used to.
-
Buyers are more mobile, more flexible, and more willing to compromise on location.
-
Medium-density housing, particularly townhouses, is becoming essential.
-
Units are stabilising as buyers redirect budgets and raise expectations.
-
Sydney remains the nation’s clear outlier, with affordability stretched almost everywhere.
As Dr Nicola Powell rightly notes:
“Affordability has become the defining force in shaping where and how Australians search for property.”
And that means search behaviour isn’t just a snapshot, it’s a leading indicator.
What this means for you
For property investors
Use buyer search behaviour as an early signal for emerging demand.
When buyers are searching above listing prices, competition is tightening and growth may not be far behind.
For homeowners
Be precise with pricing.
Today’s buyers know exactly what their borrowing capacity is and they won’t stretch beyond it.
For buyers
Be open to new dwelling types or slightly wider geographies.
The most balanced and opportunity-rich markets aren’t always the closest to the CBD.
Final word
Domain’s Matching Demand report doesn’t just highlight price trends, it reflects the psychology of the market.
It shows how Australians are responding to affordability constraints, adjusting expectations, and reshaping the demand landscape in real time.
And right now, the market is rebalancing.
Those who understand these shifts, not just the numbers, will make the smartest property decisions in the years ahead.


