Key takeaways
Spring has officially sprung – and you can feel the shift in the property market.
Confidence is quietly building, listings are starting to pick up, and buyers are showing they’re ready to compete again.
Over August, national home values kept climbing, notching up the strongest monthly gain since May which is exactly what you’d expect in a market where interest rates have come down a notch and listings remain relatively scarce.
With all eyes now on the September 30 RBA meeting, most economists are tipping a “steady as she goes” approach, with the next trim possible in November.
Either way, the rate backdrop is helping buyers’ confidence, even as the RBA keeps an eye on household spending.
Vendors are feeling bolder. SQM’s asking price index shows capital-city house prices up 1.7% over the past month, as sellers test the waters of a strengthening spring market.
This week, Cotality also reports that:
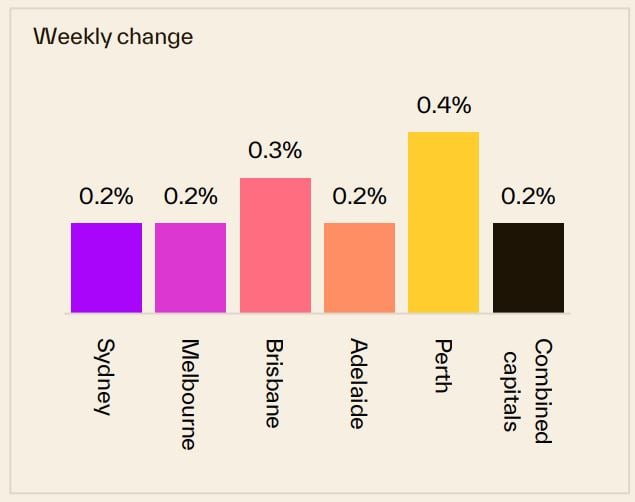
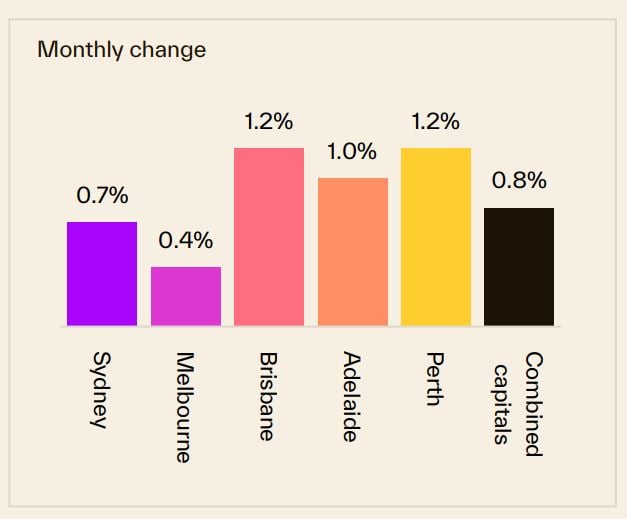
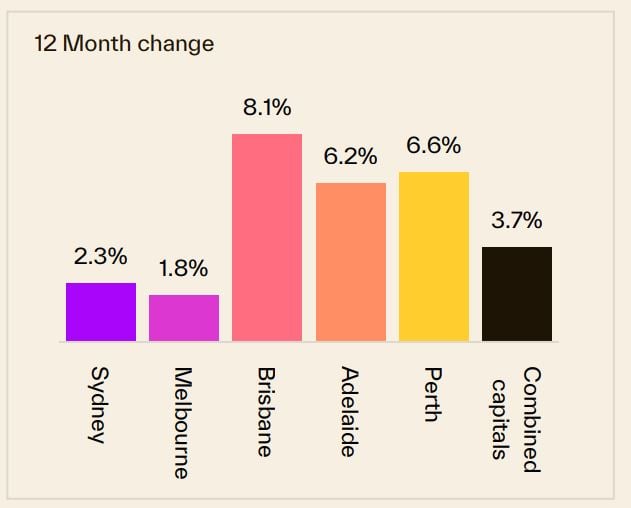
*Sydney property prices increased 0.2% over the last week, increased 0.7% over the last month and are 2.3% higher than they were 12 months ago.
*Melbourne property prices increased 0.2% over the last week, increased 0.4% over the last month, and increased 1.8% compared to 12 months ago.
*Brisbane property prices increased 0.3% over the last week, increased 1.2% over the last month and are 8.1% higher than they were 12 months ago.
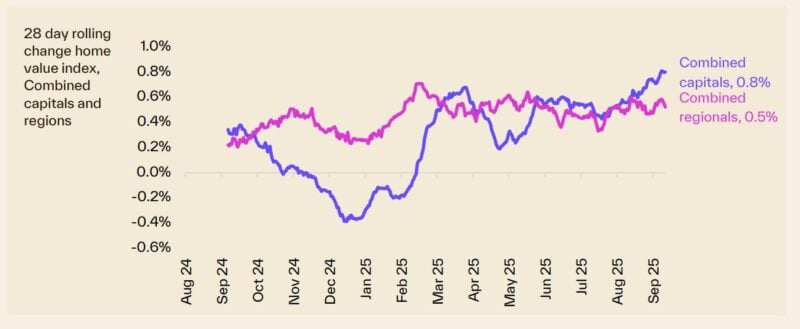
Overall, Australian capital dwelling prices increased 0.8% over the last month and are now 3.7% higher than they were 12 months ago.
The spring selling season is gathering momentum, with 2,455 homes taken to auction last week, the highest volume since the first week of June.
Continuing the subtle easing seen the week prior, the combined capitals early success rate dipped to 74.8% last week, falling below the 75% mark for the first time in five weeks.
This current property cycle has been driven by an undersupply of good properties relative to current demand pushing up property values and rents there was nothing to suggest there will be any significant change in the near future.
Unfortunately, the undersupply properties is going to persist for some time with all commentators agreeing that there is no way we're going to hit the housing construction targets required to meet our demand.
Spring has officially sprung – and you can feel the shift in the property market.
Confidence is quietly building, listings are starting to pick up, and buyers are showing they’re ready to compete again.
Over August, national home values kept climbing, notching up the strongest monthly gain since May which is exactly what you’d expect in a market where interest rates have come down a notch and listings remain relatively scarce.
Speaking of rates, the Reserve Bank left the cash rate at 3.60% after August’s cut, and all eyes are now on the September 30 meeting.
Most economists are tipping a “steady as she goes” approach, with the next trim possible in November.
Either way, the rate backdrop is helping buyers’ confidence, even as the RBA keeps an eye on household spending.
On the ground, the spring auction season is gathering steam.
More homes are being scheduled for sale across the capitals, and clearance rates over the next fortnight will give us a good read on just how much depth there is in buyer demand.
Meanwhile, renters are still doing it tough. National vacancy rates are stuck at a painfully low 1.2%, and rents have been inching higher in most cities through September.
Investors who hold the right assets are still enjoying strong competition from tenants.
Vendors, too, are feeling bolder. SQM’s asking price index shows capital-city house prices up 1.7% over the past month, as sellers test the waters of a strengthening spring market.
But one thing hasn’t changed – the supply pipeline. The latest ABS data shows building approvals fell 8.2% in July, dragged down by another slump in medium-to-high-density projects.
That’s the underlying issue that won’t go away anytime soon and the reason I remain confident in the outlook for established, investment-grade properties.
On the auction front this week... clearance rates wilt as auction activity ramps up
The spring selling season is gathering momentum, with 2,455 homes taken to auction last week, the highest volume since the first week of June.
Continuing the subtle easing seen the week prior, the combined capitals early success rate dipped to 74.8% last week, falling below the 75% mark for the first time in five weeks.
This week, Cotality also reports that:
- Sydney property prices increased 0.2% over the last week, increased 0.7% over the last month and are 2.3% higher than they were 12 months ago.
- Melbourne property prices increased 0.2% over the last week, increased 0.4% over the last month, and increased 1.8% compared to 12 months ago.
- Brisbane property prices increased 0.3% over the last week, increased 1.2% over the last month and are 8.1% higher than they were 12 months ago.
Overall, Australian capital dwelling prices increased 0.8% over the last month and are now 3.7% higher than they were 12 months ago.
Clearly, the property cycle is moving on but our markets are very fragmented.
Source: Cotality September 15th 2025
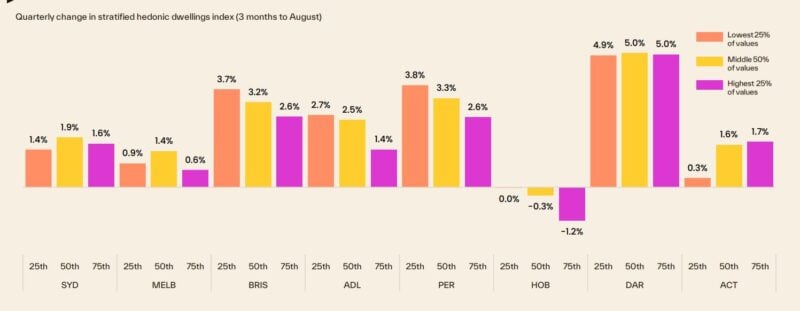
Of course, these are "overall" figures - there is not one Sydney or Melbourne or Brisbane property market.
And various segments of each market are performing differently.
At the beginning of this cycle the upper quartile of the market lead the upswing but last year the lower quartile across every capital city recorded a stronger outcome for housing values relative to its upper quartile counterpart.
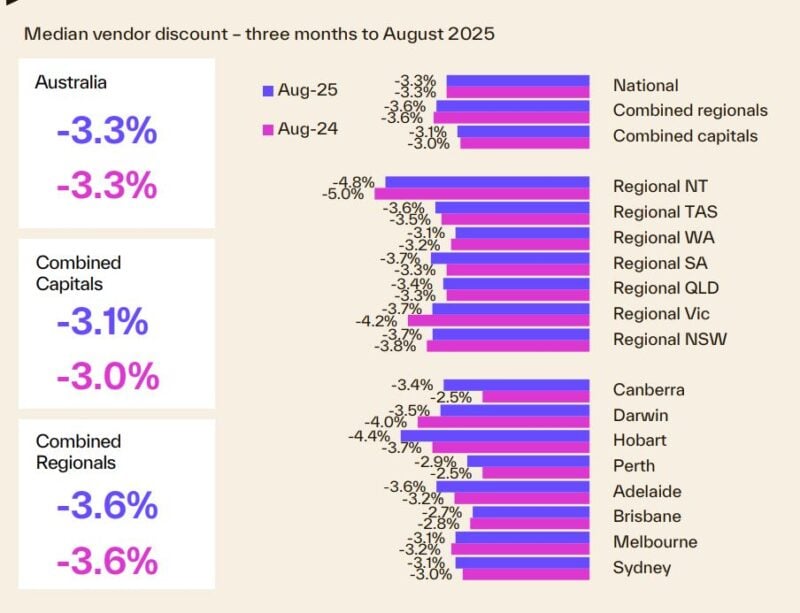
The following chart shows how various segments of each capital city market are performing differently with median-priced properties performing well.
To help keep you up-to-date with all that's happening in property, here is my updated weekly analysis of data and charts as of 15th September 2025 provided by SQM Research, Cotality, and realestate.com.au.
Current property asking prices
Property asking prices are a useful leading indicator for housing markets - giving a good indication of what's ahead.
Here is the latest data available:
Sydney
| Property type | Price ($) | Weekly Change | Monthly Change % | Annual % change |
|---|---|---|---|---|
| All Houses | 2,072,787 | 11.706 | 2.3% | 8.9% |
| All Units | 870,764 | 3.735 | -0.4% | 6.5% |
| Combined | 1,582,826 | 8.167 | 1.6% | 8.1% |
Source: SQM Research
Melbourne
| Property type | Price ($) | Weekly Change | Monthly Change % | Annual % change |
|---|---|---|---|---|
| All Houses | 1,299,894 | 4.331 | 0.3% | 5.2% |
| All Units | 640,372 | 2.128 | 1.1% | 5.3% |
| Combined | 1,091,321 | 3.546 | 0.5% | 5.0% |
Source: SQM Research
Brisbane
| Property type | Price ($) | Weekly Change | Monthly Change % | Annual % change |
|---|---|---|---|---|
| All Houses | 1,282,210 | 2.459 | 1.3% | 9.7% |
| All Units | 762,189 | 11.011 | 2.0% | 18.1% |
| Combined | 1,151,304 | 4.534 | 1.4% | 10.9% |
Source: SQM Research
Perth
| Property type | Price ($) | Weekly Change | Monthly Change % | Annual % change |
|---|---|---|---|---|
| All Houses | 1,174,148 | 1.442 | 0.8% | 9.1% |
| All Units | 663,489 | 1.324 | 0.8% | 19.3% |
| Combined | 1,040,269 | 1.366 | 0.8% | 10.6% |
Source: SQM Research
Adelaide
| Property type | Price ($) | Weekly Change | Monthly Change % | Annual % change |
|---|---|---|---|---|
| All Houses | 1,055,967 | -2.353 | 0.1% | 10.5% |
| All Units | 565,811 | -2.381 | 0.4% | 20.0% |
| Combined | 967,746 | -2.384 | 0.2% | 11.4% |
Source: SQM Research
Canberra
| Property type | Price ($) | Weekly Change | Monthly Change % | Annual % change |
|---|---|---|---|---|
| All Houses | 1,224,264 | -5.664 | -0.5% | 5.4% |
| All Units | 584,276 | -4.664 | -1.1% | -0.9% |
| Combined | 984,402 | -5.760 | -0.7% | 3.4% |
Source: SQM Research
Darwin
| Property type | Price ($) | Weekly Change | Monthly Change % | Annual % change |
|---|---|---|---|---|
| All Houses | 787,019 | -1.019 | -0.9% | 18.9% |
| All Units | 441,097 | 3.778 | 1.4% | 15.0% |
| Combined | 651,025 | 0.846 | -0.3% | 17.8% |
Source: SQM Research
Hobart
| Property type | Price ($) | Weekly Change | Monthly Change % | Annual % change |
|---|---|---|---|---|
| All Houses | 848,461 | -2.552 | 1.1% | 8.2% |
| All Units | 494,112 | -1.312 | -0.1% | 0.9% |
| Combined | 794,417 | -2.392 | 1.0% | 7.4% |
Source: SQM Research
National
| Property type | Price ($) | Weekly Change | Monthly Change % | Annual % change |
|---|---|---|---|---|
| All Houses | 1,026,167 | 5.313 | 1.9% | 9.7% |
| All Units | 602,354 | 3.268 | 0.8% | 7.8% |
| Combined | 934,340 | 4.804 | 1.7% | 9.3% |
Source: SQM Research
Cap City Average
| Property type | Price ($) | Weekly Change | Monthly Change % | Annual % change |
|---|---|---|---|---|
| All Houses | 1,503,361 | 5.188 | 1.7% | 8.6% |
| All Units | 753,842 | 1.824 | 0.5% | 8.9% |
| Combined | 1,279,717 | 4.015 | 1.4% | 8.5% |
Source: SQM Research
The value of property asking prices as a leading indicator for housing markets is quite significant.
In fact it's more valuable than median prices which can be quite misleading.
Let's delve into why this is the case and how it impacts the real estate market.
- Early Market Sentiment Indicator: Asking prices often reflect the current sentiment of sellers in the real estate market.
If sellers are confident, they might set higher asking prices, anticipating strong demand.
Conversely, if sellers are uncertain or perceive a market downturn, they might lower their asking prices to attract buyers.
This makes asking prices a real-time indicator of market sentiment, often preceding changes in actual sales prices. - Predictive of Future Price Trends: Trends in asking prices can be predictive of where the actual property prices are headed.
For example, a consistent rise in asking prices over a period can signal an upcoming rise in transaction prices. - Impact of Economic Factors: Economic factors such as interest rates, employment rates, and broader economic health influence asking prices.
For instance, changes in the Reserve Bank of Australia's policies or shifts in the job market can quickly reflect in the asking prices, providing insights into how these factors are influencing the housing market. - Regional Variations: In a diverse market like Australia's, asking prices can also provide insights into regional disparities.
For instance, the property markets in Melbourne and Sydney might behave differently from those in Brisbane or Perth. Asking prices can give early indications of these regional trends. - Influence of Supply and Demand: Asking prices are also a response to the balance of supply and demand in the market.
In areas with limited supply and high demand, asking prices tend to be higher and vice versa.
However, it's important to note that while asking prices are a valuable indicator, they should not be used in isolation.
Other factors like actual sales prices, time on the market, auction clearance rates, and economic conditions also play crucial roles in understanding the property market dynamics.
READ MORE: The latest median property prices in Australia’s major cities
Last weekend's auction report
Clearance rates wilt as auction activity ramps up
- Also read:This week’s Australian Property Market Update – Latest Data, State by State September 16th 2025

- Also read:Melbourne property market forecast for 2026 | Is it a good time to invest in Melbourne?

- Also read:Latest Property Price Forecasts Revealed. Australian Property Market Outlook 2025–26: Where Prices Are Headed After Three Rate Cuts.

- Also read:Sydney property market forecast for 2026. Is it a good time to invest in Sydney?

- Also read:Brisbane Property Market Forecast [2026] – What’s Ahead & Where to Invest

The spring selling season is gathering momentum, with 2,455 homes taken to auction last week, the highest volume since the first week of June.
Preliminary clearance rates eased off a little through the first two weeks of spring, suggesting demand isn’t quite keeping up with the additional supply of stock coming to market.
Continuing the subtle easing seen the week prior, the combined capitals early success rate dipped to 74.8% last week, falling below the 75% mark for the first time in five weeks.
Despite the subtle easing in the preliminary clearance rate, at 74.8%, the early clearance rate is still a strong result, beating the winter average of 72.7%.
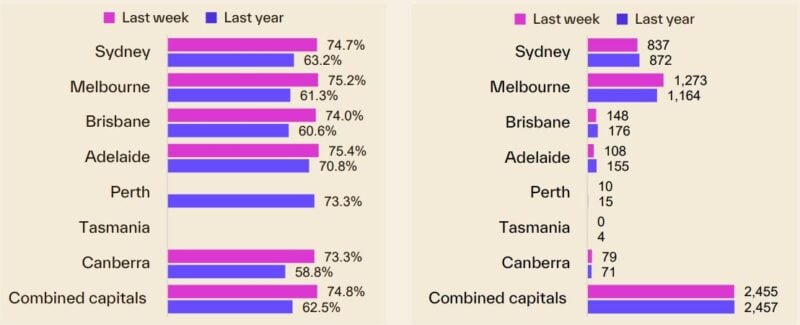
Auction activity across Melbourne held above the 1,000 mark for the third week in a row, with 1,273 auctions held across city.
Compared to the previous week, last week’s numbers were up 17.3% and was 9.4% higher than the same week last year.
Bucking the broader trend, Melbourne’s preliminary clearance rate rose to 75.2% last week, up from 73.2% the week prior.
837 homes were taken to auction in Sydney last week, the highest weekly volume since the first week of June, although -4.0% lower than a year ago.
At 74.7%, last week was Sydney’s lowest preliminary clearance rate in five weeks, with the early success rate easing for the second week from a recent high of 80.3% in the last week of August.
Brisbane hosted the highest volume of auctions across the smaller capitals, with 148 homes going under the hammer last week, four more than the week prior.
While down slightly on the week prior (76.5%), last week was the second week in a row where the preliminary clearance rate has held above the 70% mark at 74.0%.
108 auctions were held in Adelaide last week, the highest volume in thirteen weeks.
Based on the results collected so far, 75.4% of auctions have returned a successful result — up from 74.5% the week prior and the city’s highest preliminary clearance rate since the week ending August 17th.
The ACT hosted its busiest week since late May, with 79 homes auctioned last week. 73.3% of results collected so far have sold, up from 71.9% the previous week.
The volume of auctions is set to rise further this week, with around 2,630 homes scheduled to go under the hammer.
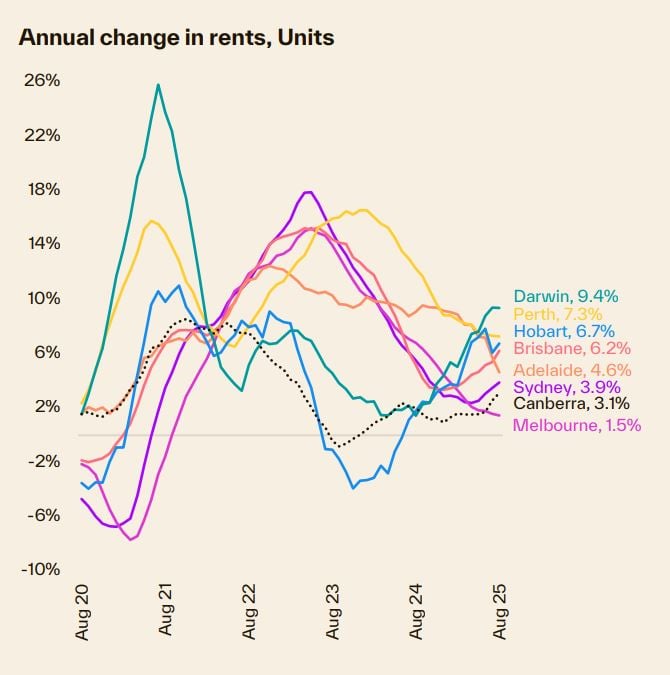
Our rental markets
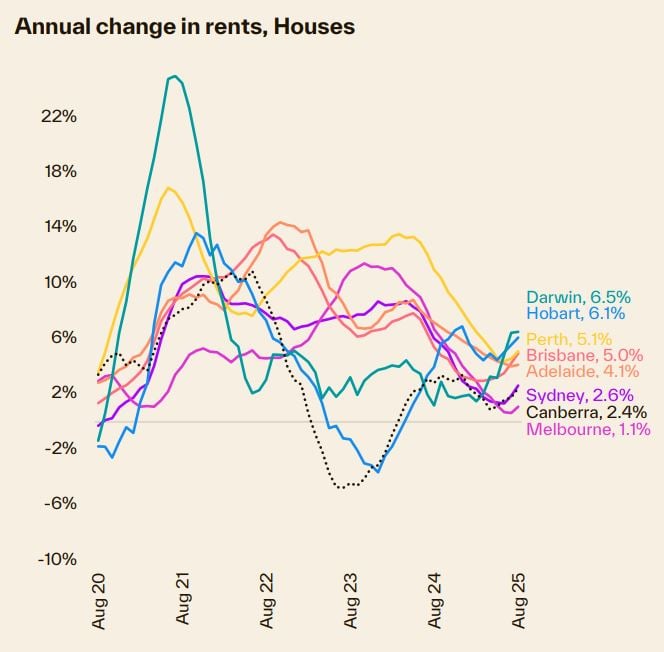
According to Cotality, national rental growth picked up to 0.5% in seasonally adjusted terms through August, the largest month on month rise since May last year.
The re-acceleration in rental growth has been apparent through most of 2025, with the annual change now rising over two consecutive months, reaching 4.1% in August.
Rental markets remain extremely tight across most regions, with the national vacancy rate at 1.5% in August which is around record lows.
The five years prior to 2020 recorded an average vacancy rate of 3.3%, more than double the current level.
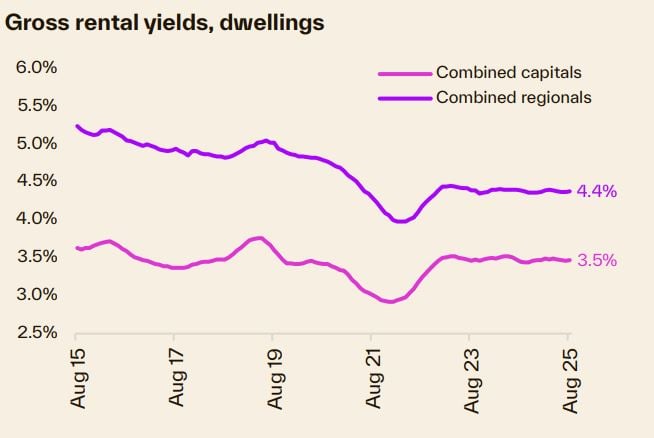
Despite the ongoing rise in rental values, gross rental yields have held reasonably firm since the beginning of 2023,
following the drop in yields when value growth substantially outpaced rental growth through the pandemic.
Sydney
| Property Type | Rent ($) | Weekly change | Monthly change | 12 Months change |
|---|---|---|---|---|
| All Houses | $1,084.20 | 4.80 | 0.7% | 5.2% |
| All Units | $716.26 | 0.74 | 0.7% | 3.3% |
| Combined | $865.47 | 2.38 | 0.7% | 4.2% |
Source: SQM Research
Melbourne
| Property Type | Rent ($) | Weekly change | Monthly change | 12 Months change |
|---|---|---|---|---|
| All Houses | $766.14 | 0.86 | -0.3% | 2.9% |
| All Units | $575.63 | -0.63 | -0.1% | 3.1% |
| Combined | $655.09 | -0.01 | -0.2% | 3.1% |
Source: SQM Research
Brisbane
| Property Type | Rent ($) | Weekly change | Monthly change | 12 Months change |
|---|---|---|---|---|
| All Houses | $770.46 | -4.46 | 0.3% | 6.4% |
| All Units | $613.29 | 0.71 | 0.1% | 7.5% |
| Combined | $699.71 | -2.13 | 0.2% | 6.9% |
Source: SQM Research
Perth
| Property Type | Rent ($) | Weekly change | Monthly change | 12 Months change |
|---|---|---|---|---|
| All Houses | $821.07 | 1.93 | -1.1% | 5.1% |
| All Units | $648.24 | -1.24 | 0.2% | 6.7% |
| Combined | $749.51 | 0.62 | -0.6% | 5.7% |
Source: SQM Research
Adelaide
| Property Type | Rent $) | Weekly change | Monthly change | 12 Months change |
|---|---|---|---|---|
| All Houses | $665.54 | -3.54 | -0.3% | 1.1% |
| All Units | $524.14 | -10.14 | -0.6% | 3.5% |
| Combined | $617.62 | -5.77 | -0.4% | 1.9% |
Source: SQM Research
Canberra
| Property Type | Rent ($) | Weekly change | Monthly change | 12 Months change |
|---|---|---|---|---|
| All Houses | $775.52 | -4.52 | 0.1% | 1.2% |
| All Units | $569.78 | -1.78 | -2.2% | 2.0% |
| Combined | $662.96 | -3.02 | -1.0% | 1.5% |
Source: SQM Research
Darwin
| Property Type | Rent ($) | Weekly change | Monthly change | 12 Months change |
|---|---|---|---|---|
| All Houses | $734.10 | -23.10 | -5.6% | -1.6% |
| All Units | $573.01 | -5.01 | 1.8% | 13.2% |
| Combined | $638.81 | -12.40 | -1.8% | 5.9% |
Source: SQM Research
Hobart
| Property Type | Rent 9$) | Weekly change | Monthly change | 12 Months change |
|---|---|---|---|---|
| All Houses | $586.14 | 3.86 | 0.5% | 10.5% |
| All Units | $495.61 | -17.61 | -0.8% | 8.1% |
| Combined | $550.01 | -4.71 | 0.0% | 9.7% |
Source: SQM Research
National
| Property Type | Rent ($) | Weekly change | Monthly change | 12 Months change |
|---|---|---|---|---|
| All Houses | $725.00 | 1.00 | 0.3% | 4.3% |
| All Units | $569.00 | -3.00 | 0.0% | 3.6% |
| Combined | $652.69 | -0.85 | 0.2% | 4.1% |
Source: SQM Research
Cap City Average
| Property Type | Rent ($) | Weekly change | Monthly change | 12 Months change |
|---|---|---|---|---|
| All Houses | $867.00 | 4.00 | 0.2% | 4.6% |
| All Units | $646.00 | -1.00 | 0.2% | 3.9% |
| Combined | $749.51 | 1.34 | 0.2% | 4.3% |
Source: SQM Research
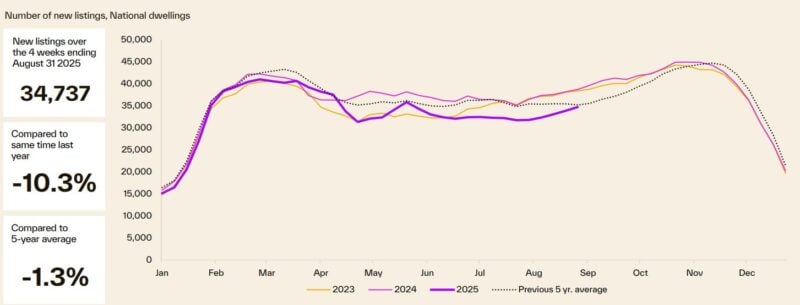
Sellers of good properties are on strike
The flow of new listings gained momentum in the final month of winter, with 34,737 newly advertised properties observed nationally over the four weeks to August 31st.
While down -10.3% from the level seen this time last year, and -1.3% shy of the previous five-year average, listing activity rose 9.4% in August, with easing interest rates, rising sentiment and stronger capital gain conditions setting the stage for a cracking spring selling season.
Despite freshly advertised stock shifting higher, total stock levels have continued to decline, with just 118,380 property observed for sale nationally, over the four weeks to August 31st.
Since the start of winter, total listing levels have declined from -14.0% below the five-year average, to -20.2% below average, with properties being absorbed from the market faster from the market then they are added.
Compared to this time last year, the 28-day count of listings is down -13.3%.
Vendor metrics
As the following chart shows, it's taking longer to sell a home.
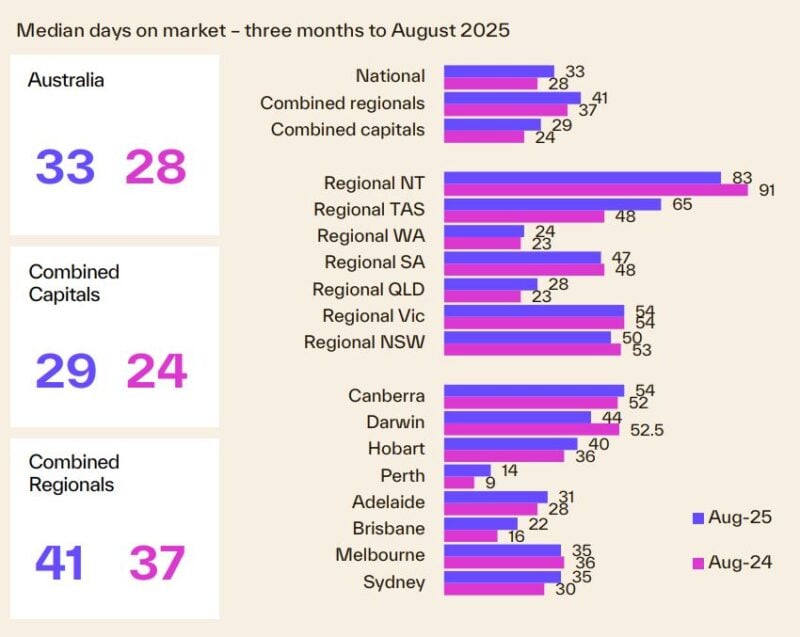
Despite seeing favourable value growth and sales activity, properties are taking longer to sell with the median time on market rising from 29 days over the three months to April, to 33 days in the August quarter.
Perth continues to see the shortest selling times with a median time on market of 14 days.
Meanwhile properties in Canberra (54 days) have seen the longest selling times across the capitals, after overtaking Darwin (44 days) back in April.