

Key takeaways
National home prices rose 0.5% in September, marking the ninth consecutive month of growth and taking home values to a record high.
National home prices are up 6.2% over the past year, adding around $54,100 to the value of the median home, and have surged 50.6% in the past five years.
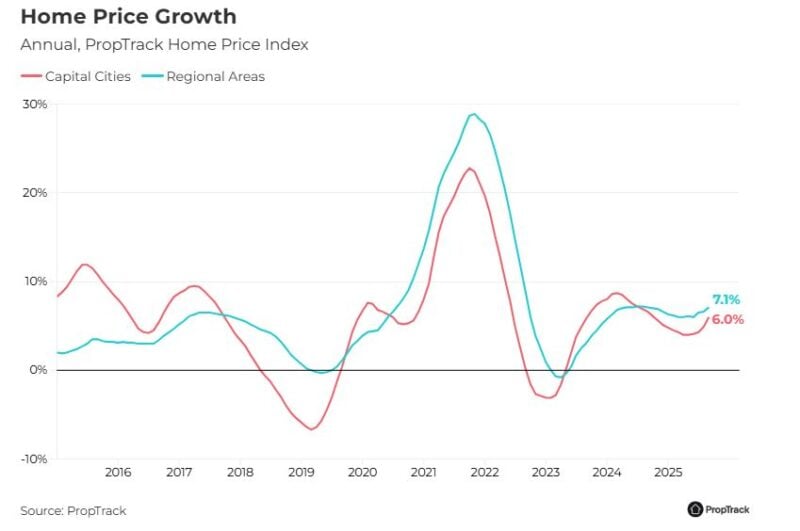
Capital city prices rose 0.6% in September and are up 6.0% year-on-year, with values at record highs.
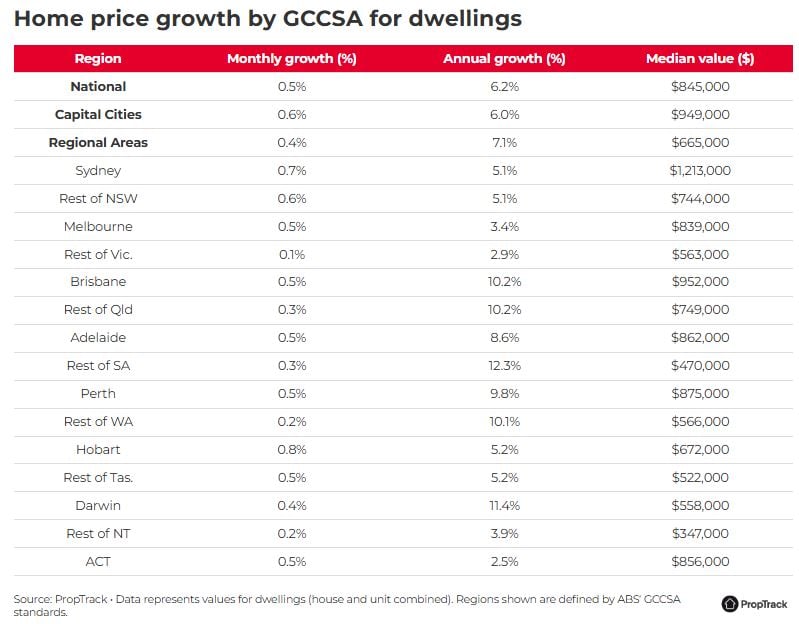
Among the capitals, Hobart (+0.8%) and Sydney (+0.7%) led monthly growth. All capitals apart from Hobart (–5.4% below peak) and Canberra (–1.3% below peak) are now sitting at record highs.
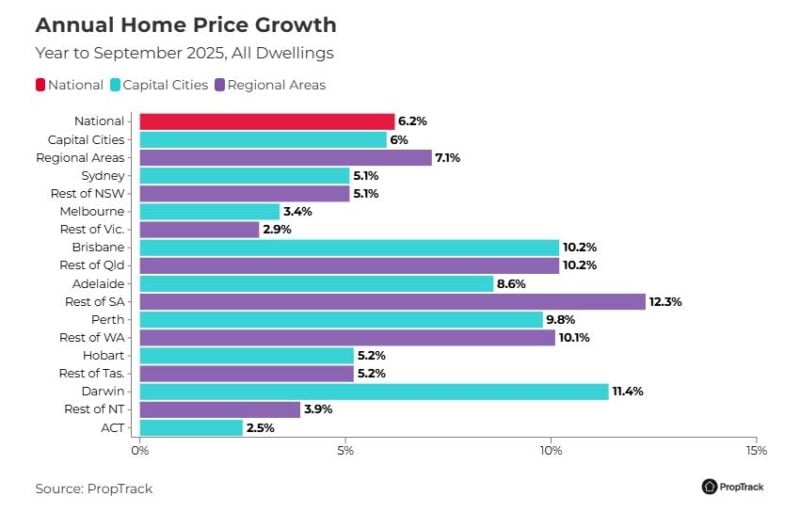
Over the past year, Darwin (+11.4%), Brisbane (+10.2%), regional South Australia (+12.3%), and regional Queensland (+10.2%) recorded the strongest gains.
Melbourne prices have now fully recovered their 2022 peak, returning to record highs after several years of underperformance.
Hobart is rebounding after a period of underperformance, leading monthly gains in September and showing one of the sharpest annual accelerations in price growth across the capitals.
Regional prices climbed 0.4% in September and are up 7.1% year-on-year, outpacing the capitals over the past year and five years (64.4% vs 46.5%), bolstered by relative affordability and lifestyle appeal.
National home prices rose 0.5% in September, extending the upswing to a ninth straight month and lifting values 6.2% higher than a year ago, according to PropTrack.
PropTrack data shows that the housing market remains on a firm upward trajectory this spring selling season.
National home prices rose 0.5% in September, extending the upswing to a ninth straight month and lifting values 6.2% higher than a year ago.
Eleanor Creagh, Senior Economist at PropTrack said:
"The combination of increased borrowing capacities and lower borrowing costs, stronger buyer confidence and renewed competition is underpinning a broad and synchronised uplift.
Home values are lifting in every capital city and regional area, but momentum is shifting.
Price growth in Sydney and Melbourne is re-accelerating, Hobart is rebounding, and Darwin is leading annual gains amid surging investor activity."
House and unit prices lift in September
The report also shows that nationally, house and unit prices are now rising at a similar pace, house prices lifted 0.5% in September, while unit prices nationally rose 0.6%.
National house prices have lifted 6.3% over the past year, while growth in unit values (6.1% year-on-year) has been comparable.
- Also read:Everything you need to know about the state of Australia’s property markets in 20 charts – April 2026

- Also read:National Weekly Auction Report – April 11th 2026 | Auction Markets Steady After Easter with School Holiday Listings

- Also read:Latest Property Asking Prices State by State | National Listings Rise in March
- Also read:Latest Property Price Forecasts Revealed. Australian Property Market Outlook 2026: Where To Now After The Rate Rise.

- Also read:March Home Prices Still Rising | Latest stats from Dr. Andrew Wilson

Ms Creah further said:
"Since the pandemic onset, house values are up 54.1% vs. just 40.5% for units. This highlights the stronger performance of houses over the medium term, driven by increased demand for space and land during and after the pandemic."
Key findings from the September 2025 Report:
- National home prices rose 0.5% in September, marking the ninth consecutive month of growth and taking home values to a record high.
- National home prices are up 6.2% over the past year, adding around $54,100 to the value of the median home, and have surged 50.6% in the past five years.
- Capital city prices rose 0.6% in September and are up 6.0% year-on-year, with values at record highs.
- Among the capitals, Hobart (+0.8%) and Sydney (+0.7%) led monthly growth. All capitals apart from Hobart (–5.4% below peak) and Canberra (–1.3% below peak) are now sitting at record highs.
- Over the past year, Darwin (+11.4%), Brisbane (+10.2%), regional South Australia (+12.3%), and regional Queensland (+10.2%) recorded the strongest gains.
- Melbourne prices have now fully recovered their 2022 peak, returning to record highs after several years of underperformance.
- Hobart is rebounding after a period of underperformance, leading monthly gains in September and showing one of the sharpest annual accelerations in price growth across the capitals.
- Regional prices climbed 0.4% in September and are up 7.1% year-on-year, outpacing the capitals over the past year and five years (64.4% vs 46.5%), bolstered by relative affordability and lifestyle appeal.
Outlook
PropTrack reports that with interest rates moving lower this year, momentum in the housing market has strengthened, and national annual growth has picked up by 0.8 percentage points since the start of the year, marking a turnaround from the slower conditions observed in late 2024.
The reports also highlights that the current upswing is a synchronised expansion, underpinned by lower rates and constrained supply, with a broad-based lift in prices across the country.
Ms Creagh notes:
"Stretched affordability remains a brake on the pace of growth, which has accelerated but is broadly in line with the past decade’s average, below the 30-year annual average, and far beneath the 20–30% surges that defined previous booms.
Looking ahead, the series of interest rate cuts delivered this year, improved sentiment and the October expansion of the Home Guarantee Scheme will add support. And with stock on market constrained and new supply challenged, demand-side stimulus is likely to intensify competition.
The October expansion of the Home Guarantee Scheme and removal of income caps will pull forward some first-home buyer demand by lowering the deposit hurdle, without a commensurate lift in supply responsiveness.
As a result, the housing market is poised for further gains throughout spring, though the pace will vary across cities as momentum shifts."


