

Key takeaways
Many Australians quietly wonder if they’re financially “on track” but don’t speak about it.
This article provides a generational wealth comparison based on recent data from ABS, ATO, KPMG, InvestSMART, and McCrindle.
It’s a chance for readers to benchmark themselves against national averages—and plan their next move.
“Am I doing OK financially?”
It’s the question so many Australians quietly ask themselves. But few dare to say out loud.
Whether you’re just starting out, deep in your wealth-building years, or nearing retirement, it’s natural to wonder: “How do I stack up?”
Well, let’s find out.
Drawing on fresh data from the ABS, ATO, KPMG, and excellent articles from Invest SMART and McCrindle, let’s take a look into how wealth is distributed across Australian generations – and what it means for you as an investor.
You might find it eye-opening… perhaps even a little uncomfortable.
Either way, this is the perfect moment to benchmark your financial health and plan your next move.
The state of Australia’s household wealth
Australians are among the wealthiest people in the world – at least on paper.
The average Australian household now boasts a net worth of just over $1 million.
This figure includes assets like property, superannuation, shares, and cash, minus debts like mortgages and loans.
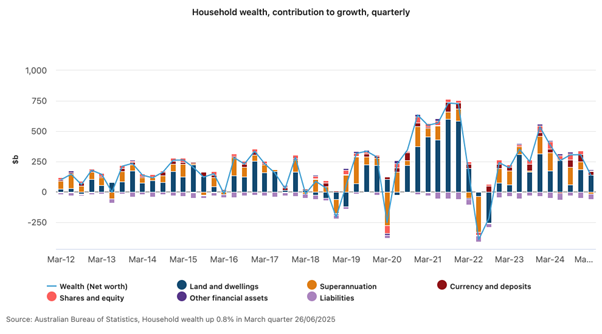
Source: ABS
But that’s just the average. Dig a little deeper, and you’ll see wealth isn’t evenly spread.
It’s highly concentrated in older generations, while younger Aussies are still climbing the financial ladder, with some big hurdles in their way.
So how does your generation compare?
Baby Boomers: the Millionaire Generation born 1946–1964
If you’re a Baby Boomer, congratulations – statistically, you’re Australia’s wealthiest generation.
Many Boomers have spent decades building their wealth through property investment, superannuation contributions, and a relatively stable economic environment.
Here’s what the average Boomer household looks like today:
| Asset Class | Average Value |
| Property Assets | $1.3 million |
| Super/Business | $641,000 |
| Shares | $206,000 |
| Cash Savings | $242,000 |
| Net Wealth | $2.3 million |
| Debt | $82,000 |
(Source: InvestSMART/KPMG)
Boomers hold about half of Australia’s housing wealth and have comparatively little debt.
They’re now shifting from accumulation to preservation, and for many, starting to think about intergenerational wealth transfer.
Generation X: solid progress, heavy debt Born 1965–1980
Gen X – often dubbed the “sandwich generation” – is balancing mortgage repayments, raising children, and in some cases supporting aging parents.
Their wealth reflects these challenges:
- Also read:Melbourne property market forecast for 2026 | Is it a good time to invest in Melbourne?

- Also read:Latest Property Price Forecasts Revealed. Australian Property Market Outlook 2026: Where To Now After The Rate Rise.

- Also read:Sydney property market forecast for 2026. Is it a good time to invest in Sydney?

- Also read:Brisbane Property Market Forecast [2026] – What’s Ahead & Where to Invest

- Also read:This week’s Australian Property Market Update – Latest Data, State by State March 24th 2026

| Asset Class | Average Value |
| Property Assets | $1.31 million |
| Super/Business | $586,000 |
| Shares | $256,000 |
| Cash Savings | $176,000 |
| Net Wealth | $1.88 million |
| Debt | $448,000 |
(Source: InvestSMART/KPMG)
Gen X households are in their prime earning years.
But their high debt levels mean careful planning is essential to ensure they convert income into long-term wealth.
Millennials (Gen Y): catching up in a tougher game born 1981–1996
Millennials are now in their 30s and early 40s.
Many are juggling mortgages, childcare costs, and career development.
But they’re facing a different economic reality than their parents with soaring property prices, low wage growth and the rising cost of living.
Here’s how they’re tracking:
| Asset Class | Average Value |
| Property Assets | $750,000 |
| Super/Business | $260,000 |
| Shares | $51,000 |
| Cash Savings | $104,000 |
| Net Wealth | $757,000 |
| Debt | $410,000 |
(Source: InvestSMART)
Interestingly while Millennials make up about 15% of Australian households, they hold only 5% of total national wealth.
Gen Z: just getting started born 1997–2012
Gen Z is only just entering the workforce, so their wealth figures are understandably modest:
| Asset Class | Average Value |
| Property Assets | $69,000 |
| Super/Business | $43,000 |
| Shares | $7,000 |
| Cash Savings | $26,000 |
| Net Wealth | $96,000 |
| Debt | $49,000 |
The real story of Gen Z’s wealth will unfold in the decades to come.
However, their path is already marked by higher education debts, later homeownership, and different attitudes toward investing (with a greater interest in shares, ETFs, and cryptocurrency).
Lessons for today’s investors
Here’s what I take from this data:
- Averages never show the full picture – a single parent or a recent divorcee will face different challenges than a couple with two incomes.
- Wealth builds over decades. Boomers didn’t start rich – they benefited from time in the market. If you ask them, they’ll tell you they give the hard things early in their life so that they have an easier life later.
- Property remains key. It’s still the largest component of household wealth across every generation.
- Debt management matters. High leverage can help you build wealth faster but must be handled wisely.
Your next steps
So… how do you stack up?
If you’re ahead of the average for your generation, well done!
But remember, wealth preservation is just as critical as wealth creation.
And if you’re behind, don’t panic. The best time to start building wealth was 20 years ago – the second-best time is today.
Why not have a wealth discovery chat with a wealth strategist at Metropole?
Over the years we have helped thousands of Australians safely build intergenerational wealth through strategic property and wealth advice.
This financial freedom has given them more choices in their lives.
You can find out more and lock in that meeting here.
At Metropole, we help clients of all generations build, protect, and pass on wealth safely and strategically. If you’d like to see how we can help, why not book a complimentary Wealth Discovery Chat here now?


