


Key takeaways
Australia's home value growth hits the fastest pace in over two years as national dwelling values surged 1.1% in October, marking the strongest monthly gain since June 2023 and pushing the annual growth rate to 6.1%. This clear upturn has been gathering momentum since the first rate cut in February, confirming a new cycle of growth.
Expanded deposit guarantee scheme intensifies competition for more affordable properties - The step up in growth rates also coincides with the expanded 5% deposit guarantee scheme going live on October 1st, which has likely added to housing demand, especially around the lower to middle price points of the market.
It is the lower quartile and middle of the pricing spectrum where values are rising the fastest across most capitals.
Swift value rises mean capital city median home values have already offset the boost to borrowing capacity for median income households from earlier rate cuts.
The pace of growth in Australian home values accelerated in October, rising by 1.1%, the fastest monthly gain since June 2023.
Momentum has been building in the rate of housing value growth since the first rate cut in February, pushing the annual pace of growth to 6.1% nationally.
Before the February rate cut, housing conditions were losing momentum, even recording flat to falling values through late 2024 and January 2025.
The first rate cut in February marked a clear turning point, with home values moving through a positive inflection across most regions and gathering steam since then.
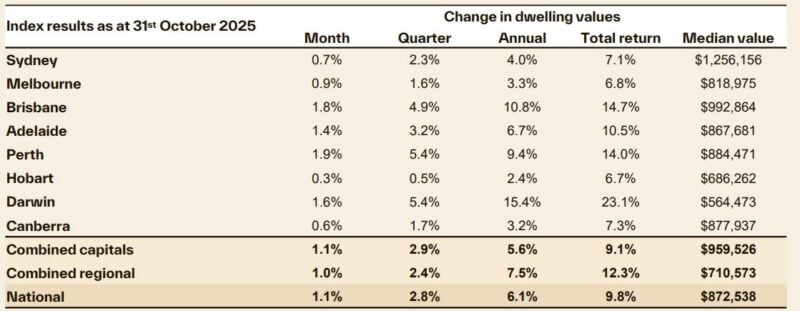
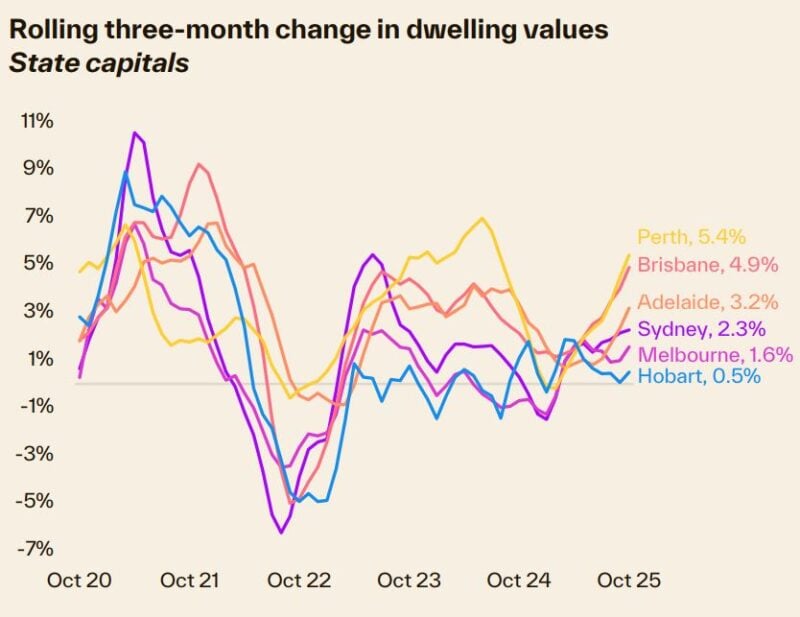
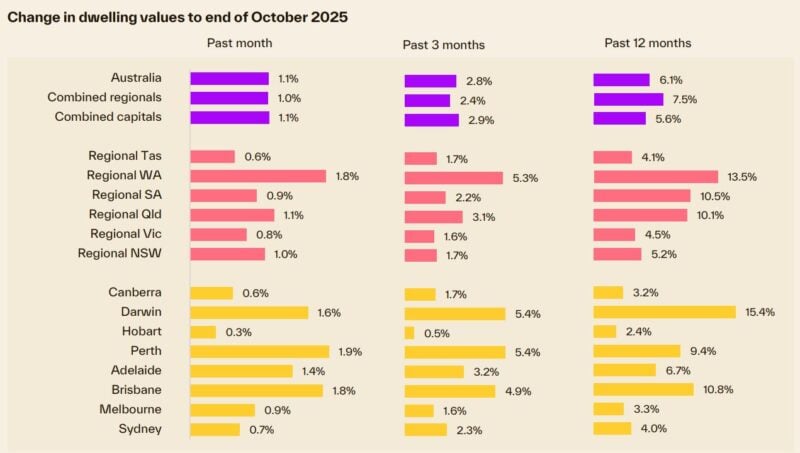
Monthly gains have been broad-based, with every capital city and rest of state region recording a monthly rise in value, ranging from a 1.9% surge in Perth to a 0.3% rise across Hobart.
Across the combined capitals, the 1.1% gain seen in October equates to an increase of just over $10,000 in the median dwelling value over the month.
Since February, capital city dwelling values are up 5.9%, or approximately $53,700.
There are many factors contributing to stronger housing conditions
But ultimately the uptick in growth is reflective of supply falling well short of demand.
At the national level, Cotality’s rolling quarterly estimate of home sales is tracking 3.1% above the previous five-year average, while advertised supply levels over the four weeks to October 26th were 18% below average.
Such tight advertised supply levels against above-average levels of demonstrated demand have skewed selling conditions towards vendors through spring.
Although auction clearance rates have eased a little, they have held above the decade average — in the high 60% to low 70% range since the start of spring.
The step up in growth rates also coincides with the expanded 5% deposit guarantee scheme going live on October 1st, which has likely added to housing demand, especially around the lower to middle price points of the market.
Indeed, it is the broad middle and lower quartile of the market where gains are strongest.
Across the combined capitals, dwelling values were up 1.4% across the middle market and rose 1.2% across the lower quartile, while upper quartile values were 0.7% higher through the month.

The upper quartile of the market is showing the lowest rate of growth across almost every capital city.
Stronger housing demand at the lower price points is likely a culmination of serviceability constraints eroding purchasing power, persistently higher than average levels of investor activity, and what is likely a pickup in first home buyers taking advantage of the expanded deposit guarantee.
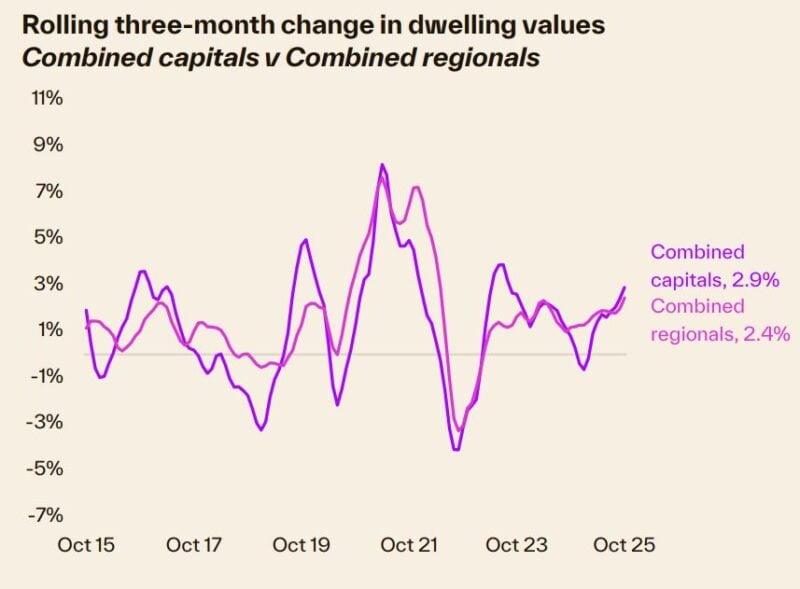
Regional markets also posted a solid increase in the monthly rate of growth, with the 1.0% increase the highest monthly gain across the combined regional markets since March 2022.
Regional WA recorded the strongest rise, with a 1.8% increase in values, followed by Regional Qld up 1.1% and Regional NSW with a 1.0% lift.
Outlook
There are a lot of moving parts influencing the housing market at the moment.
- Also read:Rents Surge Again as Interest Rates Bite – What Happens Next?| | Property Insiders

- Also read:Latest Property Price Forecasts Revealed. Australian Property Market Outlook 2026: Where To Now After The Rate Rise.

- Also read:March Home Prices Still Rising | Latest stats from Dr. Andrew Wilson

- Also read:National Weekly Auction Report – March 28th 2026 | Auction Clearance Rates Still Fading Over Super Week of Listings

- Also read:This week’s Australian Property Market Update – Latest Data, State by State March 24th 2026

On one hand, we have persistently low levels of advertised supply and above- average levels of housing demand supporting value growth.
On the other hand, we suddenly have a renewed inflation challenge and the prospect of a shallower rate-cutting cycle.
Banking sector economists are no longer forecasting another rate cut in 2025, with CBA going further, forecasting no more cuts in this cycle.
Adding to this, is severe affordability challenges and stubbornly low consumer sentiment, which could further dip on the back of cost-of-living pressures and easing labour market conditions.
The imbalance between demand and supply is likely to persist for a while yet.
The number of home sales is a proxy for housing demand, and the trend to date has been resilient in the face of downside pressures.
At the same time, immediate supply (based on listing numbers) is tracking around record lows for this time of the year.
Newly built supply also remains insufficient. Dwelling commencements were 9.5% below the decade average in June, and completions were 15.6% below the decade average.
The Cordell Construction Cost Index continues to record rising residential building costs, keeping builder profit margins compressed.
The September quarter saw home building costs rise another 0.6%, taking the cost to build 31% higher over the past five years.
Builders and developers continue to face severe margin pressures, insolvencies remain high across the construction sector, and competition with the public infrastructure sector for workers remains intense.
It is highly unlikely there will be a meaningful lift in new housing supply while cost and margin pressures persist.
The Q3 inflation shock is likely to have implications for housing markets, with a dimmer outlook for future rate cuts along with the potential for renewed cost of living pressures possibly leading to a prolonged period of pessimistic consumer attitudes.
The boost to borrowing capacity from the 75bps of rate cuts is likely to lose its potency if housing values continue to rise swiftly.
As a rough calculation, after allowing for cost-of-living expenses and the 3% serviceability buffer, a household on the median income has seen around a $51,000 boost to their borrowing capacity through the rate-cutting cycle to-date.
Capital city home values have already risen by nearly $54,000 at the median since February, offsetting the benefit of the improved borrowing capacity.
With interest rates potentially at or near the end of their cutting cycle, we aren’t likely to see a material boost to borrowing capacity from here.
A tightening of investor credit policies could be a looming downside risk for housing markets.
Regulators seem to be increasingly wary about the pace of investment credit growth.
Credit aggregates from the RBA to August show housing credit for investors is rising at the fastest pace since June 2015.
A further acceleration in investor credit could see tighter lending polices introduced.
Given that investors comprise an above average 38% of mortgage demand, tighter credit conditions on this segment of the market would dent demand.


