


Key takeaways
The expanded Home Guarantee Scheme isn’t just helping first-home buyers — it’s re-engineering demand.
Homes under the new price caps are clearly outperforming higher-priced properties, confirming that government incentives still have the power to distort market behaviour at the margins.
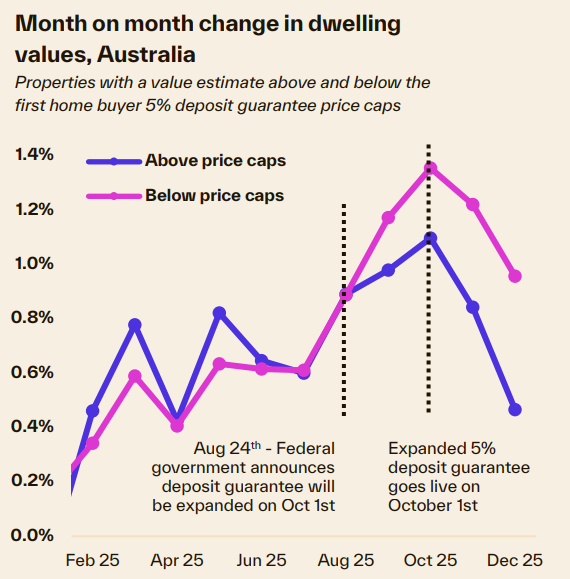
Since September, properties under the cap grew 50% faster than those above it (3.6% vs 2.4% in the December quarter). This tells us the current growth phase is being driven from the bottom up, not from prestige or discretionary purchases.
The uplift began before the scheme officially launched on October 1. That’s classic behaviour in constrained markets — buyers act early when they anticipate policy-driven competition.
High interest rates and tighter serviceability aren’t killing demand — they’re redirecting it. Buyers still want property, but they’re being forced down the price spectrum, concentrating demand into cheaper, more accessible stock.
Investors are very active in the same price brackets, with 41% of mortgage demand in Q3 and investor credit growth at its fastest pace since 2015. That’s creating a competitive pile-up at the affordable end of the market — exactly where supply is already the tightest.
New analysis from Cotality shows that since September last year, lower-priced homes – that is those under the expanded Home Guarantee Scheme price caps - have generally recorded stronger growth than higher-priced homes.
Growth in home values has diverged based on whether properties fall under or above the scheme’s price caps.
Quarterly Growth Trends
- Homes under the price cap: +3.6% in the December quarter
- Homes above the price cap: +2.4% in the same period
The expanded 5% deposit guarantee has sharpened demand at lower price points, with under-cap markets outperforming across almost nine-in-ten regions.
We’re seeing a clear shift in momentum, with buyers increasingly targeting homes that fall under the new price caps, especially in Sydney, where the value gap is most pronounced.
This trend was already visible before the scheme’s official start on October 1, suggesting some buyers acted early to secure properties before competition increased.
Possible drivers
Several factors may explain the stronger growth at lower price points:
Demand ’brought forward’: Anticipation of increased competition and price pressure after the scheme’s launch has likely brought forward demand from those who didn’t necessarily need to rely on the deposit guarantee.
- Also read:Rents Surge Again as Interest Rates Bite – What Happens Next?| | Property Insiders

- Also read:Latest Property Price Forecasts Revealed. Australian Property Market Outlook 2026: Where To Now After The Rate Rise.

- Also read:March Home Prices Still Rising | Latest stats from Dr. Andrew Wilson

- Also read:National Weekly Auction Report – March 28th 2026 | Auction Clearance Rates Still Fading Over Super Week of Listings

- Also read:This week’s Australian Property Market Update – Latest Data, State by State March 24th 2026

Serviceability constraints: A trend towards higher home values amid elevated interest rates and serviceability limits may be pushing demand toward lower-priced, more affordable properties.
Investor activity: Increased investor presence in the lower price segment, competing with first-home buyers and mainstream demand. Investors comprised 41% of mortgage demand in Q3, and annual investor credit growth is rising at the fastest rate since December 2015.
Regional differences
The pattern of stronger growth at values below the price caps is consistent across every capital city and regional market except the ACT.
The largest value growth differential was recorded across Australia’s largest city, Sydney.
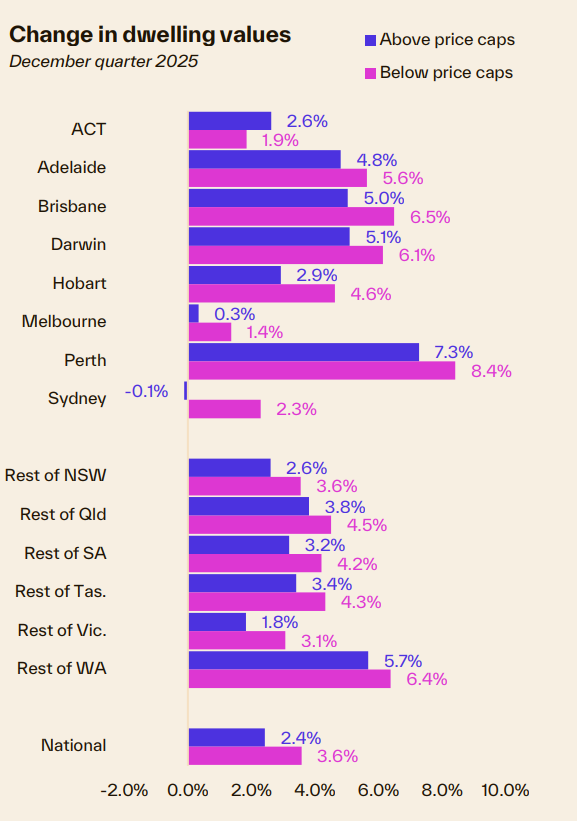
Homes with a value under the cap rose 2.3%, while those above the cap fell 0.1% during the December quarter.
Across Australia, 89% of SA4-sub regions have shown a stronger growth rate for properties with a value under the price caps. 78 out of 88 regions analysed showed stronger growth for homes under the cap.
Overall, the expanded deposit guarantee appears to have amplified demand for lower-priced homes, contributing to faster growth in this segment compared to higher-priced properties.


