


Key takeaways
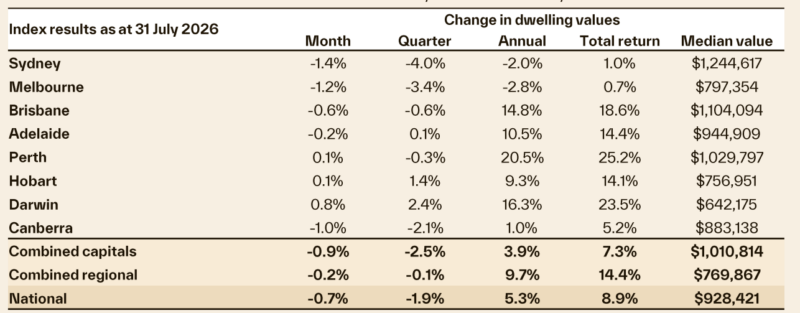
Sharp downturn expands: Australia’s Home Value Index fell 0.7% in July (largest drop since Dec 2022), with declines spreading to previously resilient capitals like Brisbane (-0.6%) and Adelaide (-0.2%).
Major markets lead declines: Sydney (-1.4%) and Melbourne (-1.2%) lead national falls, with upper-quartile property values dropping 3.2% over the three months to July.
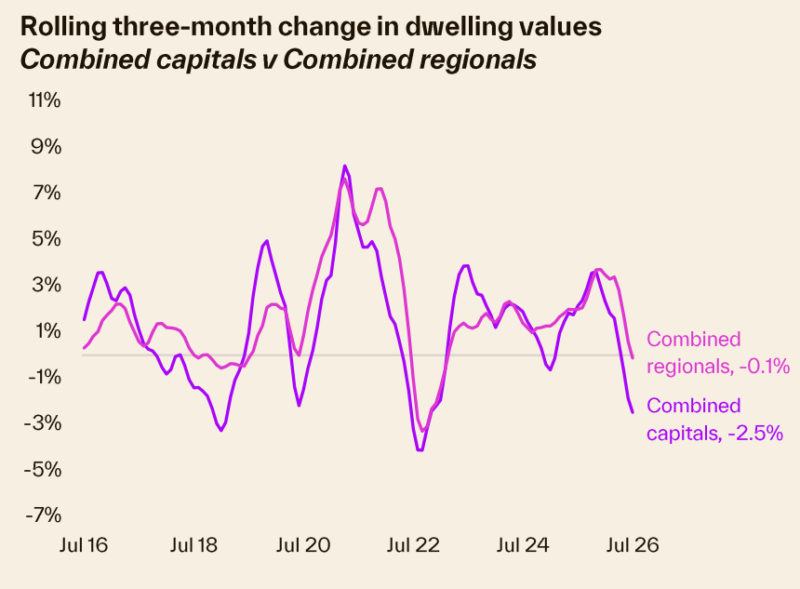
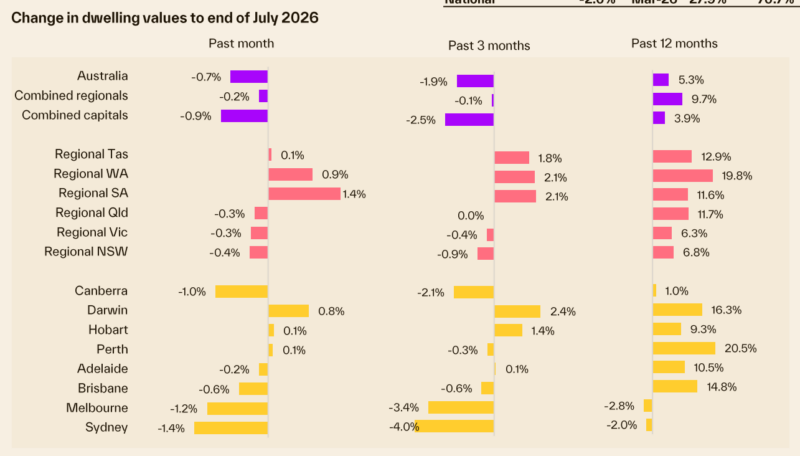
Regional areas weaken: The combined regional index fell 0.2% in July—its first decline since January 2023—led by Regional NSW (-0.4%).
Sellers adjust to falling demand: New listings are slowing as vendors wait out weak conditions, though total capital city listings are now 5.7% above the five-year average.
Australia's property downturn gathered sharp momentum in July, with Cotality’s national Home Value Index (HVI) falling 0.7% - the largest single -month decline since December 2022.
The downturn is no longer confined to Sydney and Melbourne, as cumulative demand -side pressures pulled previously resilient mid -sized capitals into negative territory.
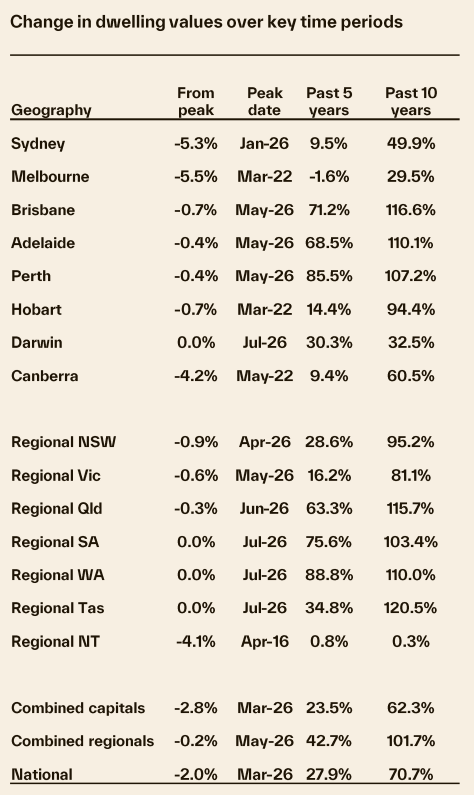
Sydney and Melbourne continue to lead the national decline
Home values for these capital cities dropped by 1.4% and 1.2% respectively over the month.
Values in Melbourne peaked in November last year, while Sydney reached its highest point in January.
Data from July confirmed that the downturn has extended to previously robust mid -sized markets.
Home values in Brisbane and Adelaide fell by 0.6% and 0.2% respectively, with historical revisions indicating this marks the second consecutive month of declines for both cities.
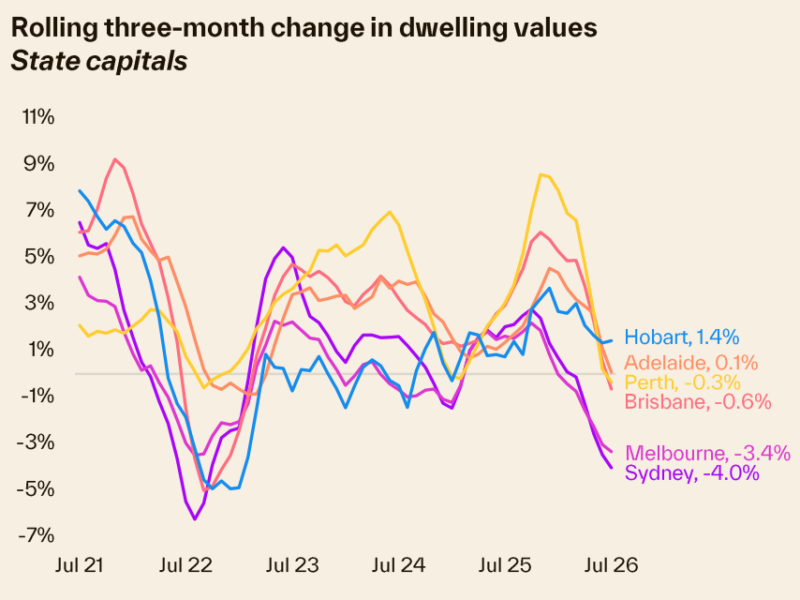
Perth managed a modest 0.1% increase following a revised 0.5% contraction in June.
Compared with sizeable increases across the December and March quarters, this broader softening highlights a swift loss of momentum across the board.
The decline in home values remains heavily weighted toward higher - value properties.
Upper - quartile home values fell by 3.2% nationally over the three months to July, compared with a 0.3% gain across the lower price tier.
During periods of rapid market transition, the HVI can experience larger revisions, with July data revealing steeper value declines across May and June than initially reported.
Recent revisions reflect how quickly conditions are changing across individual markets.
These revisions highlight the rapid evolution in the market, particularly across the mid -sized capitals.
Perth in particular has seen significant shifts, with June growth revised 120 basis points lower in our latest update, which pulled the once - booming city into negative territory for that month.
Buyer and seller expectations shift to reflect the rapidly evolving market
Demand -side factors, such as affordability and mortgage serviceability constraints evident late last year, the three cash rate hikes this year, higher fuel costs, and deeply pessimistic levels of consumer confidence due to the Iran conflict and the policy changes coming out of the budget, have pulled in the same direction.
Sellers have arguably been slower to adjust, but a shift is becoming apparent.
This adjustment is most evident in our weekly listings data.
We have observed a deterioration in the flow of new listings across the country in recent weeks, led by Sydney, as potential vendors assess a weak market and choose to wait until conditions improve.
However, this trend has lagged the decline in demand, as evidenced by total listings numbers that have continued to track higher.
Nationally, total home listings sat 1.1% below the five - year average over the four weeks ending 26 July, up from 25.9%
below average in mid -January.
Among the combined capitals, advertised supply is now 5.7% above average.
There remains a mismatch between the pricing expectations of buyers and sellers.
Capital city auction clearance rates have remained below 50% since late May, although they have moved up from the low
40s range in mid -to -late June.
- Also read:Migration Is Falling: What Happens to Australian Property Prices Now? | Property Insiders

- Also read:This week’s Australian Property Market Update – Latest Data, State by State September 22nd 2026

- Also read:Latest Property Price Forecasts. Australian Property Market Outlook 2026-2027: Navigating a Market Correction

- Also read:National Weekly Auction Report – September 19th 2026 | Clearance Rates Ease as Auctions Surge

- Also read:Adelaide housing market update | September 2026

While regional markets have consistently outperformed the capital cities since the peaks of October 2025, the demand - driven loss of momentum has also hit these markets.
The combined regional index fell by 0.2% in July, the first decline in this measure since January 2023.
Regional NSW saw the weakest outcome, with home values dipping 0.4%, followed by regional VIC and regional QLD (both down 0.3%).
In contrast, regional SA and regional WA maintained some strength, with values rising by 1.4% and 0.9% in July.
Housing market conditions continued to weaken across July, with the downturn encompassing a larger number of cities
The previous strength in the mid -sized capitals has faded as the demand headwinds that have built since late 2025 have impacted across the country.
Since the peak in home value growth in October last year, housing demand has been restricted by the cumulative impacts of affordability and serviceability pressures, 75 basis points of interest rate increases (that raised mortgage repayments and reduced borrowing capacity), cost of living pressures and loss of consumer confidence as well as reports of lower investor activity following policy changes in the budget.
In the short term, these pressures are unlikely to ease, with the temporary fuel excise discount, which ends 2 August, set to add further pressure to household balance sheets.
There remains some uncertainty around interest rates moving forward, although the likelihood of any further rate hikes from the RBA has faded
The latest CPI data showed no increase in underlying (trimmed mean) inflation in June, a softer outcome than markets anticipated.
The RBA kept rates on hold at its June meeting, and the consensus view is that the cash rate is at its peak.
That said, the RBA Governor warned in a July speech that the board still has a tightening bias, meaning that the path of
both trimmed mean inflation and unemployment will remain key indicators to watch in coming months.
Consumer sentiment improved a little in July , with the Westpac -Melbourne Institute Consumer Sentiment Index up 4.1%, albeit from weak levels in June .
Overall, the index is well below the peaks recorded in late 2025 and is not far above the lows of the Global Financial Crisis.
Fewer respondents view now as a good time to purchase a property than they did in August to November last year.
There is typically a close relationship between consumer sentiment and housing turnover, with confidence necessary for buyers to commit to high-value purchases such as a home.
As the downturn in home values accelerates, there appears to be a supply -side adjustment underway
Potential vendors are shying away from the market, given the weaker conditions, resulting in a pullback in new listings of properties for sale.
Combined with the constraints to housing construction, this supply -side response could limit how far home values fall in the current downturn.
For buyers who remain in the market , lower competition and elevated stock levels (when compared with the start of the year) mean greater choice and more negotiating power as time on market starts to increase.
Outlook
The most likely outcome in the coming months is a further deterioration in home values across the country, however there are a number of factors that reduce the risk of a sharp correction.
Unemployment remains low (supporting housing demand and reducing the risk of forced sales), while population growth continues to provide fundamental underpinning for demand.
On the supply side, high construction costs and challenges regarding project feasibility are a constraint to new homes, while vendors appear to be pulling back from the market, which could start to limit some of the downward pressure on values.
The most heavily impacted markets are likely to be those that are higher valued, have a heavier investor concentration and where available supply is most elevated.
Key factors to watch in coming months include the path of underlying inflation and unemployment, and how the evolution of these trends impacts the RBA’s decision making, changes to investor behaviour as they respond to the new policy framework and whether total advertised stock adjusts lower on constrained new listings or remains elevated as sales volumes slow further.