Key takeaways
National capital city prices are up 9.6% annually, but the market is highly fragmented.
Auction clearance rates hit their lowest point of 2026, with the combined capitals preliminary rate falling to 66.6% - a sentiment shift, not a structural problem.
Global uncertainty and rising oil prices are keeping inflation elevated, pushing back expectations of rate cuts
Quality vendors remain on strike - new listings are nearly 4% below the five-year average and total stock is 14% lower than a year ago
Rental growth is re-accelerating — national rents up 5.5% annually, with the quarterly gain the strongest since April 2024
This week the data reminded us just how fragmented the Australian housing market has become. While some capitals are barely moving and others are quietly outperforming.
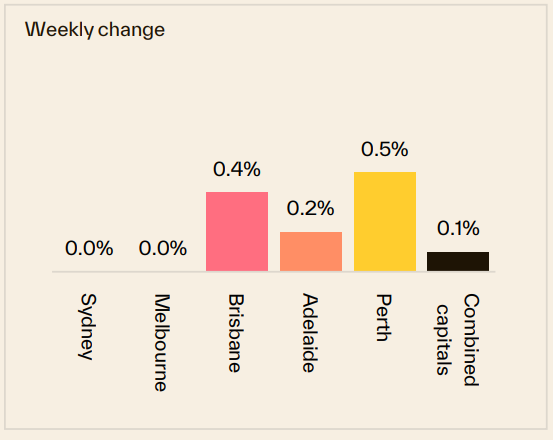
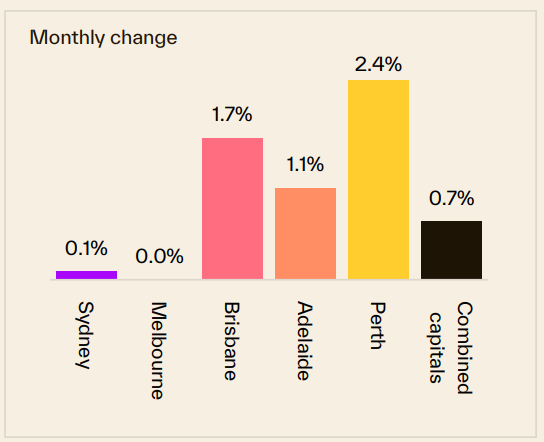
Sydney property prices remained flat over the last week, increased 0.1% over the last month but are 5.5% higher than they were 12 months ago.
Melbourne property prices remained flat over the last week, also remained flat over the last month, and increased 4.1% compared to 12 months ago.
Brisbane property prices increased 0.4% over the last week, increased 1.7% over the last month and are 18.5% higher than they were 12 months ago.
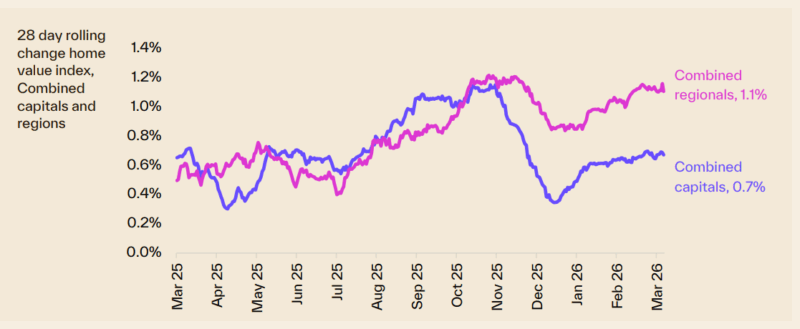
Overall, Australian capital dwelling prices increased 0.7% over the last month and are now 9.6% higher than they were 12 months ago.
Every week I sit down with the latest property data and ask myself the same question: what's the signal, and what's just noise?
Right now, there's plenty of noise to sort through.
Global uncertainty is on the rise, geopolitical tensions are pushing oil prices higher, inflation fears are resurfacing, and financial markets are starting to reassess just how quickly interest rates might fall — or whether they'll fall at all in the near term.
It's the kind of backdrop that makes headlines dramatic and investors nervous.
But here's what I haven't learned over the decades...markets don't move on headlines. They move on fundamentals.
And the fundamentals underpinning Australian property - chronic undersupply, strong population growth, tight rental conditions, and a deeply structural imbalance between the homes we need and the homes we're building - haven't changed.
What has changed is market sentiment, and that's showing up in the data this week.
Auction clearance rates have dipped to their lowest reading so far this year. Buyers are being a little more cautious. Some discretionary sellers are holding back. And yet, nationally, property prices are still 9.6% higher than they were 12 months ago.
Brisbane is up 18.1% over the year. Perth and Adelaide continue to outperform. Even Melbourne, the market everyone loves to be pessimistic about, is quietly up 4.4% annually.
That fragmentation - some markets racing ahead, others treading water - is exactly what I've been writing about for years. This is not one Australian property market. It never was. And the investors who understand that are making very different decisions from those who are reacting emotionally to the noise.
So let's cut through the clutter and look at what the data is actually telling us this week.
On the auction front this week... lowest combined capital city preliminary clearance rate so far this year
The preliminary combined capitals auction clearance rate came in at 62.7% last week, the weakest so far this year and on par with the low point recorded at the end of the auction season in mid-December last year.
Every capital city recorded a decline in the preliminary clearance rate relative to the week prior.
See Cotality's full auction report below.
This week, Cotality also reports that:
- Sydney property prices remained flat over the last week, increased 0.1% over the last month but are 5.5% higher than they were 12 months ago.
- Melbourne property prices remained flat over the last week, also remained flat over the last month, and increased 4.1% compared to 12 months ago.
- Brisbane property prices increased 0.4% over the last week, increased 1.7% over the last month and are 18.5% higher than they were 12 months ago.
Overall, Australian capital dwelling prices increased 0.7% over the last month and are now 9.6% higher than they were 12 months ago.
Clearly, the property cycle is moving on but our markets are very fragmented.

Source: Cotality March 23rd 2026
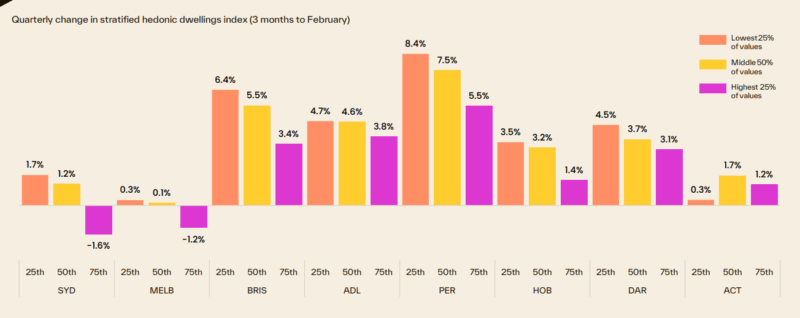
Of course, these are "overall" figures - there is not one Sydney or Melbourne or Brisbane property market.
And various segments of each market are performing differently.
At the beginning of this cycle the upper quartile of the market lead the upswing but last year the lower quartile across every capital city recorded a stronger outcome for housing values relative to its upper quartile counterpart.
The following chart shows how various segments of each capital city market are performing differently, with median-priced properties performing well.
To help keep you up-to-date with all that's happening in property, here is my updated weekly analysis of data and charts as of 23rd March 2026, provided by SQM Research, Cotality, and realestate.com.au.
Current property asking prices
Property asking prices are a useful leading indicator for housing markets - giving a good indication of what's ahead.
Here is the latest data available:
Sydney
| Property type | Price ($) | Weekly Change | Monthly Change % | Annual % change |
|---|---|---|---|---|
| All Houses | 2,180.826 | 0.386 | -1.0% | 9.3% |
| All Units | 910.986 | 0.514 | 0.5% | 8.4% |
| Combined | 1,661.993 | 0.438 | -0.6% | 8.9% |
Source: SQM Research
Melbourne
| Property type | Price ($) | Weekly Change | Monthly Change % | Annual % change |
|---|---|---|---|---|
| All Houses | 1,344.558 | -0.466 | 1.0% | 6.5% |
| All Units | 681.069 | -1.169 | 0.0% | 9.6% |
| Combined | 1,134.427 | -0.688 | 0.8% | 7.0% |
Source: SQM Research
Brisbane
| Property type | Price ($) | Weekly Change | Monthly Change % | Annual % change |
|---|---|---|---|---|
| All Houses | 1,445.365 | -1.401 | 0.8% | 19.3% |
| All Units | 885.473 | 4.017 | 0.1% | 25.3% |
| Combined | 1,303.915 | -0.032 | 0.7% | 20.2% |
Source: SQM Research
Perth
| Property type | Price ($) | Weekly Change | Monthly Change % | Annual % change |
|---|---|---|---|---|
| All Houses | 1,265.162 | -7.382 | 3.6% | 13.7% |
| All Units | 793.576 | 6.776 | 1.8% | 24.1% |
| Combined | 1,141.274 | -3.663 | 3.3% | 15.4% |
Source: SQM Research
Adelaide
| Property type | Price ($) | Weekly Change | Monthly Change % | Annual % change |
|---|---|---|---|---|
| All Houses | 1,141.949 | -17.375 | -2.1% | 12.5% |
| All Units | 627.602 | -1.702 | 0.6% | 17.4% |
| Combined | 1,049.279 | -14.551 | -1.8% | 13.0% |
Source: SQM Research
Canberra
| Property type | Price ($) | Weekly Change | Monthly Change % | Annual % change |
|---|---|---|---|---|
| All Houses | 1,256.969 | -0.844 | 0.3% | 6.3% |
| All Units | 610.202 | -0.952 | -0.6% | 3.1% |
| Combined | 1,012.067 | -0.885 | 0.0% | 5.0% |
Source: SQM Research
Darwin
| Property type | Price ($) | Weekly Change | Monthly Change % | Annual % change |
|---|---|---|---|---|
| All Houses | 820.251 | 5.465 | 1.1% | 11.7% |
| All Units | 467.076 | -0.076 | -2.8% | 17.4% |
| Combined | 681.329 | 3.285 | 0.0% | 13.2% |
Source: SQM Research
Hobart
| Property type | Price ($) | Weekly Change | Monthly Change % | Annual % change |
|---|---|---|---|---|
| All Houses | 896.094 | -0.549 | 0.2% | 9.4% |
| All Units | 513.319 | -3.419 | -0.7% | 2.2% |
| Combined | 837.533 | -0.988 | 0.2% | 8.6% |
Source: SQM Research
National
| Property type | Price ($) | Weekly Change | Monthly Change % | Annual % change |
|---|---|---|---|---|
| All Houses | 1,093.424 | 0.107 | 0.4% | 12.1% |
| All Units | 649.545 | -2.256 | 0.3% | 12.9% |
| Combined | 996.904 | -0.407 | 0.4% | 12.1% |
Source: SQM Research
Cap City Average
| Property type | Price ($) | Weekly Change | Monthly Change % | Annual % change |
|---|---|---|---|---|
| All Houses | 1,585.019 | -1.537 | 0.2% | 9.9% |
| All Units | 807.967 | -0.552 | 0.3% | 11.7% |
| Combined | 1,352.274 | -1.242 | 0.2% | 10.0% |
Source: SQM Research
The value of property asking prices as a leading indicator for housing markets is quite significant.
In fact it's more valuable than median prices which can be quite misleading.
Let's delve into why this is the case and how it impacts the real estate market.
- Early Market Sentiment Indicator: Asking prices often reflect the current sentiment of sellers in the real estate market.
If sellers are confident, they might set higher asking prices, anticipating strong demand.
Conversely, if sellers are uncertain or perceive a market downturn, they might lower their asking prices to attract buyers.
This makes asking prices a real-time indicator of market sentiment, often preceding changes in actual sales prices. - Predictive of Future Price Trends: Trends in asking prices can be predictive of where the actual property prices are headed.
For example, a consistent rise in asking prices over a period can signal an upcoming rise in transaction prices. - Impact of Economic Factors: Economic factors such as interest rates, employment rates, and broader economic health influence asking prices.
For instance, changes in the Reserve Bank of Australia's policies or shifts in the job market can quickly reflect in the asking prices, providing insights into how these factors are influencing the housing market. - Regional Variations: In a diverse market like Australia's, asking prices can also provide insights into regional disparities.
For instance, the property markets in Melbourne and Sydney might behave differently from those in Brisbane or Perth. Asking prices can give early indications of these regional trends. - Influence of Supply and Demand: Asking prices are also a response to the balance of supply and demand in the market.
In areas with limited supply and high demand, asking prices tend to be higher and vice versa.
However, it's important to note that while asking prices are a valuable indicator, they should not be used in isolation.
Other factors like actual sales prices, time on the market, auction clearance rates, and economic conditions also play crucial roles in understanding the property market dynamics.
READ MORE: The latest median property prices in Australia’s major cities
Last weekend's auction report
Lowest combined capital city preliminary clearance rate so far this year
- Also read:Melbourne property market forecast for 2026 | Is it a good time to invest in Melbourne?

- Also read:Sydney property market forecast for 2026. Is it a good time to invest in Sydney?

- Also read:Brisbane Property Market Forecast [2026] – What’s Ahead & Where to Invest

- Also read:Latest Property Price Forecasts Revealed. Australian Property Market Outlook 2026: Where To Now After The Rate Rise.

- Also read:This week’s Australian Property Market Update – Latest Data, State by State March 24th 2026

The preliminary combined capitals auction clearance rate came in at 62.7% last week, the weakest so far this year and on par with the low point recorded at the end of the auction season in mid-December last year.
Every capital city recorded a decline in the preliminary clearance rate relative to the week prior.
The soft auction result comes as the volume of auctions ramps up, with 2,857 homes taken under the hammer last week, 2.4% more than the previous week and the second highest weekly number of homes taken to auction so far this year.
The volume of auctions is expected to rise further this week, with more than 4,000 homes currently scheduled for auction in the week prior to the Easter long weekend.
The week prior to Easter typically marks the seasonal high point in auction activity.
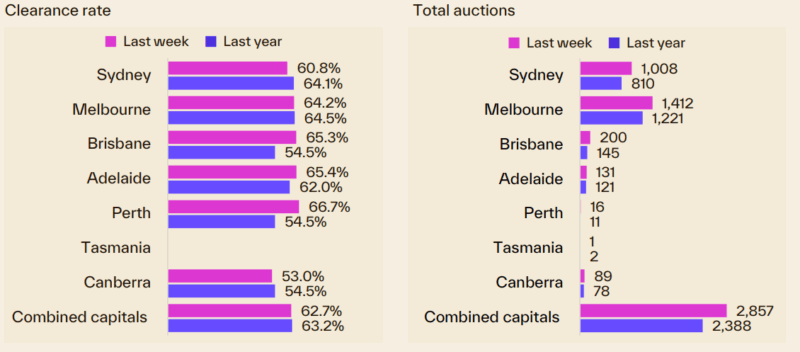
Melbourne hosted the most auctions last week, with 1,412 homes taken to market, the second highest volume so far this year.
The number of auctions was 6.2% higher than a week ago and 15.6% above levels at the same time last year.
The preliminary clearance rate came in at 64.2% last week, which was 2.7 percentage points lower than the previous week’s preliminary clearance rate and the weakest since the week ending April 20th last year (impacted by the Easter long weekend).
Sydney hosted 1,008 auctions last week, 2.4% more than the week prior and 24.4% higher than the same week last year.
60.8% of auctions have reported a positive result based on the results collected so far, down 4.3 percentage points on the week prior and the lowest early result since mid-December last year when the preliminary clearance rate fell to 58.1%.
200 auctions were held across Brisbane last week, the second highest volume through the year to date and 37.9% more auctions that at the same time last year.
65.3% of auctions have reported a successful result so far, down 60 basis points on the previous week and the lowest since the week ending December 21st last year.
Adelaide saw 131 auctions over the week, down almost 14% from the week prior but 8.3% more auctions that at the same time last year.
The preliminary clearance rate dropped sharply across Adelaide, falling to 65.4% last week, the lowest since the first week of August last year.
Last week saw 89 homes auctioned in Canberra with a preliminary clearance rate of 53.0%.
Only 16 auctions were held in Perth last week, with 66.7% returning a positive result, and one auction was held in Tasmania, which was passed in.
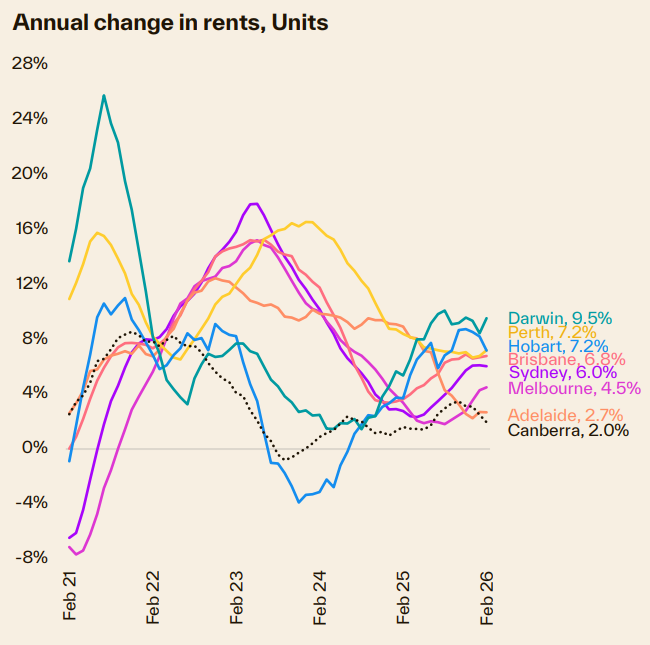
Our rental markets
Rental markets are also seeing the emergence of multi-speed conditions.
Cotality’s national Rental Value Index rose another 0.7% in February, continuing an accelerating trend in rental growth evident since October last year.
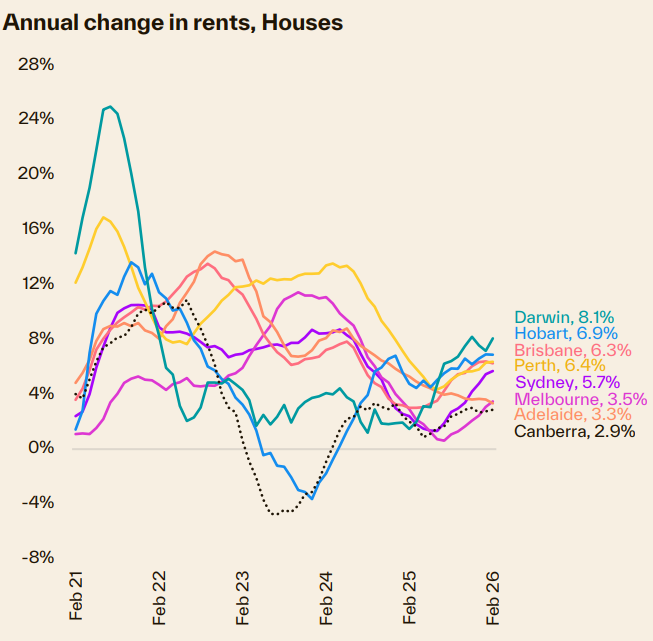
Nationally, rents were up 1.7% over the three months to February, the highest rolling quarterly rise since April last year.
In annual terms, the national rental index is up 5.5%, the strongest 12-month gain since the year ending October 2024.
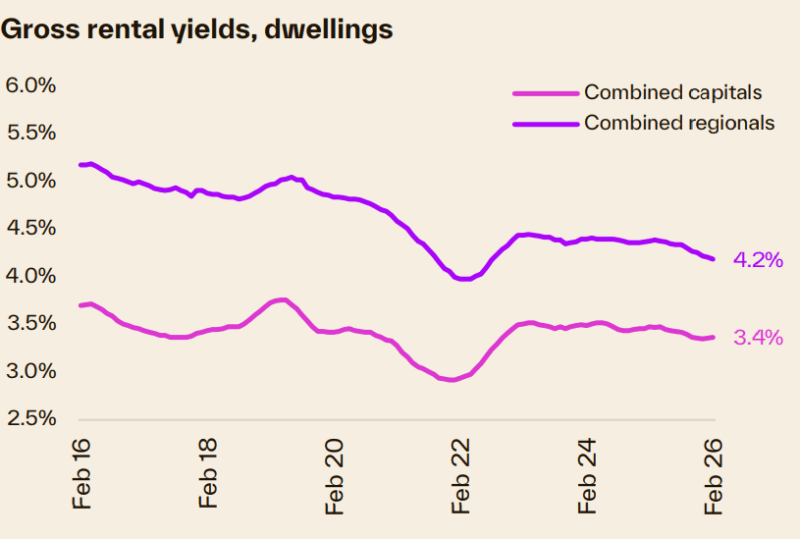
With capital city rents rising a little faster than home values over the past two months, there has been a subtle rise in the gross rental yield, but at 3.4%, opportunities for cash flow across Australia’s rental market remain slim.
Sydney
| Property Type | Rent ($) | Weekly change | Monthly change | 12 Months change |
|---|---|---|---|---|
| All Houses | $1,165.24 | 11.77 | 2.1% | 10.4% |
| All Units | $747.21 | 2.79 | 0.4% | 5.6% |
| Combined | $916.71 | 6.42 | 1.3% | 8.0% |
Source: SQM Research
Melbourne
| Property Type | Rent ($) | Weekly change | Monthly change | 12 Months change |
|---|---|---|---|---|
| All Houses | $804.58 | -0.58 | 1.3% | 8.0% |
| All Units | $593.68 | 1.32 | 0.6% | 4.1% |
| Combined | $682.08 | 0.52 | 1.0% | 5.2% |
Source: SQM Research
Brisbane
| Property Type | Rent ($) | Weekly change | Monthly change | 12 Months change |
|---|---|---|---|---|
| All Houses | $812.86 | -2.87 | 0.3% | 8.7% |
| All Units | $629.72 | -0.73 | -0.5% | 6.1% |
| Combined | $730.36 | -1.90 | 0.0% | 7.7% |
Source: SQM Research
Perth
| Property Type | Rent ($) | Weekly change | Monthly change | 12 Months change |
|---|---|---|---|---|
| All Houses | $886.37 | 5.63 | 1.1% | 5.3% |
| All Units | $677.08 | 5.92 | 1.0% | 6.3% |
| Combined | $799.99 | 5.75 | 1.1% | 5.7% |
Source: SQM Research
Adelaide
| Property Type | Rent $) | Weekly change | Monthly change | 12 Months change |
|---|---|---|---|---|
| All Houses | $692.28 | 3.72 | 0.3% | 2.7% |
| All Units | $531.47 | -0.47 | 2.0% | 1.4% |
| Combined | $638.07 | 2.30 | -0.4% | 2.4% |
Source: SQM Research
Canberra
| Property Type | Rent ($) | Weekly change | Monthly change | 12 Months change |
|---|---|---|---|---|
| All Houses | $779.25 | -4.26 | -2.4% | -3.9% |
| All Units | $587.72 | 0.27 | 1.1% | 2.4% |
| Combined | $673.96 | -1.77 | -0.8% | -1.1% |
Source: SQM Research
Darwin
| Property Type | Rent ($) | Weekly change | Monthly change | 12 Months change |
|---|---|---|---|---|
| All Houses | $805.04 | -0.04 | 5.0% | 10.7% |
| All Units | $602.49 | 5.51 | 3.6% | 13.7% |
| Combined | $685.41 | 3.24 | 4.3% | 12.4% |
Source: SQM Research
Hobart
| Property Type | Rent 9$) | Weekly change | Monthly change | 12 Months change |
|---|---|---|---|---|
| All Houses | $606.17 | 0.84 | -0.6% | 6.8% |
| All Units | $573.02 | 6.98 | 4.7% | 18.0% |
| Combined | $592.95 | 3.28 | 1.4% | 10.9% |
Source: SQM Research
National
| Property Type | Rent ($) | Weekly change | Monthly change | 12 Months change |
|---|---|---|---|---|
| All Houses | $780.00 | 5.00 | 1.3% | 8.0% |
| All Units | $595.00 | 4.00 | 1.2% | 5.1% |
| Combined | $694.33 | 4.53 | 1.3% | 6.9% |
Source: SQM Research
Cap City Average
| Property Type | Rent ($) | Weekly change | Monthly change | 12 Months change |
|---|---|---|---|---|
| All Houses | $925.00 | 4.00 | 1.7% | 7.9% |
| All Units | $673.00 | 3.00 | 0.6% | 5.5% |
| Combined | $791.15 | 3.47 | 1.2% | 6.9% |
Source: SQM Research
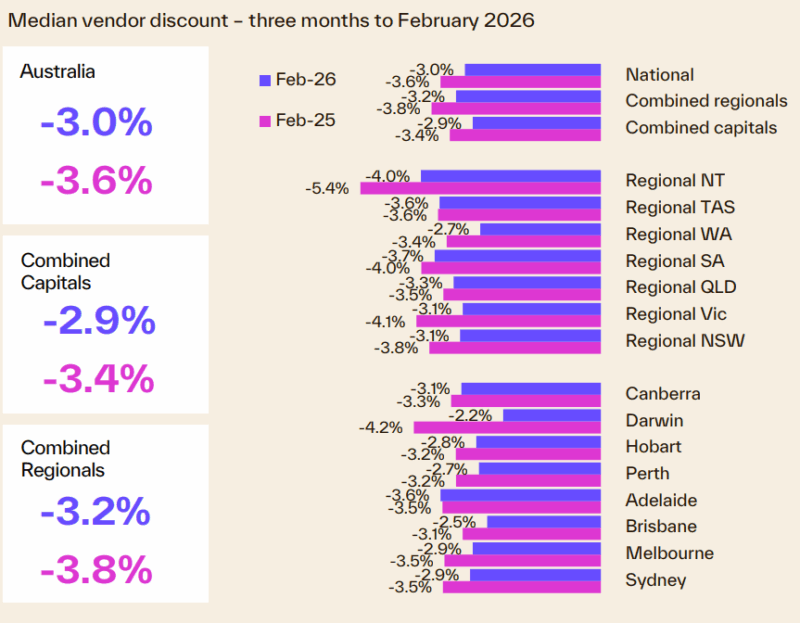
Sellers of good properties are on strike
Vendors remain less active than average.
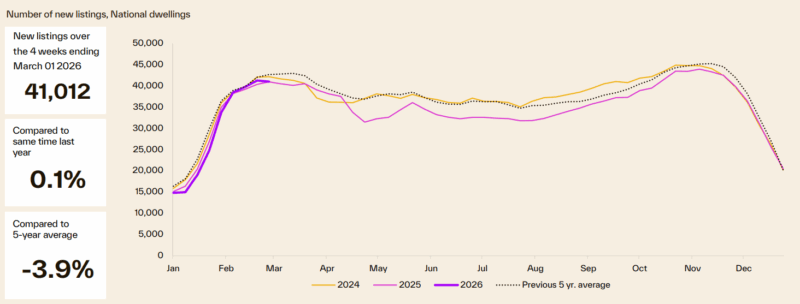
Although the seasonal rise in new listings has played out through late January and February, with freshly advertised listings tracking roughly in line with a year ago (+0.1%), the flow of new listings is down almost 4.0% compared with the five-year average.
With a softer than average flow of new listings to market, alongside higher levels of purchasing activity relative to a year ago, the volume of advertised stock remains well below average.
Nationally, inventory levels were 14% lower than at the same time last year, ranging from more than a 30% drop in Perth and Darwin to a 3.2% decrease across the ACT.
Vendor metrics
Compared to a year ago, homes are selling faster.
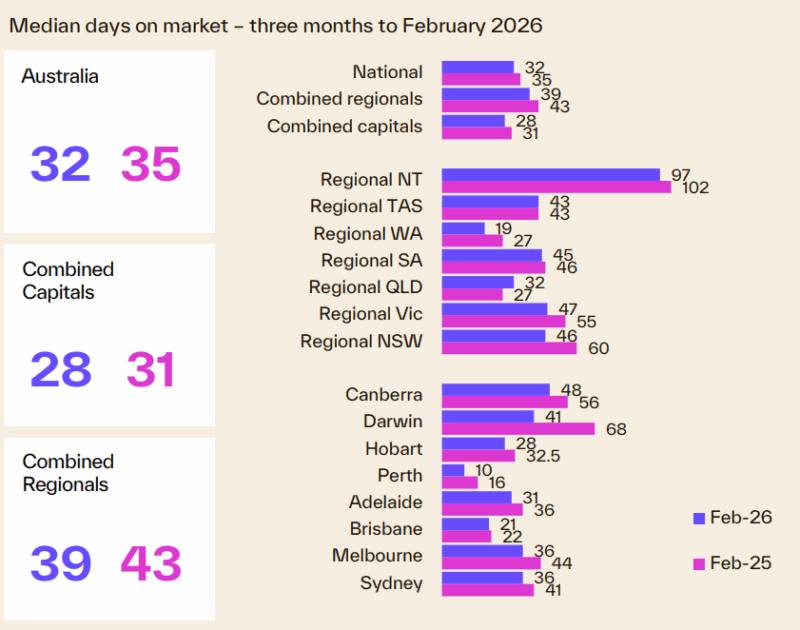
The median number of days on market has shown a rise over recent months, at least partially due to seasonal factors, where selling time lifts through December and January.
Capital city homes sold with a median of 28 days, three days faster than at the same time last year.