Key takeaways
The media narrative remains more negative than the data justifies.
Interest rates have stabilised, not spiralled.
Employment conditions remain a critical support.
Auction results reflect real buyer intent.
Supply shortages are supporting prices.
This is a market of adjustment, not distress. Long-term investors should focus on fundamentals, not fear.
Sydney property prices remained flat over the last week, also remained flat over the last month but are 5.4% higher than they were 12 months ago.
Melbourne property prices remained flat over the last week, increased 0.1% over the last month, and increased 4.5% compared to 12 months ago.
Brisbane property prices increased 0.4% over the last week, increased 1.6% over the last month and are 13.5% higher than they were 12 months ago.
Overall, Australian capital dwelling prices increased 0.7% over the last month and are now 7.5% higher than they were 12 months ago.
If you listened only to the headlines this week, you’d be forgiven for thinking Australia’s property market is on shaky ground.
Interest rates are described as restrictive, affordability pressures dominate the commentary, and buyers are often portrayed as hesitant or exhausted.
But when you look past the noise and focus on the data, a very different picture emerges.
Interest rates are likely to remain stable for some time , low unemployment and high workforce participation continue to underpin buyer confidence, mortgage serviceability, and rental demand. And buyers have largely adjusted to higher borrowing costs.
Auction clearance rates continue to signal balanced conditions, while property prices keep rising, highlighting just how resilient demand remains in supply-constrained markets.
What we’re seeing now is not a market in crisis, but a market that has adapted.
Activity levels are holding up as the year draws to a close, confidence has steadied, and price movements in many regions remain positive, albeit more measured.
For long-term property investors, this period is a reminder that markets are driven by fundamentals rather than sentiment, and that the best decisions are made by looking beyond short-term headlines to the underlying drivers of demand, employment, and supply.
On the auction front this week... both clearance rates and the volume of auctions are winding down for 2025
The number of auctions held last week fell by 8.1% relative to the week prior, with 2,932 homes taken under the hammer across the combined capitals
The preliminary clearance rate fell to 62.7% last week, 80 basis points below the week prior (63.5% which revised down to 57.7% once finalised) and marked the lowest preliminary clearance rate since the week ending December 8th, 2024.
See Cotality's full auction report below.
This week, Cotality also reports that:
- Sydney property prices remained flat over the last week, also remained flat over the last month but are 5.4% higher than they were 12 months ago.
- Melbourne property prices remained flat over the last week, increased 0.1% over the last month, and increased 4.5% compared to 12 months ago.
- Brisbane property prices increased 0.4% over the last week, increased 1.6% over the last month and are 13.5% higher than they were 12 months ago.
Overall, Australian capital dwelling prices increased 0.7% over the last month and are now 7.5% higher than they were 12 months ago.
Clearly, the property cycle is moving on but our markets are very fragmented.


Source: Cotality December 15th 2025
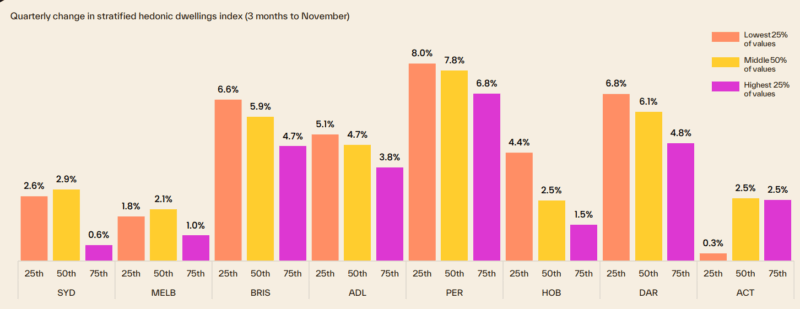
Of course, these are "overall" figures - there is not one Sydney or Melbourne or Brisbane property market.
And various segments of each market are performing differently.
At the beginning of this cycle the upper quartile of the market lead the upswing but last year the lower quartile across every capital city recorded a stronger outcome for housing values relative to its upper quartile counterpart.
The following chart shows how various segments of each capital city market are performing differently with median-priced properties performing well.

To help keep you up-to-date with all that's happening in property, here is my updated weekly analysis of data and charts as of 15th December 2025 provided by SQM Research, Cotality, and realestate.com.au.
Current property asking prices
Property asking prices are a useful leading indicator for housing markets - giving a good indication of what's ahead.
Here is the latest data available:
Sydney
| Property type | Price ($) | Weekly Change | Monthly Change % | Annual % change |
|---|---|---|---|---|
| All Houses | 2,140,696 | 7.204 | 1.4% | 9.7% |
| All Units | 883,036 | 3.764 | 0.2% | 6.4% |
| Combined | 1,627,298 | 5.627 | 1.1% | 8.7% |
Source: SQM Research
Melbourne
| Property type | Price ($) | Weekly Change | Monthly Change % | Annual % change |
|---|---|---|---|---|
| All Houses | 1,323,371 | 9.938 | 1.0% | 6.7% |
| All Units | 660,136 | -0.136 | 0.0% | 7.8% |
| Combined | 1,113,409 | 6.685 | 0.8% | 6.8% |
Source: SQM Research
Brisbane
| Property type | Price ($) | Weekly Change | Monthly Change % | Annual % change |
|---|---|---|---|---|
| All Houses | 1,371,211 | 0.942 | 1.3% | 14.6% |
| All Units | 839,511 | 5.289 | 3.4% | 25.2% |
| Combined | 1,237,133 | 1.958 | 1.7% | 16.2% |
Source: SQM Research
Perth
| Property type | Price ($) | Weekly Change | Monthly Change % | Annual % change |
|---|---|---|---|---|
| All Houses | 1,182,013 | -2.613 | -0.7% | 8.2% |
| All Units | 707,295 | 5.192 | 1.0% | 19.0% |
| Combined | 1,057,437 | -0.602 | -0.4% | 9.9% |
Source: SQM Research
Adelaide
| Property type | Price ($) | Weekly Change | Monthly Change % | Annual % change |
|---|---|---|---|---|
| All Houses | 1,113,594 | 14.106 | 2.8% | 15.8% |
| All Units | 592,806 | 0.174 | 1.3% | 21.6% |
| Combined | 1,019,822 | 11.587 | 2.6% | 16.3% |
Source: SQM Research
Canberra
| Property type | Price ($) | Weekly Change | Monthly Change % | Annual % change |
|---|---|---|---|---|
| All Houses | 1,285,470 | -2.983 | -0.1% | 5.4% |
| All Units | 587,087 | 8.163 | 2.0% | 0.7% |
| Combined | 1,026,118 | 0.798 | 0.3% | 3.8% |
Source: SQM Research
Darwin
| Property type | Price ($) | Weekly Change | Monthly Change % | Annual % change |
|---|---|---|---|---|
| All Houses | 786,984 | -2.994 | -0.7% | 12.3% |
| All Units | 455,024 | 0.851 | 2.2% | 17.4% |
| Combined | 656,448 | -1.484 | 0.1% | 13.6% |
Source: SQM Research
Hobart
| Property type | Price ($) | Weekly Change | Monthly Change % | Annual % change |
|---|---|---|---|---|
| All Houses | 868,020 | 6.070 | 0.3% | 8.1% |
| All Units | 516,746 | 1.554 | 3.6% | 4.1% |
| Combined | 814,334 | 5.340 | 0.6% | 7.7% |
Source: SQM Research
National
| Property type | Price ($) | Weekly Change | Monthly Change % | Annual % change |
|---|---|---|---|---|
| All Houses | 1,065,710 | 6.387 | 1.3% | 11.8% |
| All Units | 626,684 | -0.502 | 0.7% | 11.0% |
| Combined | 970,393 | 4.834 | 1.2% | 11.6% |
Source: SQM Research
Cap City Average
| Property type | Price ($) | Weekly Change | Monthly Change % | Annual % change |
|---|---|---|---|---|
| All Houses | 1,551,103 | 11.760 | 0.9% | 9.6% |
| All Units | 777,257 | 5.373 | 0.4% | 9.8% |
| Combined | 1,319,711 | 9.705 | 0.8% | 9.5% |
Source: SQM Research
The value of property asking prices as a leading indicator for housing markets is quite significant.
In fact it's more valuable than median prices which can be quite misleading.
Let's delve into why this is the case and how it impacts the real estate market.
- Early Market Sentiment Indicator: Asking prices often reflect the current sentiment of sellers in the real estate market.
If sellers are confident, they might set higher asking prices, anticipating strong demand.
Conversely, if sellers are uncertain or perceive a market downturn, they might lower their asking prices to attract buyers.
This makes asking prices a real-time indicator of market sentiment, often preceding changes in actual sales prices. - Predictive of Future Price Trends: Trends in asking prices can be predictive of where the actual property prices are headed.
For example, a consistent rise in asking prices over a period can signal an upcoming rise in transaction prices. - Impact of Economic Factors: Economic factors such as interest rates, employment rates, and broader economic health influence asking prices.
For instance, changes in the Reserve Bank of Australia's policies or shifts in the job market can quickly reflect in the asking prices, providing insights into how these factors are influencing the housing market. - Regional Variations: In a diverse market like Australia's, asking prices can also provide insights into regional disparities.
For instance, the property markets in Melbourne and Sydney might behave differently from those in Brisbane or Perth. Asking prices can give early indications of these regional trends. - Influence of Supply and Demand: Asking prices are also a response to the balance of supply and demand in the market.
In areas with limited supply and high demand, asking prices tend to be higher and vice versa.
However, it's important to note that while asking prices are a valuable indicator, they should not be used in isolation.
Other factors like actual sales prices, time on the market, auction clearance rates, and economic conditions also play crucial roles in understanding the property market dynamics.
READ MORE: The latest median property prices in Australia’s major cities
Last weekend's auction report
Both clearance rates and the volume of auctions are winding down for 2025.
The number of auctions held last week fell by 8.1% relative to the week prior, with 2,932 homes taken under the hammer across the combined capitals.
Auction activity is expected to fall further this week, with the volume of scheduled auctions falling to around 1,330, before reducing to virtually nothing until market activity starts picking back up in mid-January.
The preliminary clearance rate fell to 62.7% last week, 80 basis points below the week prior (63.5% which revised down to 57.7% once finalised) and marked the lowest preliminary clearance rate since the week ending December 8th, 2024.
- Also read:Latest Property Price Forecasts Revealed. Australian Property Market Outlook 2026: Where To For Prices With Further Rate Cuts Unlikely.

- Also read:This week’s Australian Property Market Update – Latest Data, State by State December 16th 2025

- Also read:Melbourne property market forecast for 2026 | Is it a good time to invest in Melbourne?

- Also read:Sydney property market forecast for 2026. Is it a good time to invest in Sydney?

- Also read:Brisbane Property Market Forecast [2026] – What’s Ahead & Where to Invest

While the reduction in volume is following the typical seasonal pattern, the gradual easing in auction clearance rates, which has been evident since mid-September, has more to do with market conditions.
Cotality’s high frequency daily Home Value Index (HVI) is showing a clear slowdown in the pace of growth through December, especially in the major auction markets of Sydney and Melbourne.
Over the past four weeks, Cotality’s daily HVI for Sydney has levelled out to a 0.0% change, while the four-week rate of growth in Melbourne values has eased back to 0.1%.

Melbourne led the volume of auctions last week with 1,474 homes going under the hammer, down 8.8% on the previous week’s volume.
The preliminary clearance rate held reasonably steady at 65.7%, 20 basis points higher than the week prior (65.5%).
966 homes were taken to auction in Sydney last week, down 11.3% from the week prior.
The preliminary clearance rate fell to the city’s lowest since the week ending December 8th, with 58.1% of auction collected so far reporting a successful result, 3.4 percentage points lower than the preliminary rate recorded (61.5%) a week ago.
Brisbane hosted 184 auctions last week, two more than the week prior, with 60.3% of results reported so far returning a positive result, a 5.6 percentage point rise on the previous week.
Adelaide saw 153 homes go to auction over the week, a 5.0% reduction on the previous week.
The preliminary clearance rate fell by 1.2 percentage points to 69.7%.
Canberra recorded 137 auctions last week, a solid 24.5% jump on the volume the week prior.
The preliminaryclearance rates also ticked higher, up 3.9 percentage points from the previous week to 59.6%.
Perth hosted 18 auctions, with 46.2% of the results collected so far retuning a positive result, while no auctions were held in Tasmania last week.
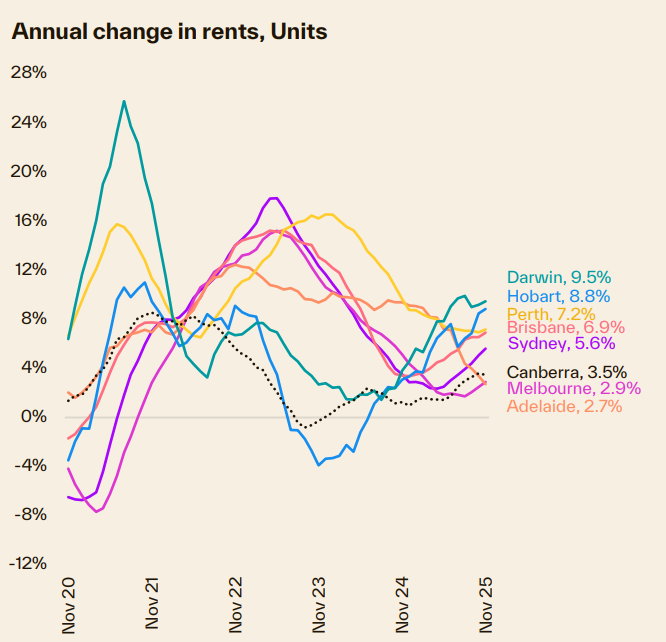
Our rental markets
Rental markets remain extremely tight with no sign of vacancy rates loosening.
Nationally, the past four months have seen rental vacancy rates holding close to record lows at just 1.5%, down from 1.9% a year ago.
With vacancy rates remaining low, rents are continuing to rise.
The national rental index rose half a per cent in November to be 5.0% higher over the past 12 months - the highest annual pace of rental growth since the same time last year.
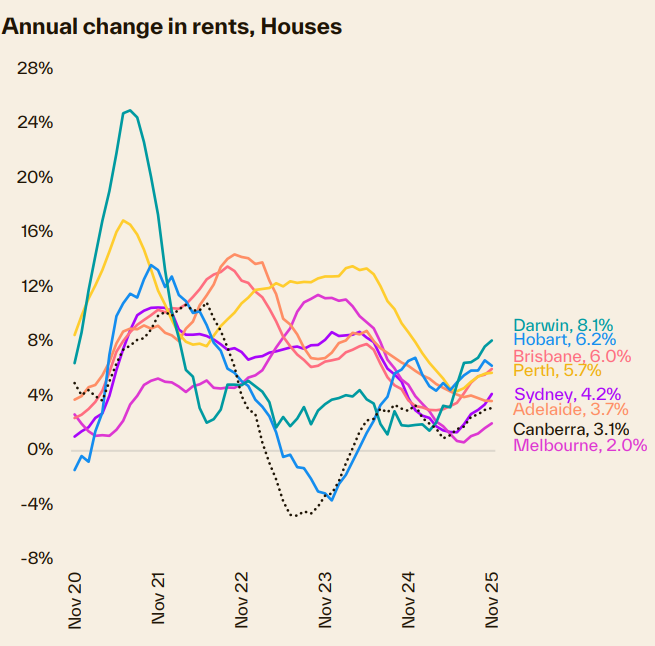
Dwelling rents are rising across every capital city, with Darwin and Hobart leading the annual gains.
Melbourne, Canberra and Adelaide are recording the mildest rental upswings, with Adelaide the only capital where annual rental growth is on an easing trajectory.
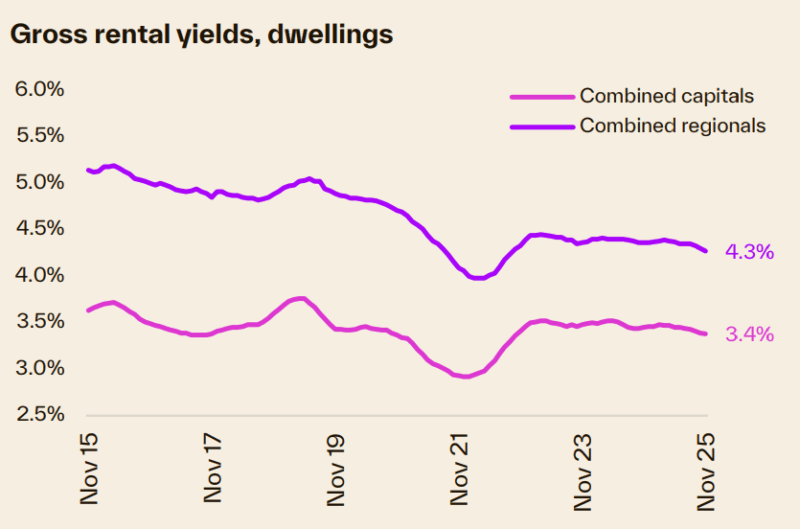
Sydney continues to record the lowest gross rental yields, at just 3.0%.
Despite this, NSW also recorded the highest share of investment activity over the September quarter, according to the ABS, with investment lending comprising 46.2% of mortgage demand by value, the highest share since the second quarter of 2017.
Sydney
| Property Type | Rent ($) | Weekly change | Monthly change | 12 Months change |
|---|---|---|---|---|
| All Houses | $1,104.63 | -7.63 | -1.2% | 6.5% |
| All Units | $728.20 | -2.20 | -0.1% | 5.8% |
| Combined | $880.25 | -4.40 | -0.7% | 6.2% |
Source: SQM Research
Melbourne
| Property Type | Rent ($) | Weekly change | Monthly change | 12 Months change |
|---|---|---|---|---|
| All Houses | $769.50 | -1.50 | 0.2% | 2.4% |
| All Units | $563.80 | 1.20 | 0.2% | 4.2% |
| Combined | $649.82 | 0.07 | 0.2% | 3.5% |
Source: SQM Research
Brisbane
| Property Type | Rent ($) | Weekly change | Monthly change | 12 Months change |
|---|---|---|---|---|
| All Houses | $777.99 | 0.01 | 0.0% | 7.0% |
| All Units | $618.43 | 1.57 | 0.7% | 6.1% |
| Combined | $706.15 | 0.71 | 0.3% | 6.7% |
Source: SQM Research
Perth
| Property Type | Rent ($) | Weekly change | Monthly change | 12 Months change |
|---|---|---|---|---|
| All Houses | $852.37 | 7.63 | 2.2% | 5.7% |
| All Units | $649.02 | -0.02 | -0.3% | 4.5% |
| Combined | $768.30 | 4.47 | 1.3% | 5.3% |
Source: SQM Research
Adelaide
| Property Type | Rent $) | Weekly change | Monthly change | 12 Months change |
|---|---|---|---|---|
| All Houses | $684.60 | -0.60 | 0.6% | 2.8% |
| All Units | $524.02 | 0.98 | 0.5% | 4.7% |
| Combined | $630.33 | -0.07 | 0.6% | 3.4% |
Source: SQM Research
Canberra
| Property Type | Rent ($) | Weekly change | Monthly change | 12 Months change |
|---|---|---|---|---|
| All Houses | $791.48 | -2.48 | 0.0% | 1.8% |
| All Units | $578.17 | 0.83 | 0.2% | 2.4% |
| Combined | $674.47 | -0.66 | 0.1% | 2.0% |
Source: SQM Research
Darwin
| Property Type | Rent ($) | Weekly change | Monthly change | 12 Months change |
|---|---|---|---|---|
| All Houses | $760.67 | -3.67 | 0.0% | 2.1% |
| All Units | $578.36 | 3.64 | 0.6% | 8.7% |
| Combined | $652.89 | 0.65 | 0.3% | 5.6% |
Source: SQM Research
Hobart
| Property Type | Rent 9$) | Weekly change | Monthly change | 12 Months change |
|---|---|---|---|---|
| All Houses | $591.52 | -7.52 | -1.0% | 8.9% |
| All Units | $517.79 | 1.21 | 3.0% | 9.0% |
| Combined | $562.16 | -4.04 | 0.5% | 9.0% |
Source: SQM Research
National
| Property Type | Rent ($) | Weekly change | Monthly change | 12 Months change |
|---|---|---|---|---|
| All Houses | $744.00 | 1.00 | 0.3% | 6.0% |
| All Units | $583.00 | 1.00 | 1.0% | 6.2% |
| Combined | $669.41 | 1.00 | 0.6% | 6.1% |
Source: SQM Research
Cap City Average
| Property Type | Rent ($) | Weekly change | Monthly change | 12 Months change |
|---|---|---|---|---|
| All Houses | $880.00 | -1.00 | -0.2% | 4.9% |
| All Units | $649.00 | 0.00 | -0.2% | 5.4% |
| Combined | $757.26 | -0.47 | -0.2% | 5.1% |
Source: SQM Research
Sellers of good properties are on strike
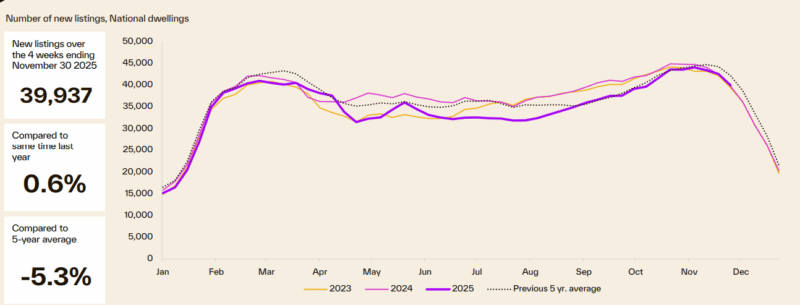
The rolling 28-day count in national new listings peaked over the four weeks to November 9th at 44,074 and has trended lower as the spring selling season comes to a close.
Over the four weeks to November 30th, national new listings levels were roughly in line with this time last year (0.6%) but -5.3% below the historic five-year average.
Over the four weeks to November 30th, Cotality observed 130,047 properties for sale nationally, down -14.0% from the total number of listings seen this time last year.
While new listings have trended roughly in line with historic averages since mid-September, strong sales activity has seen total advertised supply remain around -18% below the levels usually seen through spring.
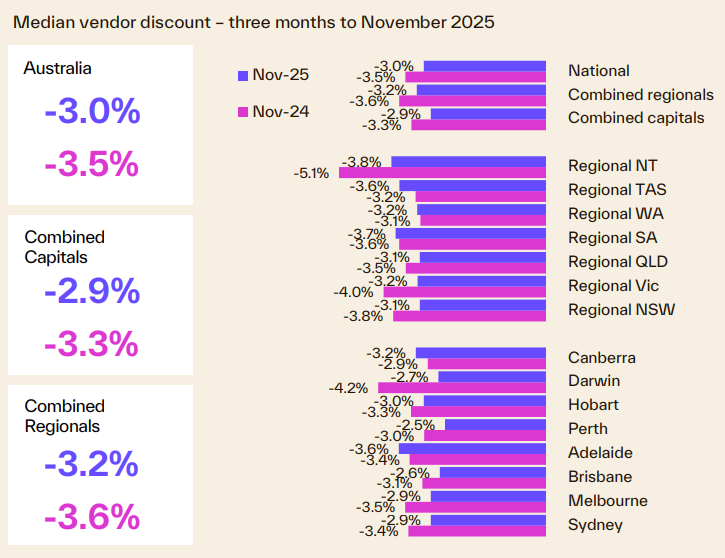
Vendor metrics
As the following chart shows, it's taking longer to sell a home.
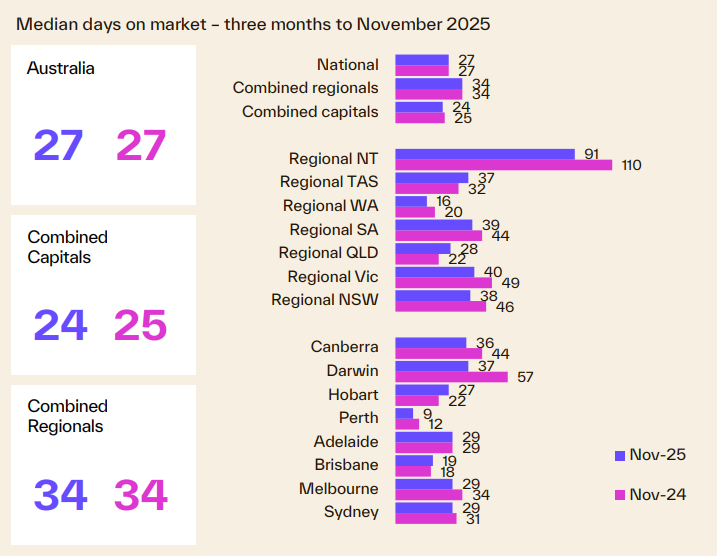
While the median selling time has increased slightly over the month nationally, at 27 days, the median time on market over the three months to November is in line with the same time last year.
Results are more varied across the capitals and regions.
Compared to this time last year, Darwin (37 days), Canberra (36 days), Melbourne (29 days), Perth (9 days) and Sydney (29 days) all saw faster selling times, while properties in Brisbane (19 days) and Hobart (27 days) took longer to transact.