


Key takeaways
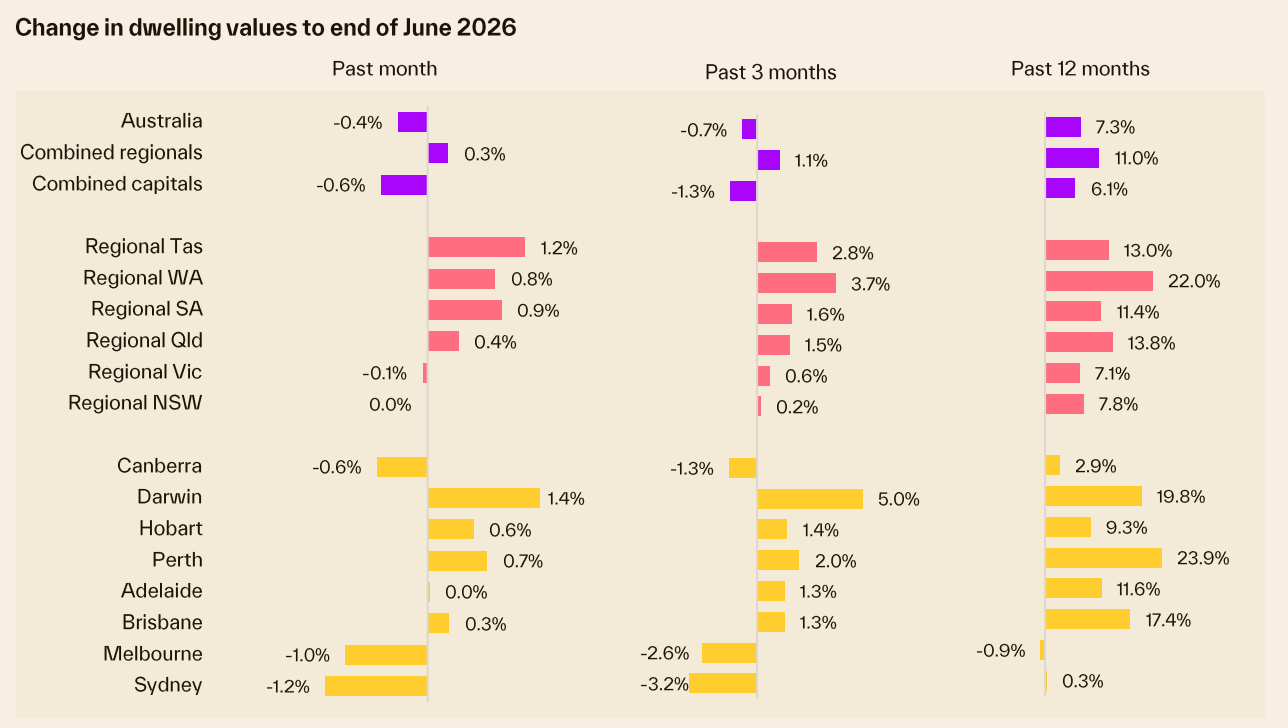
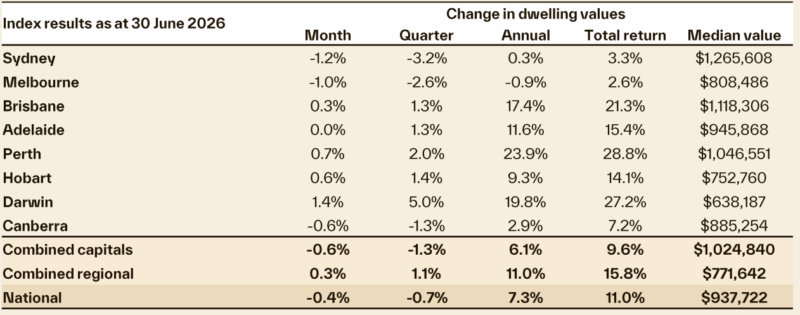
Cotality's national Home Value Index fell 0.4% in June, the largest monthly fall since December 2022, with capital city values down 1.3% over the quarter.
Sydney and Melbourne are leading the downturn, down 3.2% and 2.6% respectively over the June quarter, while Perth, Adelaide and Brisbane are still recording gains, though well below last year's pace.
Domain's FY27 forecast has Sydney and Melbourne house prices falling over the year to June 2027, while Perth, Adelaide and Brisbane are tipped to reach record highs.
ANZ, Westpac IQ and CBA have all downgraded their 2026 growth forecasts, with Westpac IQ now expecting dwelling prices to stall flat nationally for the calendar year.
The RBA held the cash rate at 4.35% in June after three rises earlier in the year, and most economists now expect the first rate cut around the middle of 2027.
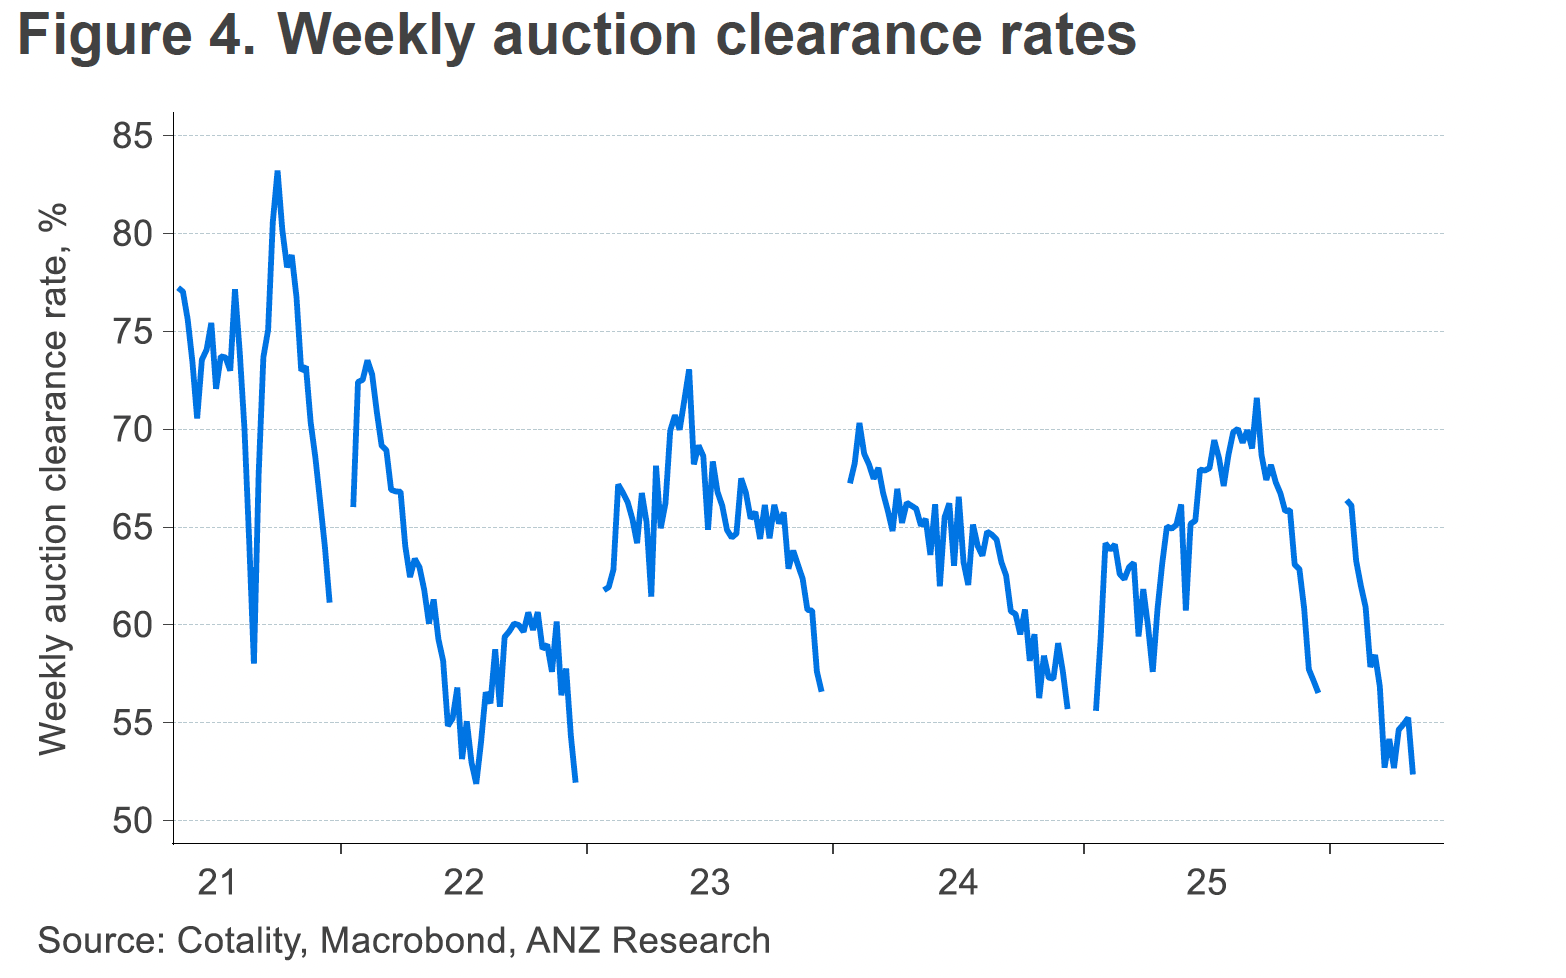
Auction clearance rates have sat below 50% since late May, and capital city home sales are down 16.2% on a year ago.
Despite the near-term softness, the structural drivers of Australian property values - population growth, chronic undersupply and rising national wealth - remain intact.
Six months ago the conversation about Australian property was all about resilience, about how our markets kept climbing despite thirteen rate rises and a cost of living squeeze that refused to ease.
That conversation has changed.
Cotality's national Home Value Index fell 0.4% in June, the sharpest monthly drop since December 2022 with the June quarter delivering the first genuinely soft result for our two largest cities in years, with Sydney values down 3.2% and Melbourne down 2.6%.
Auction clearance rates have been stuck below 50% since late May, capital city home sales are running 16.2% below where they were a year ago, and stock on market has been building.
If you've been reading the headlines and wondering whether the growth cycle has finally turned, you're asking a fair question.
But the honest answer isn't a simple yes or no. What's happening in Sydney and Melbourne right now looks nothing like what's happening in Perth, Adelaide and Brisbane, and that divergence is the real story of this cycle.
And even within the Melbourne and Sydney property markets, different segments are performing differently, with some still holding up well and units outperforming houses.
I've spent five decades watching these cycles unfold, and this one has an unusual shape - three RBA rate rises landed in quick succession earlier in the year, the federal Budget delivered the biggest shake-up to property taxation in nearly three decades, and both are now showing up in the data within weeks of each other.
Let me walk you through what's actually happening, what the forecasters are now saying about the year ahead, and where I still see opportunity in a market that's clearly moved into a more difficult phase.
Source: Cotality.
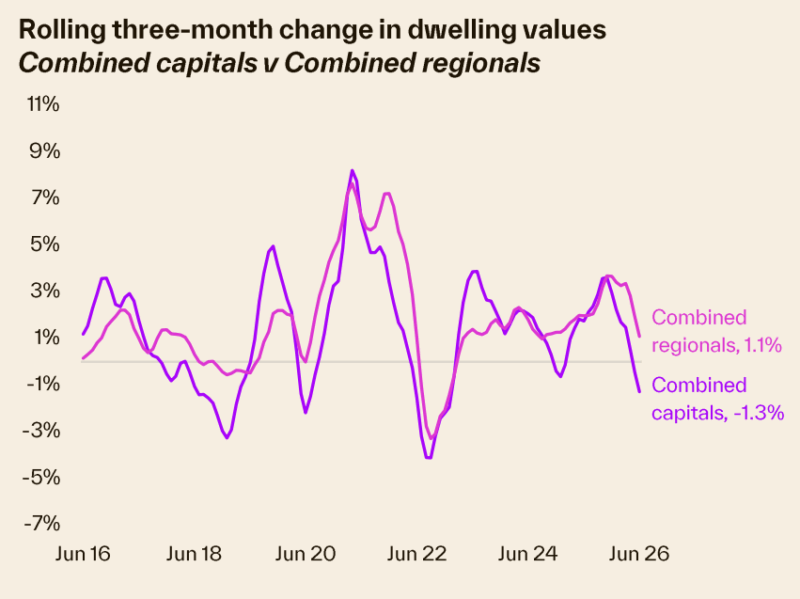
While regional markets became popular with buyers escaping the cost of city living a couple of years ago, the long-term pattern still holds.
Capital city markets continue to outpace regional areas over time, even though regional values have been outperforming the capitals over the past couple of quarters as buyers chase relative affordability.
Overall, persistently low supply relative to demand are supporting housing values despite high interest rates, ongoing cost of living pressures, worsening affordability pressures and a deeply pessimistic level of consumer confidence.
The gap between house and unit values has also been narrowing.
Units underperformed for most of the pandemic period, but affordability constraints mean more Australians are trading backyards for balconies, and that's helped apartment values hold up noticeably better than houses through this downturn.
The good news is that this creates a window of opportunity, as one can now buy established family friendly apartments considerably below replacement cost.
What the May 2026 Budget means for property investors
The May 2026 federal Budget was the most significant shake-up to property taxation in nearly three decades, and I've had a steady stream of questions from investors trying to work out what it actually means for them.
Let me give you the practical picture rather than the headline version.
Two major changes take effect from 1 July 2027.
- Negative gearing on established residential properties will be restricted, so rental losses can no longer be offset against salary or other income and will instead be quarantined to offset only property income or future capital gains.
- The 50% capital gains tax discount will be replaced by cost base indexation, with a 30% minimum tax applied to capital gains.
If you purchased your investment before 7:30pm on Budget night, 12 May 2026, nothing changes for you. The grandfathering provisions are generous and deliberate, and you can keep negatively gearing and accessing the old CGT discount exactly as before.
Moving forward, newly constructed properties, including off-the-plan apartments and new house and land packages, remain fully exempt from both changes, and investors can still negatively gear and choose whichever CGT treatment suits them.
But I would be very wary of investing in this type of property.
So while the headlines made this sound like the end of property investing as we know it, the long-term fundamentals driving Australian property values - population growth, structural undersupply, and accumulating national wealth - remain firmly intact.
In other words, property investment got more complicated, but it's still the best wealth building strategy around.
What will this actually do to property prices?
Domain's FY27 Housing Market Forecast, released in June, paints a two-speed picture. Sydney and Melbourne are forecast to fall over the year to June 2027, Canberra is expected to be flat to slightly down, and Brisbane, Adelaide and Perth are tipped to keep growing and reach record highs.
Domain's FY27 house price forecast (year to June 2027)
| City | Lower estimate | Upper estimate |
|---|---|---|
| Sydney | -7% | -3% |
| Melbourne | -8% | -4% |
| Canberra | -4% | flat |
| Brisbane | +3% | +7% |
| Adelaide | +4% | +8% |
| Perth | +5% | +9% |
| Combined capitals | -2.5% | +1.5% |
Source: Domain FY2027 Housing Market Forecast
Units are holding up noticeably better than houses across the board, with Sydney and Melbourne unit values forecast to slip only 1% to 3%, well short of the falls expected for houses in those cities.
And even within the Melbourne and Sydney property markets, properties below the median price are likely to hold their values well and continue to increase, while the upper end of the market is likely to continue to fall in value.
Domain expects a gradual recovery to begin around the middle of 2027, timed to when the first rate cut is expected to land.
The major banks have landed in a similar place, even if their numbers differ slightly.
ANZ Research has downgraded its capital city growth forecast to just 2.8% for 2026 and 2.1% for 2027.
Westpac IQ now expects dwelling price growth to stall flat on average across the major capitals for the whole of calendar 2026, with Sydney and Melbourne recording outright declines.
CBA is sitting in a similar spot, expecting prices to be roughly flat this year before a modest recovery to around 3% growth in 2027.
ANZ expects Sydney and Melbourne to lead the recovery once rates start falling in 2027, just as the mid-sized capitals that have run hardest, Adelaide, Brisbane and Perth, start to lose momentum after several strong years.

Note: Cycles rotate, and the cities that feel weakest today are often the ones that snap back hardest once conditions turn.
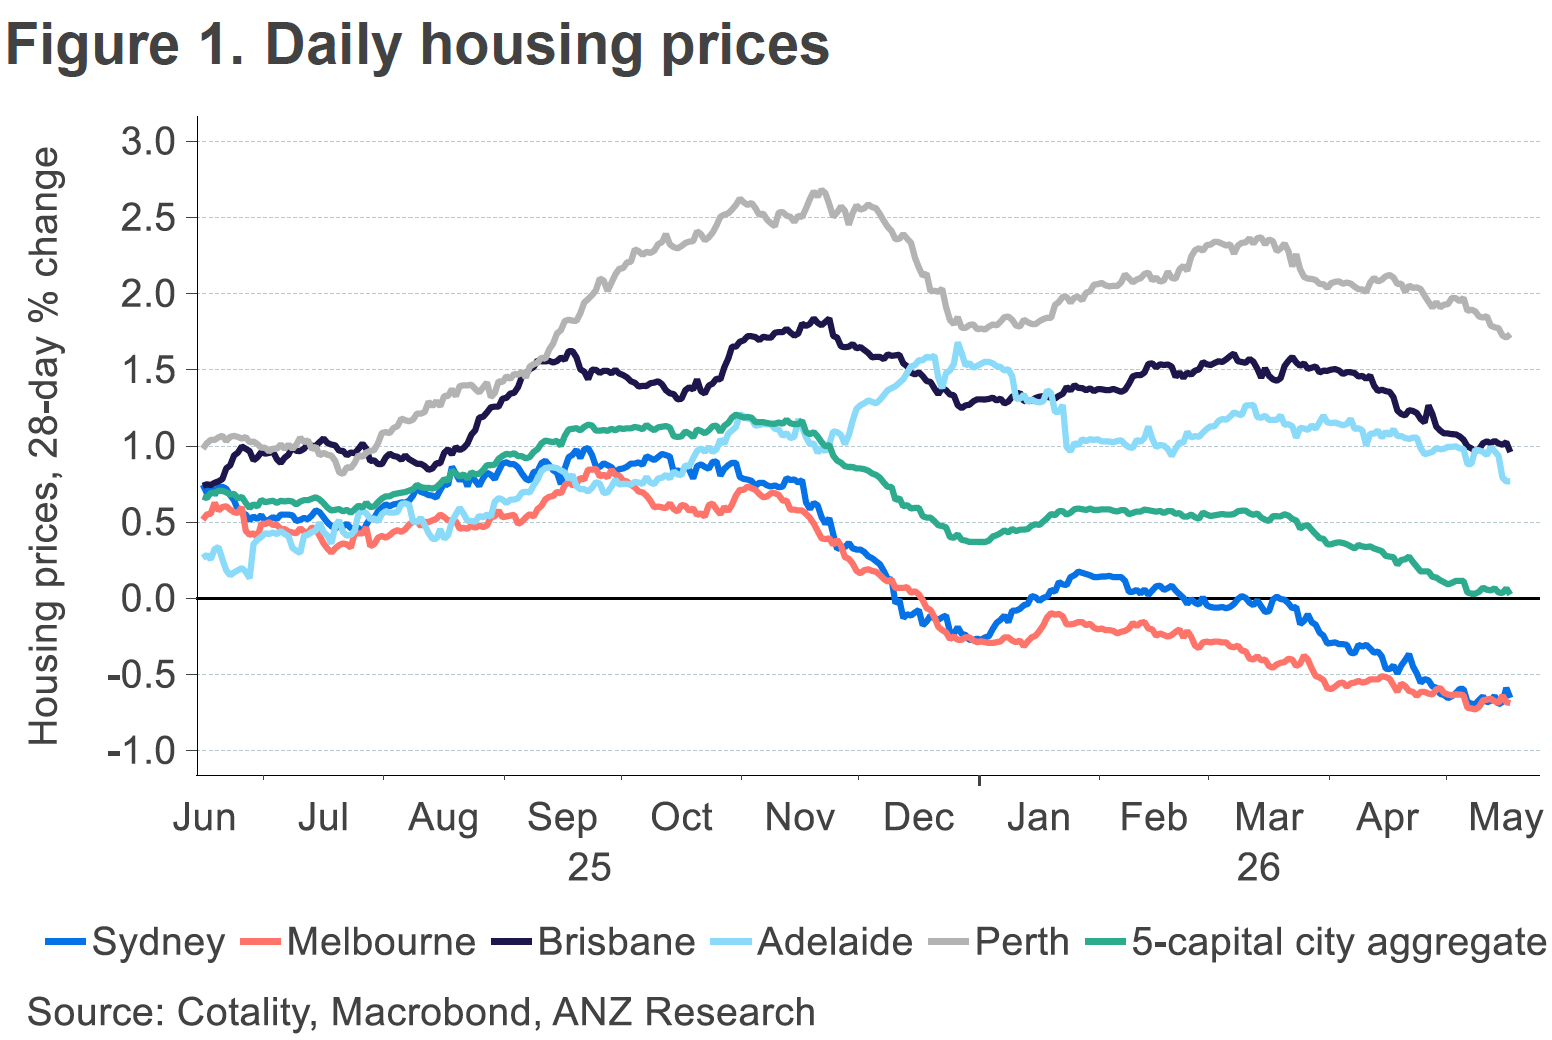
The chart above shows that Sydney and Melbourne were already losing momentum heading into 2026, while other cities like Adelaide and Perth held firmer. The budget is one more piece of the picture, not the whole story.
In the short term, watch the "in-time" indicators closely - particularly auction clearance rates and total listings. Those will tell you more about buyer and seller behaviour than any single policy announcement.
On the supply side, there's actually a case to be made that the grandfathering provisions could keep a lid on listings from existing investors.
If current owners of established properties know they're protected under the old rules as long as they hold, many will simply hold longer rather than sell.
In a market already running lean on stock in the right suburbs, that dynamic could soften any downward price pressure considerably.
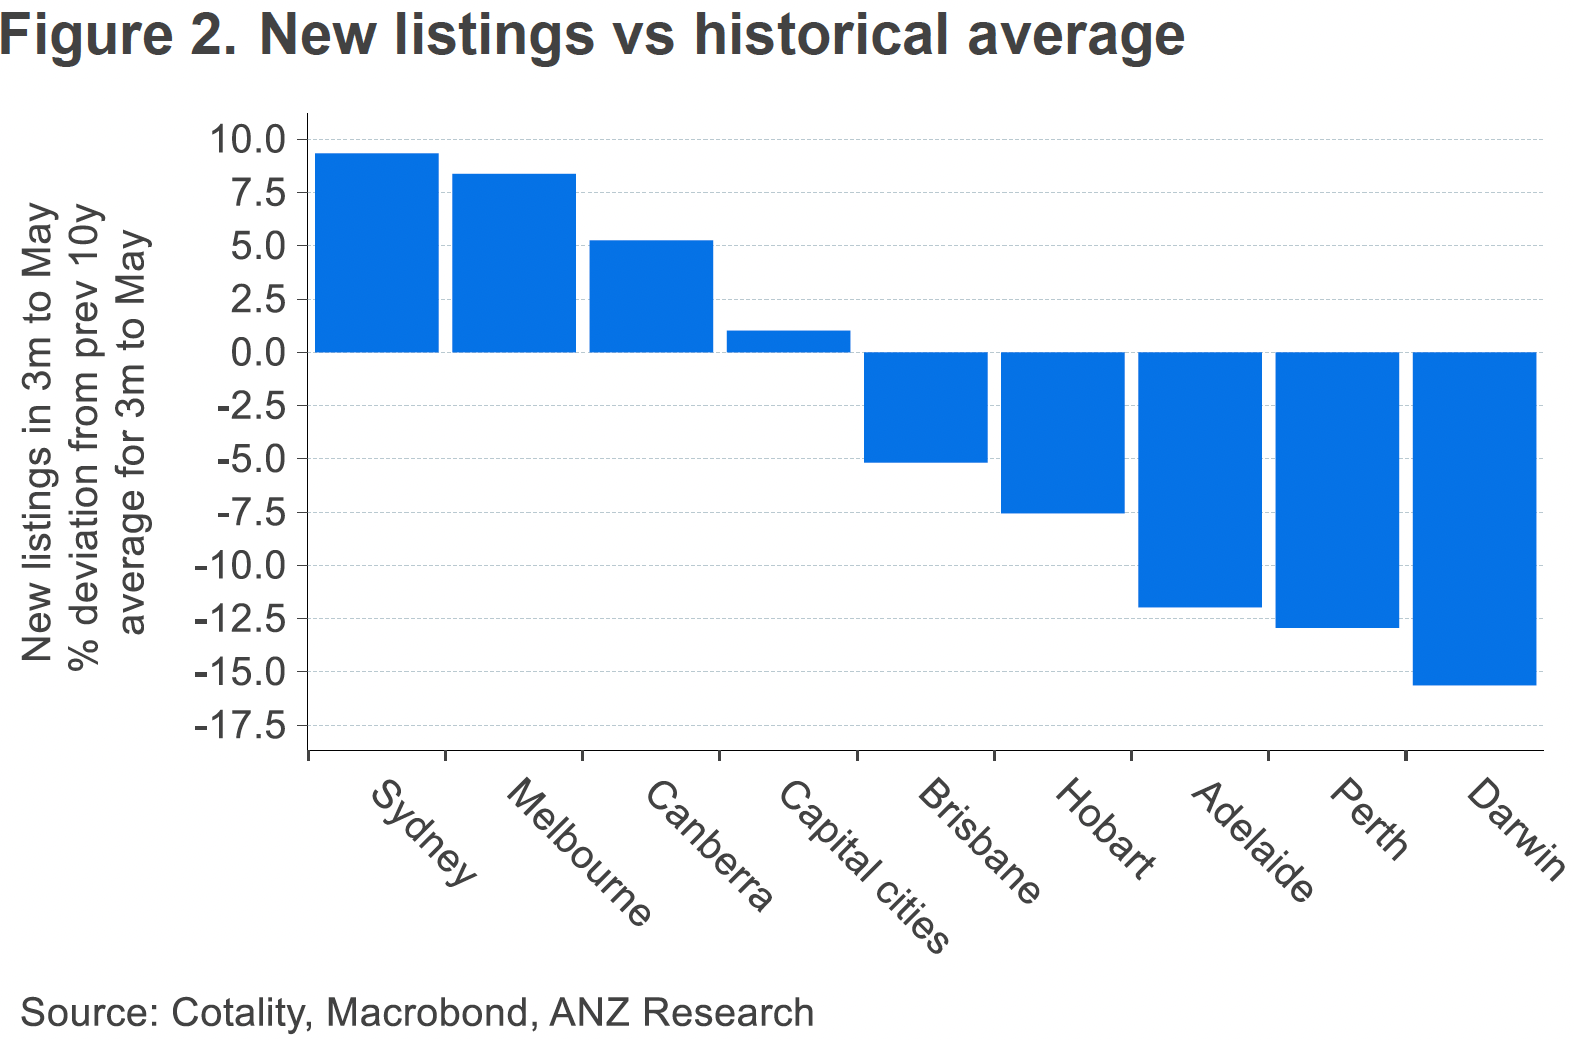
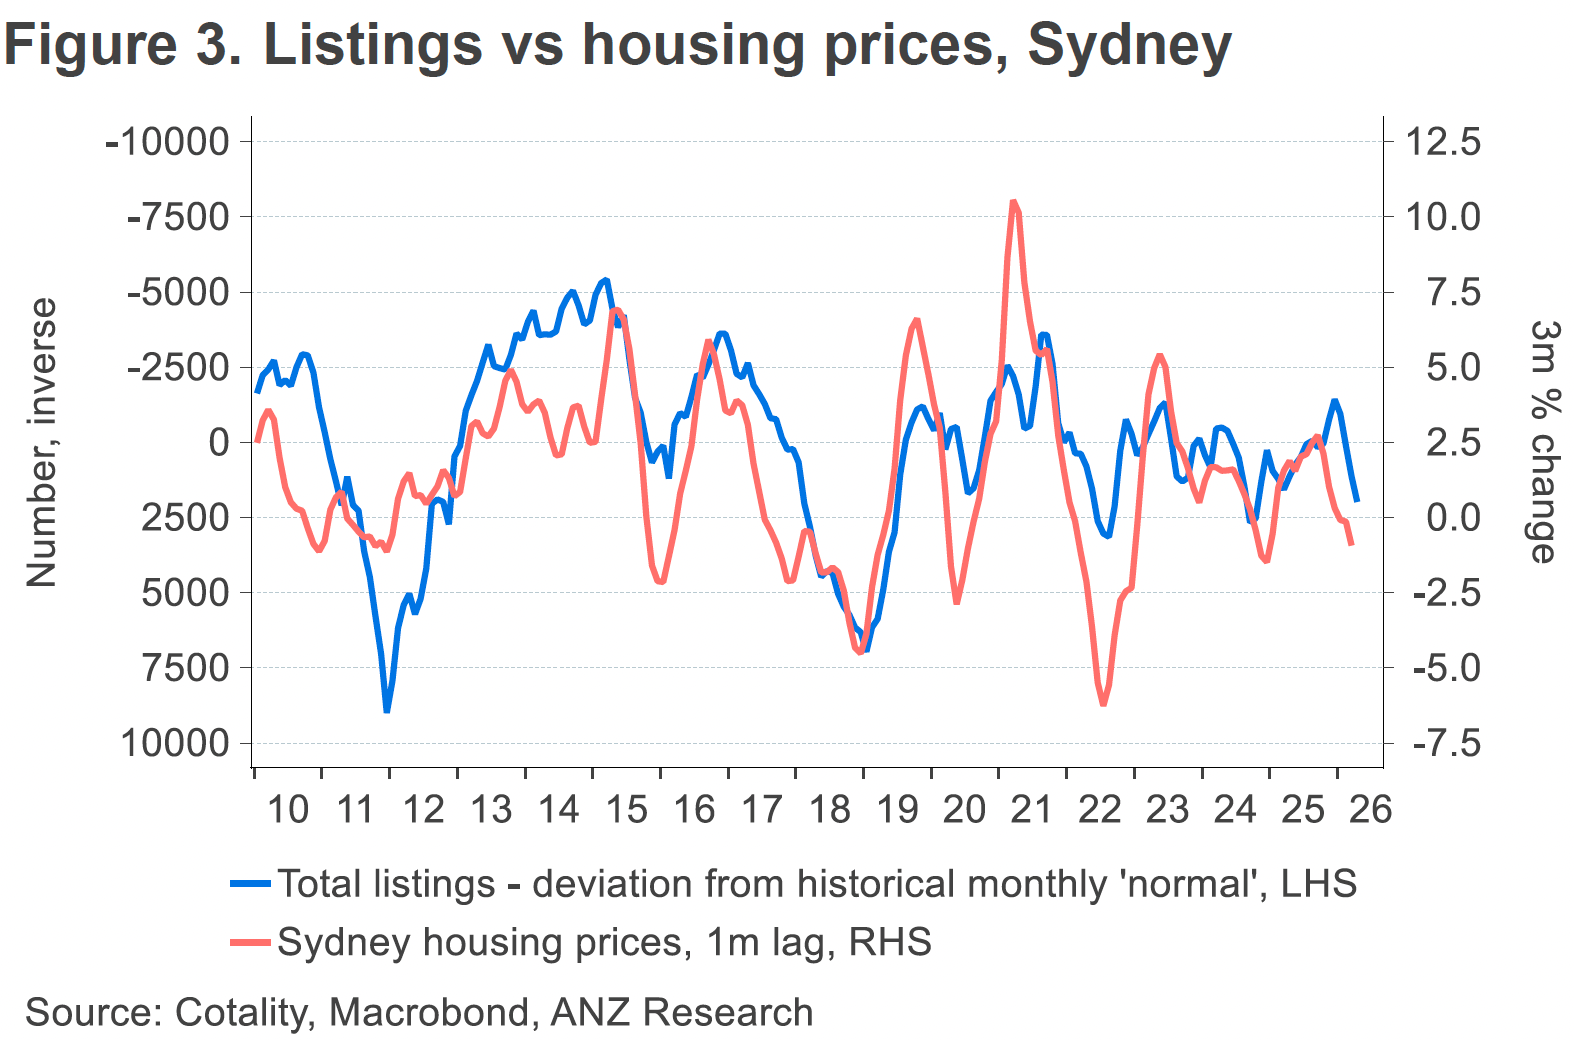
Sydney and Melbourne are the outliers, where listings are running above their long-term norms.
That's already weighing on prices in those two cities. The relationship between listing volumes and house prices in Sydney over the past 15 years makes this very clear.
The deeper point, which gets lost in all the budget commentary, is that macro factors - particularly the direction of interest rates - will matter just as much to where prices go from here.
A falling rate environment, which most economists still expect through 2027, provides a structural offset to the demand-side impact of the tax changes.
So what's ahead?
The rest of 2026 and much of 2027 is likely to feel considerably more subdued than the past couple of years, and growth will diverge sharply by location and property type rather than moving together the way it has in the past.
The most desirable suburbs, the inner and middle-ring, gentrifying, high-amenity locations, are best placed to hold their value and recover first once conditions turn. These suburbs benefit from scarcity and genuine owner-occupier demand, which doesn't disappear just because investor activity slows.
Outer suburban markets, by contrast, are likely to feel this correction most acutely. Weaker wage growth, limited lifestyle infrastructure and a larger pool of highly leveraged owners with little buffer make these areas more exposed when conditions tighten.
Well-located houses and family-friendly apartments in lifestyle suburbs should continue to outperform the broader market, even while the broader market itself is flat or falling.
That's been true in every downturn, and I see no reason this one will be different.
The pool of buyers for established investment properties will likely be smaller going forward, which will put modest downward pressure on prices at the margin, particularly in the investment-heavy segments of the market.
But well-located, A grade homes and investment-grade properties - the kind I've always argued you should be buying - will remain highly sought after by owner-occupiers, who are completely unaffected by these changes.
Owner-occupier demand drives prices in the gentrifying inner and middle-ring suburbs I favour.
Apartment rents set to surge over the next few years.
Median apartment rents are likely to grow by 24% between 2025 and 2030 across Australian capital cities, according to CBRE.
By 2030, 92% of two-bedroom apartments are forecast to have rents exceeding $700 a week, with a third exceeding $1,000 a week.
CBRE expects capital city vacancy rates to fall further, from 1.8% in 2025 to just 1.1% by 2030.
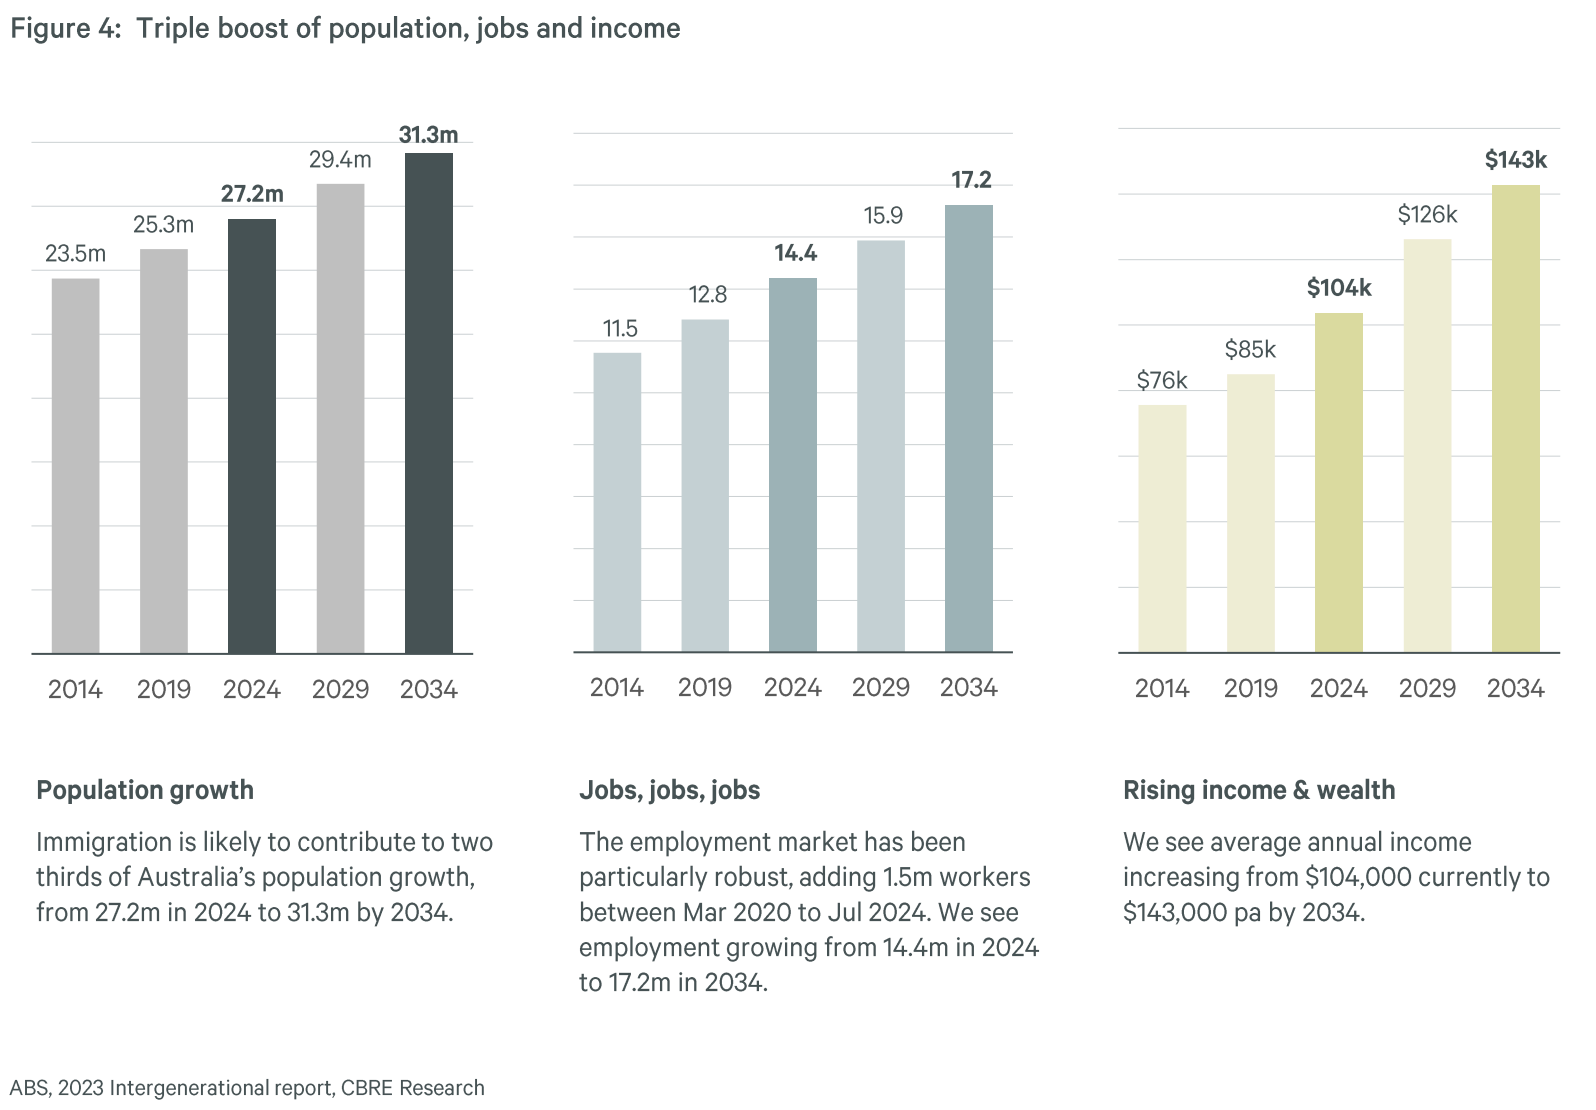
Over the next decade, demand for housing is expected to benefit from a triple boost of rising population, rising jobs and rising income, adding around $960 billion of additional income into the system to support mortgages, rent and living expenses
You can always beat the averages.
While the averages point to a flat or softer year ahead, the good news hasn't changed - you can still beat those averages by investing in the right property in the right location.
By that I don't mean chasing the next hotspot. I mean buying quality properties in locations that will outperform over the long term, such as gentrifying suburbs with strong owner-occupier demand.
Property also offers something the sharemarket doesn't, which is the ability to improve your results through your own time, skills and knowledge.
You don't need to settle for average, because you can add value through refurbishment or redevelopment in a way that simply isn't available to a passive investor.
What's ahead for interest rates?
The RBA raised the cash rate three times in 2026, in February, March and May, taking it from 3.60% to 4.35% and effectively unwinding all three of the cuts delivered through 2025.
All four major banks passed on the full increases to variable-rate customers within days of each decision.
The Board held the cash rate steady at 4.35% in June, giving households some breathing space after that run of increases.
Australia's unemployment rate jumped to 4.5% in the April data, the highest seasonally adjusted rate since November 2021, and that softening labour market is a big part of why the RBA has paused.
Economists are now largely converging on the view that rates will stay on hold through the rest of 2026, with the first cut expected around the middle of 2027, contingent on inflation continuing to ease.
Underlying inflation is still running above the RBA's target band, so there's no guarantee that timeline holds if price pressures prove sticky.
How does this affect what buyers can borrow?
Each 25 basis point rate rise reduces the maximum borrowing capacity of an average income earner by around $12,000.
Three hikes in quick succession means a single-income buyer at average wages has lost roughly $36,000 in borrowing power since the start of 2026, and a dual-income couple has lost around $72,000.
Domain's research puts this in slightly different terms, estimating that overall borrowing capacity has fallen by 7% to 8% following the recent rate increases. That's the single biggest reason Sydney and Melbourne, where buyers borrow the most relative to their incomes, are feeling this cycle more sharply than Perth, Adelaide and Brisbane.
On an average loan of $736,000, each 25 basis point increase adds roughly $120 a month to repayments. Three hikes in a row means many borrowers are absorbing an extra $360 per month compared to where they started the year.
That's real money, and it is already shaping buyer behaviour. More buyers are gravitating toward units and townhouses rather than houses, toward the middle ring rather than the inner ring, and toward suburbs with lower price points where their reduced borrowing capacity still gets them access to the market.
| Borrower | Feb hike | Feb + March + May (combined) |
|---|---|---|
| Individual (avg. wage) | -$12,000 | -$36,000 |
| Couple (2 x avg. wage) | -$24,000 | -$72,000 |
Source: Canstar. Based on owner-occupier, 30-year loan, principal and interest.
But let me put this in context... Property markets kept rising through 2022 and 2023 when the RBA delivered thirteen consecutive rate rises.
The structural forces underneath our markets, population growth and chronic undersupply, absorbed that cycle, and I expect them to absorb this one too, even though the pace of recovery will depend heavily on when rates actually start to fall.
The investors feeling this most are those who are highly leveraged with little buffer, along with first home buyers stretched to the edge of their borrowing capacity.
For investors who bought well, structured conservatively and have equity to work with, this environment is more a test of patience than a genuine threat to their long-term position.
And when rates do eventually turn, which most economists now expect from mid-2027, there will be a meaningful lift in borrowing capacity that flows straight back through the market.

Tip: History suggests that lift tends to arrive faster than anyone expects, and the buyers who were positioned before it happened are the ones who benefit most.
Why some markets are falling while others keep climbing
For years, the question I was asked most was how our property markets kept rising despite high interest rates and a serious cost-of-living crisis.
The question now is a different one, because it's no longer a single national story.
Wealthy buyers with large deposits, downsizers sitting on years of home equity, and the bank of mum and dad are still active in the market and still supporting prices at the top end.
Note: A third of properties sold last year were transacted with no mortgage at all, which tells you a meaningful part of the buyer pool simply isn't affected by what the RBA does.
At the other end of the market, first home buyer incentives are adding demand at a time of limited supply, which is keeping the affordable end of the market firmer than the middle.
Some buyers are responding to tighter borrowing capacity by shifting to cheaper cities, or from houses into units, and rentvestors are continuing to buy investment property while renting where they actually want to live.
None of that has been enough to hold up Sydney and Melbourne, where listings are running above their long-term averages and borrowing capacity has taken the biggest hit, but it has been enough to keep Perth, Adelaide and Brisbane in positive territory, where housing remains genuinely undersupplied relative to demand.
That's the two-speed market in a nutshell, and I expect it to persist until interest rates start moving the other way.
The latest housing market stats
Here are the latest stats provided by CoreLogic for property price changes around Australia:
We also keep track of “Asking Prices” as these are a good leading indicator for the property market because they reflect the sentiment of sellers and their expectations for the future value of their homes.
Sydney Property Asking Prices
| Property type | Price ($) | Weekly Change | Monthly Change % | Annual % change |
|---|---|---|---|---|
| All Houses | 2,057.920 | 5.070 | -1.4% | -0.3% |
| All Units | 887.373 | -2.373 | -2.8% | 2.7% |
| Combined | 1,579.162 | 2.026 | -1.8% | 0.3% |
Source: SQM Research, July 2026
Melbourne Property Asking Prices
| Property type | Price ($) | Weekly Change | Monthly Change % | Annual % change |
|---|---|---|---|---|
| All Houses | 1,307.199 | -3.872 | -1.0% | 0.7% |
| All Units | 677.626 | 0.088 | -1.0% | 7.9% |
| Combined | 1,08.003 | -2.619 | -1.0% | 1.9% |
Source: SQM Research, July 2026
Brisbane Property Asking Prices
| Property type | Price ($) | Weekly Change | Monthly Change % | Annual % change |
|---|---|---|---|---|
| All Houses | 1,384.952 | -5.852 | -0.6% | 10.6% |
| All Units | 859.686 | -3.086 | -2.4% | 16.8% |
| Combined | 1,251.811 | -5.151 | -0.9% | 11.5% |
Source: SQM Research, July 2026
Perth Property Asking Prices
| Property type | Price ($) | Weekly Change | Monthly Change % | Annual % change |
|---|---|---|---|---|
| All Houses | 1,285.052 | -12.752 | -0.7% | 11.9% |
| All Units | 775.032 | -2.412 | -1.2% | 19.4% |
| Combined | 1,150.921 | -10.033 | -0.8 | 13.1% |
Source: SQM Research, July 2026
Adelaide Property Asking Prices
| Property type | Price ($) | Weekly Change | Monthly Change % | Annual % change |
|---|---|---|---|---|
| All Houses | 1,130.065 | -7.232 | 0.0% | 8.0% |
| All Units | 631.357 | 1.443 | 1.1% | 13.1% |
| Combined | 1,040.112 | -5.667 | 0.1% | 8.5% |
Source: SQM Research, July 2026
Canberra Property Asking Prices
| Property type | Price ($) | Weekly Change | Monthly Change % | Annual % change |
|---|---|---|---|---|
| All Houses | 1,255.174 | -12.187 | -1.8% | 2.8% |
| All Units | 602.653 | -3.778 | -1.8% | 1.2% |
| Combined | 1,006.537 | -8.983 | -1.8% | 2.0% |
Source: SQM Research, July 2026
Darwin Property Asking Prices
| Property type | Price ($) | Weekly Change | Monthly Change % | Annual % change |
|---|---|---|---|---|
| All Houses | 837.965 | 7.835 | -1.3% | 5.3% |
| All Units | 490.799 | 4.451 | 4.4% | 16.7% |
| Combined | 701.399 | 6.504 | 0.2% | 8.2% |
Source: SQM Research, July 2026
Hobart Property Asking Prices
| Property type | Price ($) | Weekly Change | Monthly Change % | Annual % change |
|---|---|---|---|---|
| All Houses | 923.855 | -5.219 | -1.4% | 9.7% |
| All Units | 540.765 | -2.965 | -3.0% | 8.2% |
| Combined | 865.125 | -4.873 | -1.5% | 9.5% |
Source: SQM Research, July 2026
National Property Asking Prices
| Property type | Price ($) | Weekly Change | Monthly Change % | Annual % change |
|---|---|---|---|---|
| All Houses | 1,071.032 | -3.387 | -0.1% | 6.6% |
| All Units | 655.465 | 1.295 | -0.2% | 11.2% |
| Combined | 980.466 | -2.367 | -0.1% | 7.2% |
Source: SQM Research, July 2026
Capital Cities Property Asking Prices
| Property type | Price ($) | Weekly Change | Monthly Change % | Annual % change |
|---|---|---|---|---|
| All Houses | 1,528.972 | -2.334 | -0.9% | 2.8% |
| All Units | 790.359 | -0.171 | -1.5% | 6.2% |
| Combined | 1,307.286 | -1.685 | -1.1% | 3.2% |
Source: SQM Research, July 2026
The fundamentals of what drives Australian property prices
If you take a telescopic view rather than a microscopic one, the two big forces that will drive our housing markets over the next decade or two are demographics, meaning how many of us there are and where we want to live, and the wealth of the nation.
But it's worth digging into the medium-term drivers that are shaping the market right now.
1. Interest rates and affordability
Interest rates are often treated as the single biggest driver of property values, which is why there were so many pessimistic forecasts when the RBA delivered 13 rate rises through 2022 and 2023.
However, our markets showed real resilience through that cycle and kept rising in value regardless.
This cycle has behaved differently, at least in Sydney and Melbourne, where the combination of higher rates and Budget changes has coincided with actual price falls rather than just slower growth.
That doesn't mean the old relationship has broken down completely - it means rates matter more at the margin than they used to, particularly in the cities where buyers carry the most debt relative to their incomes.
2. Supply and demand
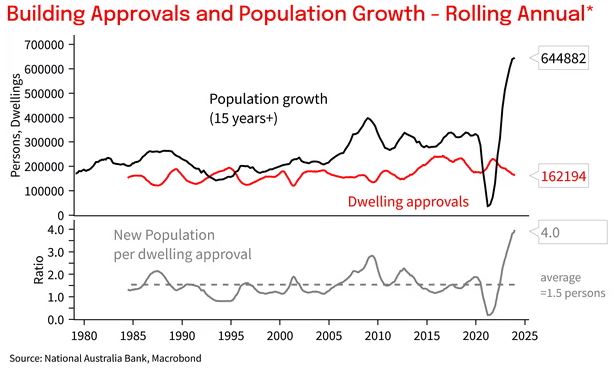
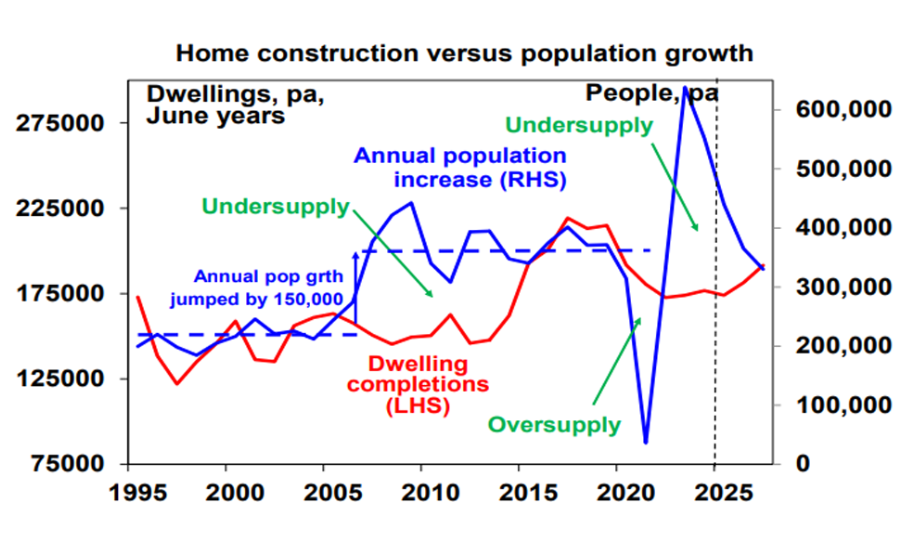
Housing supply has a significant influence over prices in the short term. An undersupply puts upward pressure on prices, while an oversupply does the opposite, and right now we're simply not building enough new dwellings to keep pace with population growth.
Record immigration in recent years meant an extra 250,000 or so new homes needed to be built annually, yet completions have been running closer to 170,000 as the building industry struggles with rising costs and labour and material shortages. It's been conservatively estimated that we now have an accumulated housing shortage of around 250,000 dwellings, and that gap isn't likely to close within the next decade.
Very few new apartment complexes are coming out of the ground at the moment, because it simply isn't financially viable to build them at today's prices. That means future new developments will need to sell at prices considerably higher than today's market value, which will in turn pull up the value of established apartments over time.
3. Consumer confidence
Consumer confidence is a critical factor in the direction of property prices because we don't make major financial decisions, like buying a home or an investment property, unless we feel reasonably secure about our economic future.
Confidence has been hit hard by the combination of Budget changes, rate rises, and cost of living pressure, and that's clearly visible in the current softness in buyer activity.
This too will pass, and as rates eventually ease and the wealth effect of a recovering economy takes hold, confidence tends to return faster than most people expect.
4. Economic climate
The overall health of the economy, measured through GDP, employment data and inflation, remains a key driver of our property markets.
The RBA has been trying to slow the economy to bring inflation under control, and unemployment has ticked up to 4.5%, the highest level since late 2021.
Even so, most people who want a job can still get one, and that broad employment strength continues to underpin our housing markets even as growth slows.
5. Population growth
Overseas migration added a net 446,000 people to Australia's population in the year to June 2024, down from the record 536,000 the year before as we worked through the post-pandemic surge.
Population growth remains one of the most reliable long-term drivers of housing demand, and even at a slightly reduced pace, the numbers arriving each year are still substantial relative to how much housing we're actually building.
6. Availability of credit
When credit is easy to access, with lower rates and less stringent lending criteria, it tends to stimulate demand for housing.
When credit tightens, through higher rates or stricter lending standards, the effect works the other way, and that's essentially what we're seeing play out across Sydney and Melbourne right now.
However, banks are money shops, and they need to keep lending to make money for their shareholders. I can see increased competition for banks moving forward, as they look to lend money to eligible borrowers.
7. Investor sentiment
Investors account for around a third of all property transactions, so their collective mood can meaningfully influence both demand and prices.
Negative investor sentiment, of the kind we're seeing in parts of the market today, tends to reduce buying activity and can push more existing owners toward selling, which adds to supply at exactly the wrong time for prices.
8. Government incentives
Government incentives cut both ways, and the May 2026 Budget is the clearest example of that in years.
On the demand side, first home buyer schemes, including 5% deposit guarantees and the Help to Buy scheme, continue to bring additional buyers into the affordable end of the market and support prices there.
On the investment side, the changes to negative gearing and the capital gains tax discount from 1 July 2027 have genuinely shifted the calculation for anyone buying an established property from here.
Existing owners and new build buyers are both protected, but the decision for a new established property purchase now involves more than just yield and growth projections, and getting proper tax advice before acting matters more than it used to.
Economic and property trends to watch out for moving forward
1. This is a correction phase, not a pause in an upturn
The data over the past quarter has made it clear we are in the correction phase of the property cycle. Auction clearance rates below 50%, quarterly falls in Sydney and Melbourne, and rising stock levels all point to a genuine correction rather than a brief wobble in an otherwise rising market.
Most economists are broadly aligned on the shape of the recovery, expecting conditions to stay soft through the remainder of 2026 and into 2027, with a gradual turn beginning around the middle of next year as rate cuts start to flow through.
2. The Budget has reshaped the investment landscape from 1 July 2027
The tax changes announced in the May 2026 Budget are real and meaningful, and I expect a gradual reweighting of investor activity toward new builds, which remain fully exempt from both the negative gearing changes and the new CGT rules.
That has real implications for new apartment pricing, developer feasibility, and where future housing supply actually gets built.
But as I have warned, most new-build properties will not make good long-term investments, yet investors keep making the same mistakes cycle after cycle.
In the shorter term, more established property investors choosing to hold rather than sell and trigger a CGT event under the new rules could help keep stock levels tight in the most desirable suburbs, which would work against further price falls in those locations specifically.
3. Interest rates are likely to stay on hold well into 2027
Most economists now expect the RBA to hold through the remainder of 2026, with the first cut arriving around the middle of 2027 if inflation continues to ease as expected.
That's a longer wait than many buyers were hoping for, and it means affordability will remain the dominant constraint on the market for some time yet.
4. Our property market is more fragmented than it's ever been
There was never really one Sydney market or one Melbourne market, meaning houses, apartments, townhouses and villa units across outer, middle and inner ring suburbs are all behaving differently, and cost of living pressure combined with weak wage growth is hitting some demographics far harder than others.
That's why I continue to favour locations where local incomes are growing faster than the national average, typically the inner and middle-ring gentrifying suburbs where wealthier buyers are moving in and can afford to pay a premium to be there.
5. Migration remains strong, even after the recent downgrade
Net overseas migration will remain solid, even though the federal government has lowered its forecast in the recent Budget.
Migrants don't bring houses with them and tend to rent before they buy, with only around 38% owning a home after five years in Australia, rising to 71% after a decade, which keeps rental demand elevated for years after each wave of arrivals.
6. Rents will keep climbing
There's no end in sight to the rental crisis. Rental demand remains strong against very low vacancy rates, and I expect rents to keep rising through the next few years regardless of what happens to purchase prices in the meantime.
7. Strategic investors will re-enter as conditions stabilise
Investors with a genuine long-term focus tend to return to the market once prices soften and rental yields improve, and I expect that pattern to repeat here.
They'll be competing with first home buyers who continue to benefit from several government-backed incentive schemes, which should keep the more affordable end of the market well supported even through a broader correction.
8. Neighbourhood matters more than ever
People continue to pay a premium for the ability to work, live and play within a 20 minute walk, ride or drive from home.
Many inner suburbs and parts of the middle ring already meet that test, while very few outer suburbs do, given lower density, less community diversity and weaker access to public transport.
Around 80% of a property's long-term performance comes down to its location and neighbourhood, and some locations have outperformed others by 50% to 100% over the past decade. I expect that gap to widen rather than narrow through this correction, as buyers become even more selective about where they're prepared to pay up.
9. Employment should stay a source of underlying strength
Our economy will likely keep growing, albeit more slowly, and while unemployment has ticked up to 4.5%, it remains low by historical standards. That underlying employment strength is one of the main reasons I don't expect this correction to turn into anything more severe.
Long-term forecasts for Australian property markets (2026-2030)
Getting to the long-term outcome I still believe in means working through a softer 2026 and 2027 first, and I think it's more important to say that plainly, rather than to pretend the near term doesn't matter.
Over the next decade, housing demand is expected to benefit from the same triple boost of rising population, rising jobs, and rising income that has underpinned our markets for years, adding an estimated $860 billion in additional income to the system, a meaningful share of which will flow into housing costs.
No forecast, mine included, can tell you exactly where prices will sit in three months, let alone six or seven years from now.
What history does show is that some properties outperform others by 50% to 100% in capital growth terms, which is exactly why strategic investors who buy investment-grade property can still expect values to more than double within seven to ten years, even through a cycle like this one.
Australia's population is forecast to grow from around 27.8 million today to over 30 million by 2030, meaning over two million more people will need somewhere to live. That alone tells you where the pressure on housing supply is heading over the rest of this decade, regardless of how the next twelve to eighteen months play out.
So while we always have to take forecasts for Australian property markets with a big pinch of salt, I am confident we’ll see our future property markets come off the back of our strong projected population increase.
- Also read:Melbourne property market forecast for 2026 & 2027 | Separating the fundamentals from the sentiment

- Also read:Brisbane Property Market Forecast [2026 & Beyond] – What The Olympics Decade Means for Investors.

- Also read:Sydney property market forecast for 2026 and 2027 | Why the short-term softness is a long-term opportunity

- Also read:Latest Property Price Forecasts. Australian Property Market Outlook 2026-2027: Navigating a Market Correction

- Also read:Everything you need to know about the state of Australia’s property markets in 20 charts – July 2026

Final Thoughts: So, Where to From Here?
The current market is not to read. Sydney and Melbourne are genuinely falling; borrowing capacity has been meaningfully cut by this year's rate rises; and the Budget has added a layer of complexity that didn't exist a year ago.
But I've been through enough cycles now to know what a correction driven by rates and policy looks like, and this is that, not a structural collapse in the forces that actually drive property values over time. Population growth is still strong, we're still not building enough homes, and household wealth continues to rise even while sentiment is weak.
History has been fairly consistent on this point - the investors who did well out of the last few downturns were the ones who kept buying quality property through the soft patch, while everyone else waited for a signal that never really arrives until prices have already started moving again.
That doesn't mean buying anything, anywhere, just because sentiment is low. It means being more selective than ever about location and quality, since a flat or falling market has a way of exposing the properties that were only ever carried by momentum in the first place.
If you're financially stable and thinking about your next purchase, the current conditions in Sydney and Melbourne in particular are worth a proper look, not because a boom is about to arrive, but because the properties that matter most for long-term wealth, well-located houses and family-friendly apartments in gentrifying suburbs, don't often trade at these kinds of discounts to where they'll likely sit in a few years' time.
Tip: Need some clarity? Why not start with a complimentary Wealth Discovery Consultation with one of our Property Strategists? Leave us your details here.
That’s where our Complimentary Wealth Discovery Session comes in. We’re offering you a 1-on-1 chat with a Metropole Wealth Strategist to help you:
- Clarify your financial goals
- Understand how macro trends affect your position
- Build a personalised, data-driven property strategy
- Get ahead of the curve — before everyone else piles in
There’s no cost, no obligation — just practical, tailored guidance based on decades of experience.
Click here now to book your free Wealth Discovery Session
NoBookmark this page and check back regularly — we update this forecast often to reflect the latest insights and trends.
The property market never stands still, and neither should you.


