

Key takeaways
Total national property listings rose 4.6% month-on-month in February to 226,758 dwellings, reflecting a seasonal lift in market activity.
Listings remain 9.1% lower year-on-year, highlighting ongoing supply constraints despite the rebound.
New listings surged 48.6% nationally, marking the strongest monthly rise since spring.
Old listings were broadly steady, rising just 0.7%, though remain 12.0% lower than a year ago.
Distressed listings increased 6.2% month-on-month but remain 29.2% below February 2025 levels.
National asking prices continued to trend higher, with combined dwelling prices up 1.9% over the month and 13.6% year-on-year.
SQM Research’s Weekly Asking Prices Index for the week ending 23 February 2026 showed continued upward momentum in dwelling prices nationally, signalling ongoing vendor confidence in the rising market
Nationally, house asking prices rose 1.9% over the month, while unit prices increased 1.7%, with combined dwelling prices up 1.9% month-on-month and 13.6% year-on-year.
Sydney recorded marginal monthly softness in combined prices (-0.1%), though remains 9.8% higher year-on-year.
Melbourne saw mixed results across property types, with combined prices (-0.4%) down slightly, over the month but 7.3% higher annually.
Brisbane continued to outperform, with combined dwelling prices up 21.9% year-on-year, reflecting strong ongoing demand.
Perth recorded a solid monthly gain of 2.6% in combined prices and is 15.5% higher annually.
Adelaide posted continued strength (+0.2% monthly; +16.6% YoY), while Canberra and Hobart showed mixed short-term movements across property types, though annual growth remains positive.
Darwin continued to exhibit elevated volatility, with divergent results across houses and units.

Australian real estate listing activity gained renewed momentum in February, with total national residential listings increasing 4.6% to 226,758 dwellings as vendor activity accelerated following January’s subdued conditions..
Sydney led the lift, with listings rising 15.6% to 33,437, now slightly above last year’s levels (+0.6% YoY).
Melbourne also recorded a strong increase (+14.1% MoM) to 41,036 and is now 2.7% higher year-on-year.
Brisbane saw a more modest gain (+3.7%), though total listings remain 21.0% below last year.
Perth declined 6.1% month-on-month and remains 25.7% lower year-on-year, underscoring tight stock conditions, while Adelaide (+5.1%) and Canberra (+11.6%) also recorded solid rebounds.
Darwin was broadly steady (-0.3%), while Hobart recorded a modest lift (+2.9%), though both markets remain materially lower than last year.
Total Listings of Properties for Sale
| City | Feb 2026 Total | Jan 2026 Total | Feb 2026 Total | Monthly change | Yearly Change % |
|---|---|---|---|---|---|
| Sydney | 33,437 | 28,922 | 33,241 | 15.6% | 0.6% |
| Melbourne | 41,036 | 35,980 | 39,956 | 14.1% | 2.7% |
| Brisbane | 13,016 | 12,546 | 16,479 | 3.7% | -21.0% |
| Perth | 11,236 | 11,971 | 15,129 | -6.1% | -25.7% |
| Adelaide | 7,814 | 7,433 | 8,232 | 5.1% | -5.1% |
| Canberra | 4,701 | 4,212 | 4,661 | 11.6% | 0.9% |
| Darwin | 716 | 718 | 1,109 | -0.3% | -35.4% |
| Hobart | 2,795 | 2,715 | 3,149 | 2.9% | -11.2% |
| National | 226,758 | 216,826 | 249,325 | 4.6% | -9.1% |
Source: SQM Research
New Listings
New listings surged sharply in February, rising 48.6% nationally to 76,077 dwellings, signalling a strong return of vendor activity following the seasonal hiatus over December and January.
Sydney recorded a 57.9% increase, while Melbourne rose an even stronger 73.9%, suggesting a clear seasonal ramp-up in supply.
Brisbane (+38.5%), Perth (+36.3%), Adelaide (+37.9%) and Canberra (+59.7%) also recorded significant gains. With Darwin (+16.5%) and Hobart (+32.2%) likewise posting solid monthly increases as activity broadened across the smaller capital markets.
Despite the monthly rebound, national new listings are broadly flat year-on-year (-0.1%), indicating that overall supply remains constrained compared to 2025 levels.
New Listings of properties for sale (less than 30 days)
| City | Feb 2026 Total | Jan 2026 Total | Feb 2025 Total | Monthly change | Yearly Change % |
|---|---|---|---|---|---|
| Sydney | 17,180 | 10,880 | 16,058 | 57.9% | 7.0% |
| Melbourne | 20,258 | 11,652 | 17,134 | 73.9% | 18.2% |
| Brisbane | 6,920 | 4,995 | 7,923 | 38.5% | -12.7% |
| Perth | 5,815 | 4,267 | 6,574 | 36.3% | -11.5% |
| Adelaide | 4,191 | 3,039 | 4,091 | 37.9% | 2.4% |
| Canberra | 2,210 | 1,384 | 1,943 | 59.7% | 13.7% |
| Darwin | 233 | 200 | 258 | 16.5% | -9.7% |
| Hobart | 743 | 562 | 783 | 32.2% | -5.1% |
| National | 76,077 | 51,199 | 76,159 | 48.6% | -0.1% |
Source: SQM Research
Old Listings
Older stock remained broadly stable in February, increasing just 0.7% nationally to 63,624 dwellings, while remaining 12.0% lower year-on-year.
Sydney was steady (-0.1%), while Melbourne edged higher (+0.6%).
Brisbane (-8.0%), Perth (-8.8%) and Adelaide (-9.2%) all recorded meaningful declines in older listings, suggesting continued absorption of longer-dated stock.
Canberra recorded a 6.2% monthly rise, indicating some short-term accumulation.
Darwin (-8.7%) and Hobart (-3.4%) continued to see reductions in older listings, with Darwin sitting 67.3% below last year’s levels.
| City | Feb-2026 | Jan 2026 | Feb 2025 | Monthly change | Yearly Change % |
|---|---|---|---|---|---|
| Sydney | 5,690 | 5,698 | 6,161 | -0.1% | -7.6% |
| Melbourne | 7,868 | 7,821 | 8,851 | 0.6% | -11.1% |
| Brisbane | 1,469 | 1,597 | 1,735 | -8.0% | -15.3% |
| Perth | 1,199 | 1,315 | 1,471 | -8.8% | -18.5% |
| Adelaide | 770 | 848 | 860 | -9.2% | -10.5% |
| Canberra | 666 | 627 | 765 | 6.2% | -12.9% |
| Darwin | 168 | 184 | 514 | -8.7% | -67.3% |
| Hobart | 963 | 997 | 1,196 | -3.4% | -19.5% |
| National | 63,624 | 63,195 | 72,276 | 0.7% | -12.0% |
Source: SQM Research
Distressed Listings
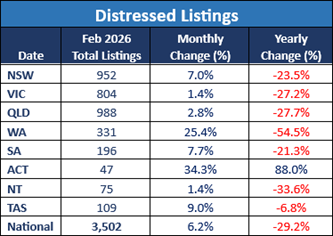
Distressed listings rose 6.2% month-on-month in February to 3,502 properties, though remain significantly lower than a year ago (-29.2% YoY).
Western Australia recorded the sharpest monthly increase (+25.4%), followed by the ACT (+34.3%), where distressed listings are now 88.0% higher year-on-year.
Queensland (+2.8%) and New South Wales (+7.0%) also saw increases, while Victoria rose modestly (+1.4%).
Despite the monthly rise, distressed listings nationally remain well below 2025 levels, indicating continued household resilience.
Distressed Property Listings
Source: SQM Research
Asking Prices
Sydney Weekly Asking Prices Index
| Property type | Price ($) | Weekly Change | Monthly Change % | Annual % change |
|---|---|---|---|---|
| All Houses | 2,193.782 | -4.387 | -0.1% | 10.7% |
| All Units | 902.242 | -3.442 | 0.0% | 7.9% |
| Combined | 1,66.258 | -4.001 | -0.1% | 9.8% |
Source: SQM Research
Melbourne Weekly Asking Prices Index
| Property type | Price ($) | Weekly Change | Monthly Change % | Annual % change |
|---|---|---|---|---|
| All Houses | 1,336.302 | 6.939 | -1.0% | 6.6% |
| All Units | 683.481 | 2.719 | 1.9% | 11.1% |
| Combined | 1,129.552 | 5.603 | -0.4% | 7.3% |
Source: SQM Research
Perth Weekly Asking Prices Index
| Property type | Price ($) | Weekly Change | Monthly Change % | Annual % change |
|---|---|---|---|---|
| All Houses | 1,248.483 | 27.416 | 2.8% | 13.2% |
| All Units | 779.763 | -0.036 | 1.8% | 27.0% |
| Combined | 1,125.394 | 20.207 | 2.6% | 15.5% |
Source: SQM Research
Brisbane Weekly Asking Prices Index
| Property type | Price ($) | Weekly Change | Monthly Change % | Annual % change |
|---|---|---|---|---|
| All Houses | 1,447.161 | 12.509 | 0.2% | 21.3% |
| All Units | 879.508 | -7.008 | -1.2% | 26.0% |
| Combined | 1,303.853 | 7.582 | -0.1% | 21.9% |
Source: SQM Research.
Adelaide Weekly Asking Prices Index
| Property type | Price ($) | Weekly Change | Monthly Change % | Annual % change |
|---|---|---|---|---|
| All Houses | 1,174.808 | 10.492 | 0.4% | 16.7% |
| All Units | 616.568 | -3.768 | -1.3% | 16.3% |
| Combined | 1,074.250 | 7.923 | 0.2% | 16.6% |
Source: SQM Research
Canberra Weekly Asking Prices Index
| Property type | Price ($) | Weekly Change | Monthly Change % | Annual % change |
|---|---|---|---|---|
| All Houses | 1,255.109 | 2.516 | -0.5% | 5.0% |
| All Units | 613.637 | -0.513 | -0.4% | 2.2% |
| Combined | 1,012.630 | 1.371 | -0.5% | 3.8% |
Source: SQM Research
Darwin Weekly Asking Prices Index
| Property type | Price ($) | Weekly Change | Monthly Change % | Annual % change |
|---|---|---|---|---|
| All Houses | 817.145 | 5.855 | 2.8% | 13.1% |
| All Units | 477.858 | -2.858 | 1.1% | 18.1% |
| Combined | 683.705 | 2.428 | 2.3% | 14.4% |
Source: SQM Research
Hobart Weekly Asking Prices Index
| Property type | Price ($) | Weekly Change | Monthly Change % | Annual % change |
|---|---|---|---|---|
| All Houses | 891.799 | -1.118 | -0.4% | 9.8% |
| All Units | 520.054 | 3.246 | 0.2% | 4.1% |
| Combined | 834.941 | -0.450 | -0.3% | 9.2% |
Source: SQM Research
National Weekly Asking Prices Index
| Property type | Price ($) | Weekly Change | Monthly Change % | Annual % change |
|---|---|---|---|---|
| All Houses | 1,096.299 | 6.966 | 1.9% | 13.7% |
| All Units | 650.151 | 2.419 | 1.7% | 13.5% |
| Combined | 999.343 | 5.978 | 1.9% | 13.6% |
Source: SQM Research
Capital City Average Weekly Asking Prices Index
| Property type | Price ($) | Weekly Change | Monthly Change % | Annual % change |
|---|---|---|---|---|
| All Houses | 1,596.398 | 16.469 | 0.4% | 11.5% |
| All Units | 800.008 | -5.956 | 0.1% | 11.5% |
| Combined | 1,358.005 | 9.756 | 0.4% | 11.3% |
Source: SQM Research
Final note...
February’s figures confirm that the listing market is regaining momentum following the seasonal lull.
The surge in new listings for February is fairly typical activity for this time of year.
However, overall stock levels remain materially lower than a year ago, which continues to provide support to prices.
While distressed listings have ticked higher month-on-month, they remain well below 2025 levels.
At this time, there are no indications of vendor stress across the housing market, but we will be watching closely given the recent interest rate rise and the current geopolitical turmoil that could create adverse economic waves in 2026.
If new listings continue to rise through March and April, we may see some easing in price growth.
However, should supply remain tight relative to demand, upward pressure on prices, particularly in Brisbane, Perth and Adelaide, is likely to persist
- Also read:March Home Prices Still Rising | Latest stats from Dr. Andrew Wilson

- Also read:Latest Property Price Forecasts Revealed. Australian Property Market Outlook 2026: Where To Now After The Rate Rise.

- Also read:National Weekly Auction Report – March 28th 2026 | Auction Clearance Rates Still Fading Over Super Week of Listings

- Also read:RBA raises interest rates again. Here’s what this means for property. | Property Insiders

- Also read:This week’s Australian Property Market Update – Latest Data, State by State March 24th 2026


