


Key takeaways
Investors face an extreme rarity when searching for positive cash flow properties, as data reveals that a mere 0.8% of suburbs nationwide deliver positive returns under current market conditions
Softening housing values and a record-low national vacancy rate of 1.5% are beginning to drive gross rental yields higher, particularly in correcting capital city markets like Melbourne
Regional mining towns across Western Australia and Queensland dominate the few positive cash flow markets, but high yields are accompanied by higher risk amid a history of sharp price swings.
For investors, Australian housing is a low-yielding asset class.
The gross yield measures annual rental income (before expenses) as a proportion of a property’s value.
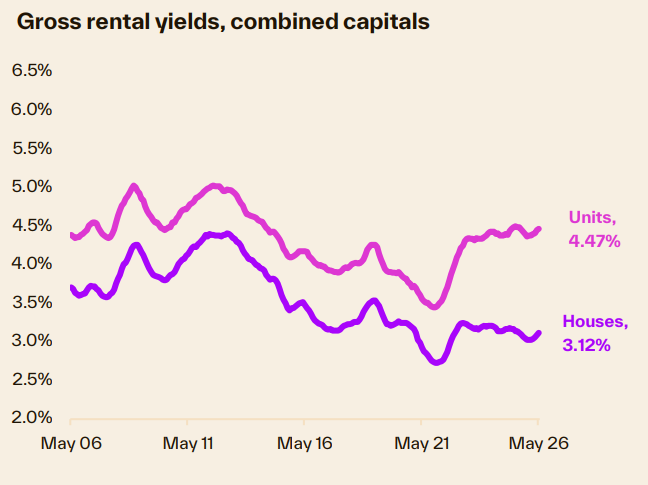
Across the combined capitals, the gross rental yield was tracking at 3.45% in May, a little higher for units at 4.47% and lower for houses at 3.12%.
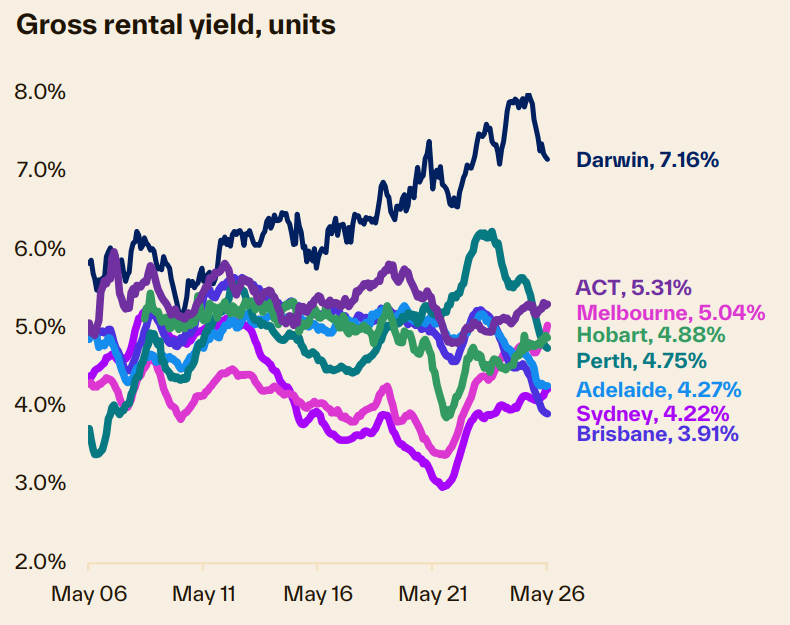
Gross yields tend to be higher in more volatile or riskier markets.
For example, gross yields in Darwin are significantly higher than in the other capitals, but this market has also shown significant volatility in housing cycles.
Or, in more extreme examples, mining regions like WA’s Pilbara or Queensland’s Bowen Basin tend to show extremely high gross yields, but severe boom/bust cycles in home values.
The higher yield helps to compensate for risk.
Historically, Australian housing investors haven’t placed the same priority on rental income as they have on opportunities for capital gain.
Opportunities for capital growth have been the main goal for investors.
We can see evidence of this in the most recent growth cycle, where investor activity reached near-record highs, accounting for 41% of mortgage demand, while yields were low and falling.
With the hand down of the federal budget, rental yields have suddenly become more important.
With less ability to offset rental losses against taxable income, it’s likely property investors will be paying a lot more attention to the yield.
Additionally, financiers are already factoring in reduced borrowing capacity for investors and higher holding costs in the absence of negative gearing on established homes.
Where to from here for yields?
As the housing cycle softens, we are expecting the trend in home values to moderate further, with the potential for a broad-based downturn.
At the same time, rental vacancy rates are at record lows, recorded at just 1.5% nationally in May.
Rental growth has re-accelerated to 5.9% per annum nationally.
With these opposing trends of softening values and rising rents, the outlook is that gross rental yields are set to rise.
With housing values now trending lower in some markets, an upswing in gross yields is becoming evident in these regions.
- Also read:Latest Property Price Forecasts. Australian Property Market Outlook 2026: Where To Now After The Rate Rise & Budget Changes.

- Also read:Australia’s Rental Crisis Is Getting Worse – And the “Solutions” May Be Making It Worse | Property Insiders

- Also read:National Weekly Auction Report – June 6th 2026 | Auction Markets Mainly Steady Over Holiday Week

- Also read:Supply Surges, Asking Prices Stall as Housing Market Reaches Turning Point | Latest SQM Listing Data
- Also read:Home Prices Now Falling Following Rate Rises | Latest stats from Dr. Andrew Wilson

Melbourne is the best example, where gross yields two years ago were the second lowest of any capital, now they are trending higher to be ‘middle of the pack’ for houses and third highest amongst the capitals for unit yields.
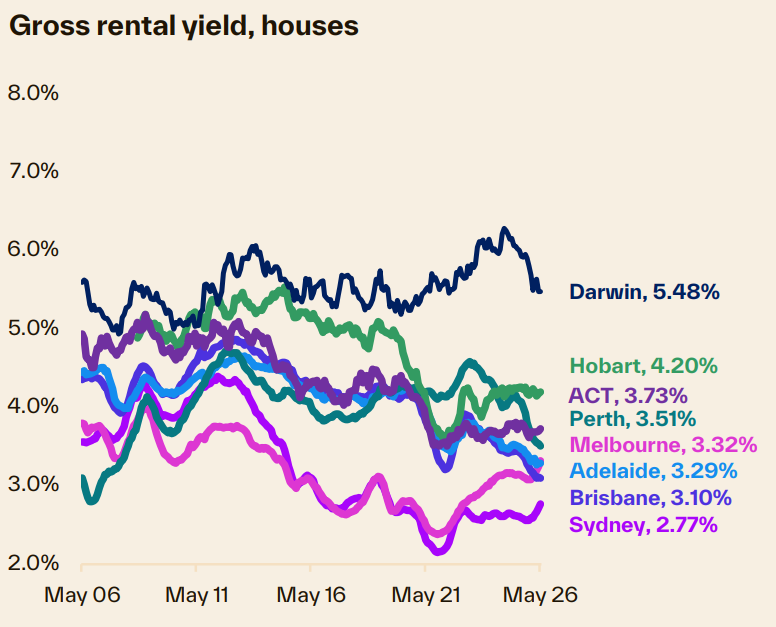
But yields aren’t rising everywhere… in May gross rental yields were at record lows for both houses and units in Brisbane and Adelaide, while they were at record lows for Perth houses.
These are markets where housing values are continuing to rise at a faster pace than rents, putting consistent downward pressure on the gross yield.
Yields aren’t expected to rise sharply.
Under a scenario where capital city home values fell by ten percent and rents rose by ten per cent, the gross rental yield would only rise by approximately 82 basis points, from 3.45% to 4.27%, which is still a long way off a positive cash flow scenario after allowing for costs.
What about the net yield?
We focus on gross yields (i.e. the yield excluding holding costs) because it provides an ‘apples with apples’ benchmark.
To calculate a net yield would involve a range of assumptions around the level of leverage, interest rates and holding costs such as insurances, strata fees, rates etc.
On this basis, assuming a 20% deposit, a 30-year principal & interest mortgage term with an interest rate of 6.34% (current market average for new investor loans) and holding costs at 2.5% of the median value, we can estimate some ballpark statistics around the potential for cash flow.
Under these assumptions, mortgage costs comprised the large majority of expenses, equating to around 71% of overall costs.
Investors with higher levels of equity in the home, or a larger initial deposit, would be less sensitive to interest rate changes and in a better position to secure a higher net rental yield.
The reality is that finding a positive cash flow investment property is the proverbial needle in a haystack
On the assumptions outlined above, only 0.8% of suburbs nationally would provide a positive cash flow.
Of these 38 suburbs:
- Only two were in capital cities (Melbourne’s Carlton for units, and Darwin’s Berrimah for houses) where the track record of capital gains has been weak.
- 69% were in regional WA, with a skew towards mining towns of the
- 10% were in regional Qld, all located around the Bowen Basin coal mining
In most cases, these markets have shown either higher levels of volatility over time, or the capital gains have been low to negative.
Most investors and lenders would treat these suburbs with a high degree of risk aversion.


