


Key takeaways
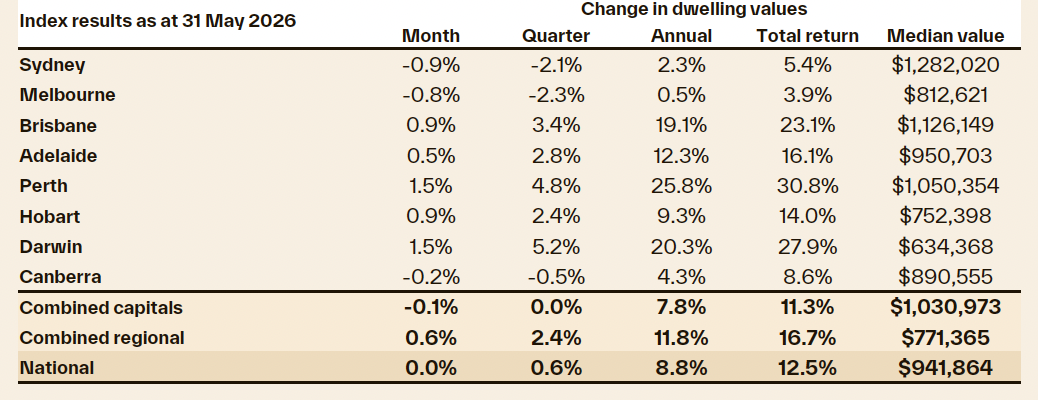
Cotality’s national Home Value Index was flat in May (0.0%), with the housing cycle continuing to weaken across most markets.
Beneath the flat national result, Sydney (-0.9%) and Melbourne (-0.8%) are leading the downturn.
Perth and Darwin led monthly gains at 1.5%, highlighting multi-speed conditions across the capitals.
National rent growth pushed to 5.9% annually, as the national vacancy rate dipped to 1.5%.
Headwinds are building across the Australian market, with high interest rates, stretched affordability, and tax policy changes tilting toward weaker demand.
Cotality’s national Home Value Index was flat in May, with the housing cycle continuing to weaken across most markets.
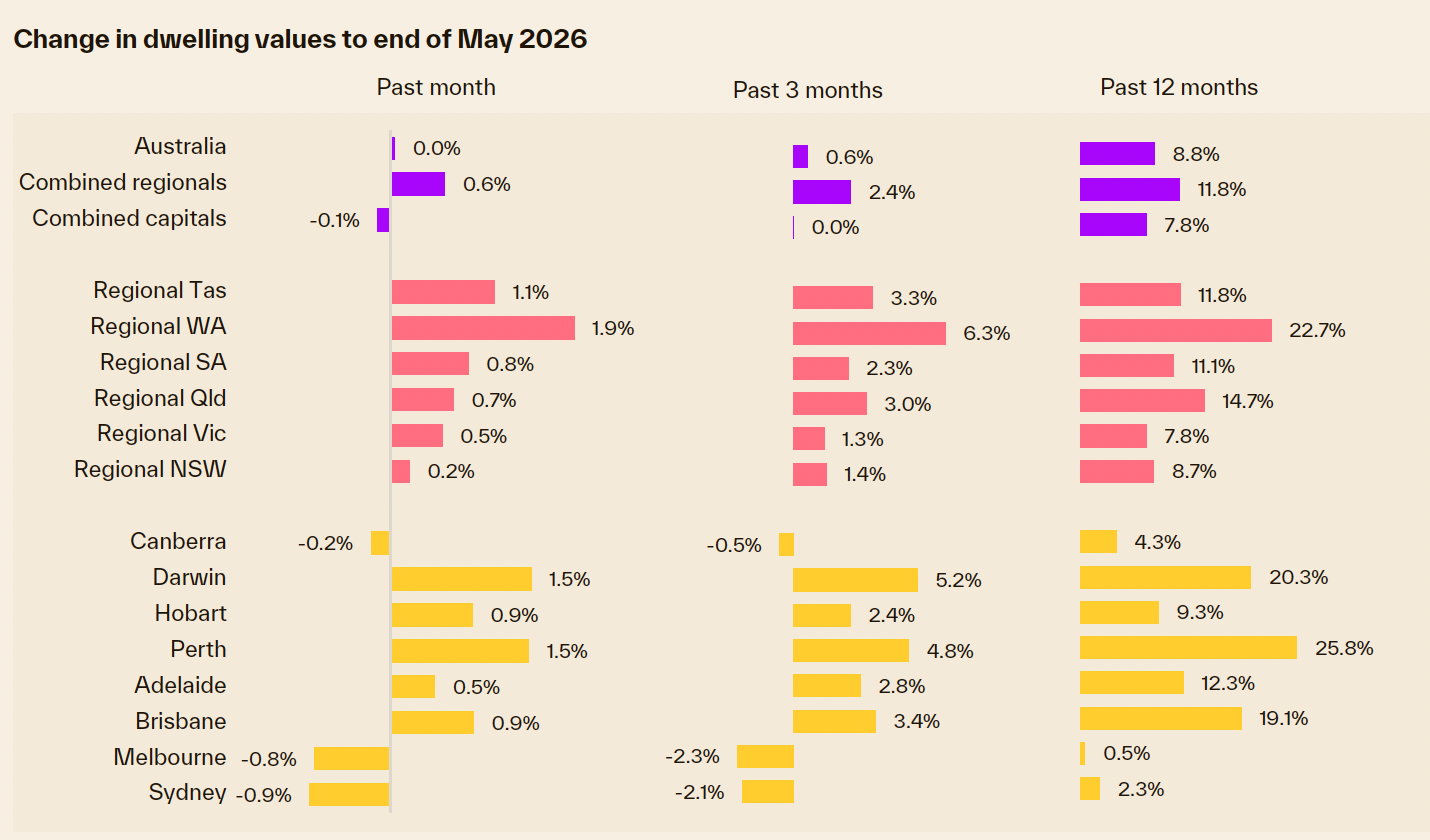
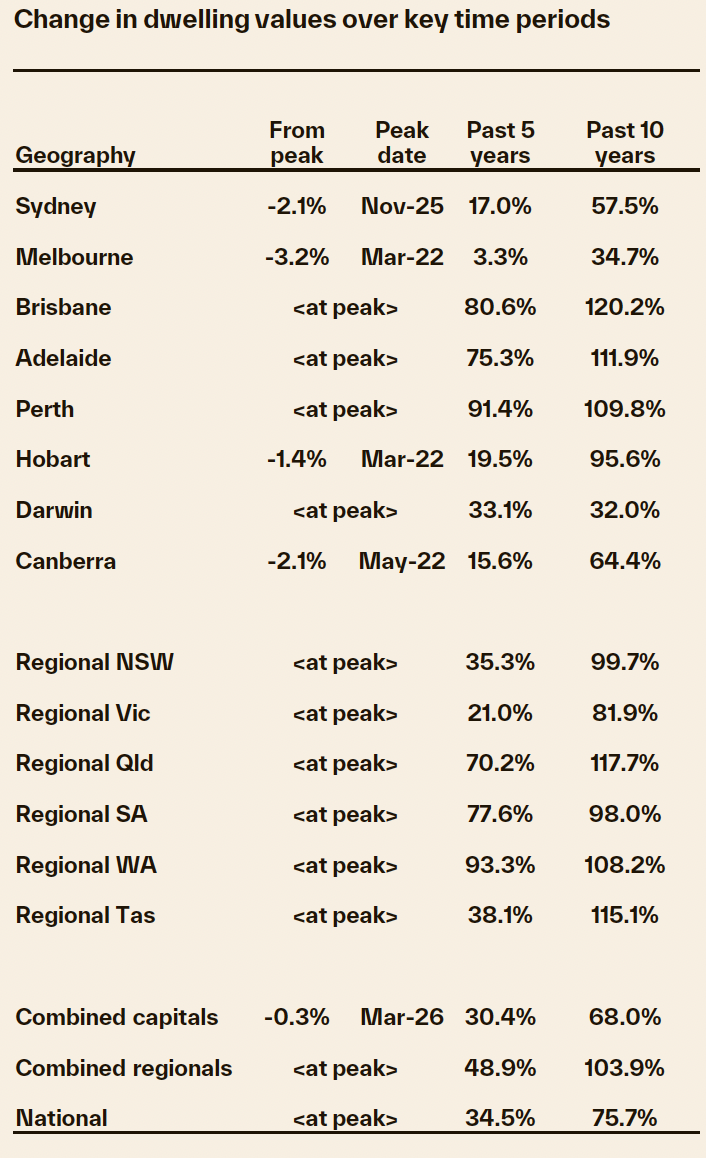
Beneath the flat national result, Sydney and Melbourne are leading the downturn, with dwelling values falling by 0.9% and 0.8% respectively in May, to be 2.1% and 2.9% below their cyclical highs in November last year.
Home values were also lower across the ACT, down 0.2% in May.
Across the remaining capitals, values continued to rise, although growth is clearly losing momentum. Perth and Darwin led the monthly gains at 1.5%, followed by Brisbane and Hobart at 0.9%, while Adelaide recorded a 0.5% rise.
The markets are fragmented
This level of diversity has been a defining feature of housing conditions over the past five years.
We are continuing to see multispeed conditions across Australia’s housing sector, with Perth and Melbourne at opposite ends of the spectrum.
The past five years have seen these cities diverge sharply, with Perth values up a stunning 91.4% while Melbourne home values are only 3.3% higher since May 2021.
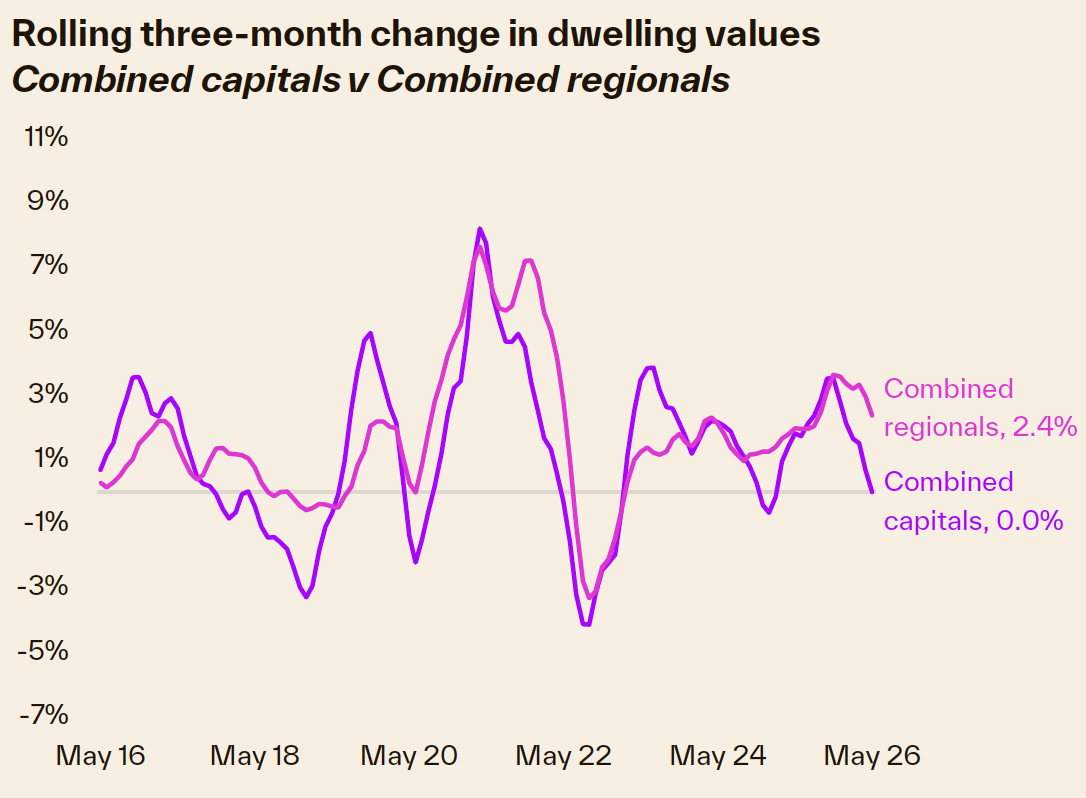
While the speed of value change remains very different from city to city, the direction is becoming more consistent, with most markets losing momentum as demand-side headwinds intensify.
This loss of momentum had been building for some time, well before interest rates started to rise, conflict escalated in Iran and taxation changes were announced in the Federal Budget.
Most cities recorded a peak in value growth through spring last year as affordability and serviceability constraints increasingly weighed on housing demand.
Lower price tiers more resilient
Lower price tiers continue to show stronger or more resilient conditions than the higher price tiers across most of the capitals, although the pace of growth is generally easing across the more affordable markets as well.
Some cities are now recording falls across the lower quartile, including Sydney and Melbourne’s lower quartile houses, as well as both house and unit values across Canberra’s lower quartile.
Alongside easing values, the slowdown in housing demand is also evident in lower home sales.
Nationally, the estimated number of home sales over the past three months was tracking 2.2% lower than a year ago and 4.1% below the five-year average.
The largest drop in estimated sales can be seen in Sydney and Melbourne, down 17.0% and 14.2% on levels a year ago.
These are also the cities where advertised supply has risen to above average levels, providing more choice and better leverage for buyers.
Selling conditions have also softened as demand and supply levels rebalance.
The weighted average clearance rate across the capitals was close to 50% through the second half of the month, while listings are trending higher across most markets.
Regional markets outperform
Regional markets have shown greater resilience, with housing values rising 0.6% across the combined regionals in May, although conditions are slowing here as well.
The monthly rise was the smallest in a year and, similar to the capitals, growth is continuing to ease.
All the broad rest-of-state markets continue to record a positive trend in home values. Regional WA led the monthly gains at 1.9%, while the smallest monthly rise was in regional NSW at 0.2%.
Rents keep rising
Rents rose 0.6% in May, matching the increase recorded in April, but easing from the 0.7% monthly gains seen through the first three months of 2026.
The monthly rise pushed annual national rent growth to 5.9%, the largest annual increase since the 12 months ending September 2024. Most capitals have seen annual rental growth regain some momentum in recent months.
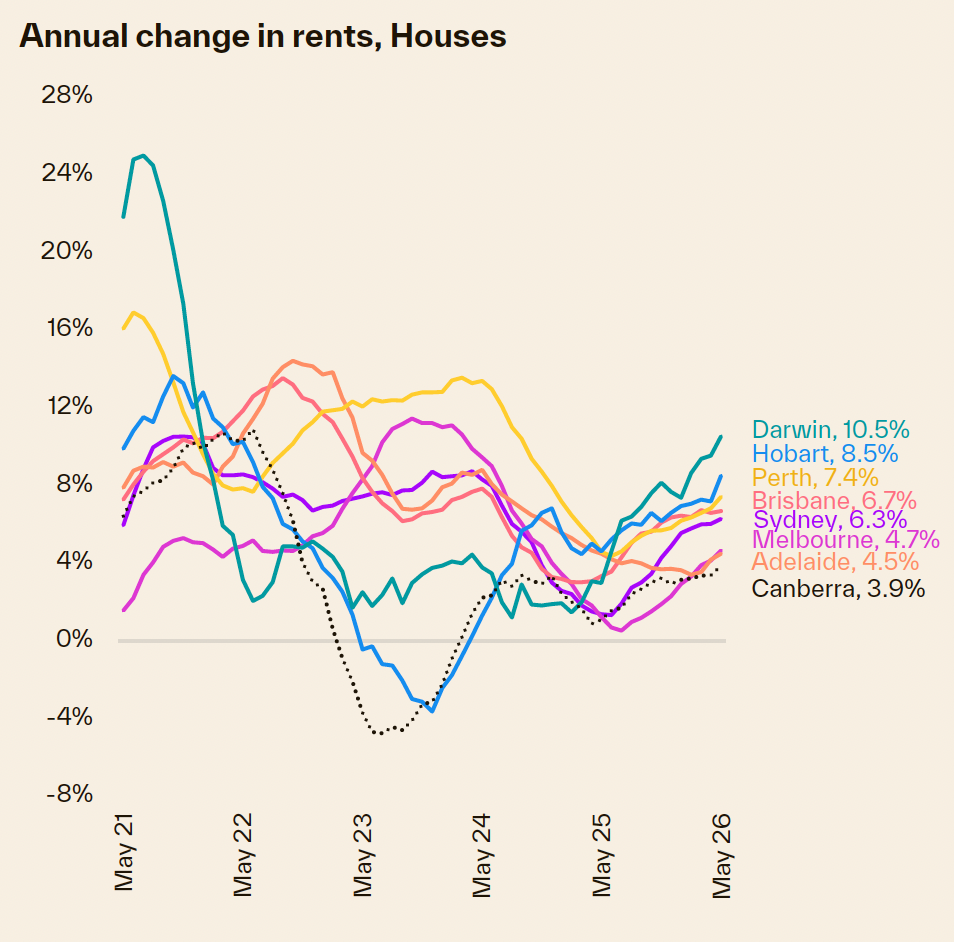
Upward pressure on rents is likely to persist due to very low vacancy rates.
The national vacancy rate dipped to 1.5% in May, in line with the record lows seen in 2022 and 2023, when the catch-up phase of overseas migration pushed vacancy rates lower.
With renters dedicating around a third of their pre-tax income to rental payments, it’s uncertain how much longer this upswing in rents can last.
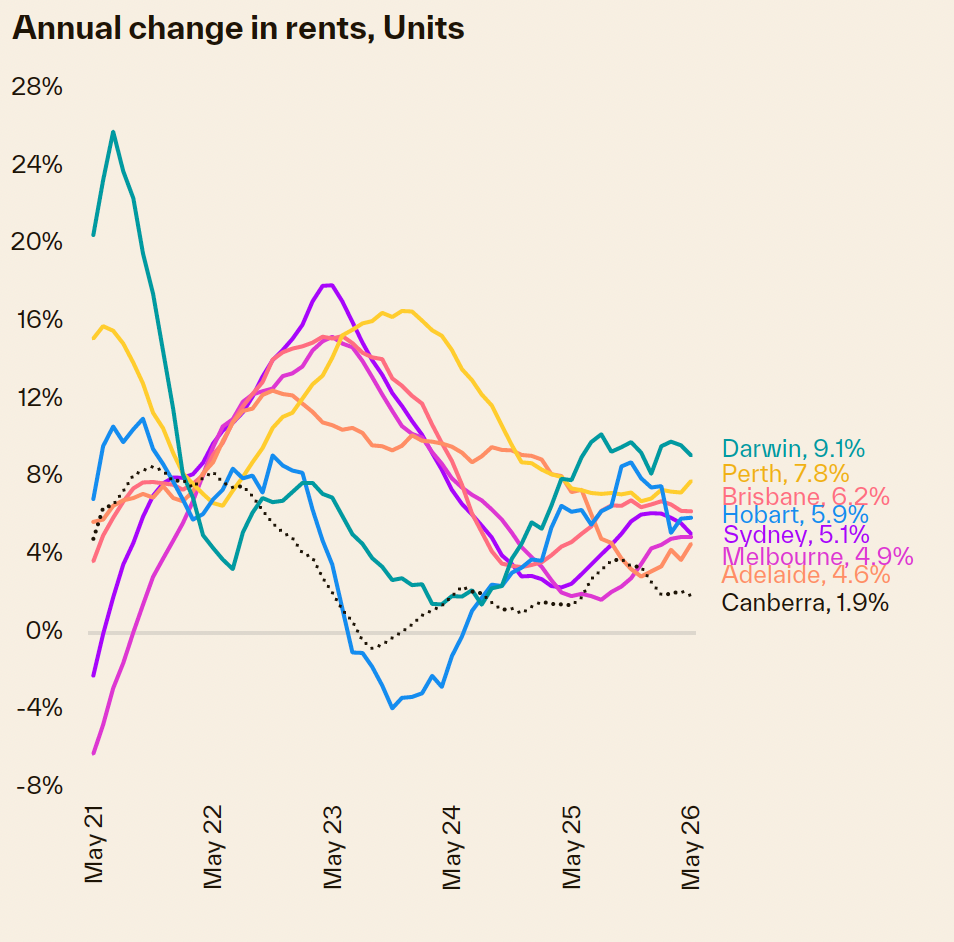
With the cost of renting up about $204 a week over the past five years, renters are likely to be at or approaching a ceiling on how much they can pay, potentially driving structural changes in rental demand.
While the data is hard to come by, it’s likely rental households are becoming larger as group households and multigenerational households become more common.
With rents continuing to rise while home value growth eases or turns negative, gross rental yields are coming under some upward pressure, albeit from a low base.
At 3.45%, the combined capitals gross rental yield is at its highest level since June last year.
Headwinds are building across the Australian housing market.
The balance of risks is increasingly tilting towards weaker demand.
The most likely result is lower turnover and the potential for a broader downturn in housing values.
Affordability remains a constant constraint, with dwelling values relative to income still elevated across most capitals.
At the same time, higher interest rates have reduced borrowing capacity and lifted repayment burdens. With affordability and serviceability pressures near record highs, the buyer pool has narrowed, particularly at higher price points where borrowing limits are most binding.
Recent monetary policy and inflation developments have reinforced this caution.
The RBA increased the cash rate by 25 basis points in May to 4.35%, citing high inflation, tight labour market conditions and heightened uncertainty around oil prices.
Cost-of-living pressures and higher interest rates are also weighing on confidence.
Measures of consumer sentiment remain deeply pessimistic, and survey commentary continues to point to weak housing sentiment. Historically, periods of low confidence have been associated with lower housing turnover and more subdued price growth.
Inflation data continues to highlight the squeeze on household budgets.
Headline inflation eased to 4.2% in the year to April, down from 4.6% in March, but the RBA’s preferred measure, trimmed mean inflation, edged higher to 3.4%.
While the temporary halving of the fuel excise helped lower fuel prices in April, spillover into items with high freight and logistics exposure, along with ongoing strength in housing-related inflation, remains a key risk.
Policy settings are also shifting the outlook.
The Federal Budget included major changes to housing investment tax settings, centred on limiting negative gearing to new builds from 1 July 2027 and replacing the 50% CGT discount with an indexed cost base approach and a minimum tax rate on capital gains.
These changes, together with an accumulation of earlier investor disincentives, are likely to see a material pullback in investor demand, albeit from near-record highs.
These demand-side headwinds are becoming more visible in market indicators, with value growth easing, home sales trending lower and selling conditions starting to favour buyers in some markets.
- Also read:Melbourne housing market update [video] | September 2026

- Also read:This week’s Australian Property Market Update – Latest Data, State by State September 15th 2026

- Also read:Australian housing market update | September 2026

- Also read:Latest Property Price Forecasts. Australian Property Market Outlook 2026-2027: Navigating a Market Correction

- Also read:Everything you need to know about the state of Australia’s property markets in 20 charts – September 2026

Still some tailwinds
Despite the more challenging demand environment, several tailwinds remain in place, although they appear to be offering less support than in recent periods.
New housing supply remains constrained. Elevated construction costs and feasibility challenges continue to limit the prospect of a sustained uplift in housing delivery.
Even where approvals and commencements have risen, this upswing is yet to flow through to a material rise in completions.
Population growth remains supportive of underlying housing demand and continues to place pressure on rental markets, although the pace of growth is now back around the decade average.
At the same time, resilient labour market conditions remain an important stabiliser, supporting household income security and reducing the risk of widespread forced selling, even as real incomes remain under pressure.
Overall, the housing market looks to be moving into a more subdued phase.
Stretched affordability, higher interest rates, softer sentiment and renewed inflation risks are weighing more heavily on demand, while supply constraints and demographic pressures continue to provide some offset.
The most likely outcome is a further loss of momentum and a drift towards lower home values, rather than a sharp correction.
That said, conditions are likely to remain uneven across regions and price points through the remainder of 2026.
The key watch points from here are the path of inflation and interest rates, the trend in consumer confidence, and whether listings continue to rise.