


Key takeaways
Mortgage burden: Despite recent rate dips, the cost of servicing a new loan is stubbornly high, requiring 45% of median household income.
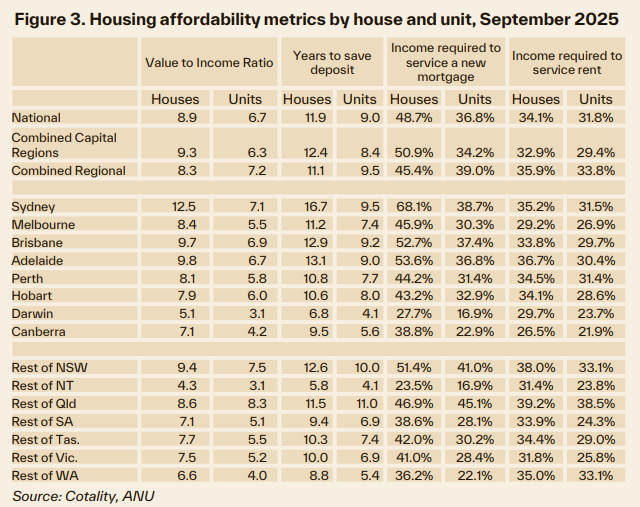
Deposit barrier: Saving a standard 20% deposit nationally takes nearly 12 years, and now over a decade in four major capital cities, Sydney, Adelaide, Brisbane, and Perth.
Rental squeeze: Tenants are now dedicating a record 33.4% of their income to rent, significantly exceeding the 20-year average.
Houses vs. units: Affordability has deteriorated most sharply for houses, where the median house value is now 8.9 times the average income (up from 6.6 five years ago).
Regional convergence: Regional affordability has nearly matched capitals on the value-to-income ratio (8.1 vs. 8.2), erasing what was once a more affordable alternative for buyers.
Market differences: Sydney remains the most expensive and unaffordable city, while conditions have severely deteriorated across Adelaide, Brisbane and Perth.
Pockets of relief: Canberra, Hobart, Melbourne show mild improvements in affordability, but most areas continue to face mounting entry barriers and rising rental costs.
NT most affordable: Darwin is the most affordable of the capital cities to buy in. Darwin and the rest of the Northern Territory are the only major regions where less than 30% of income is required to service a new mortgage.
Australia’s housing affordability has hit new lows over the past five years, with home values drifting even further out of reach and the share of income needed to pay a mortgage has nearly doubled, according to Cotality’s Housing Affordability Report.
Even as mortgage rates have dipped, the cost of servicing a new loan remains stubbornly high at 45% of household income, slightly down from record highs due to seventy five basis points of rate cuts since February and income growth.
The widening gap between housing costs and household incomes underscores just how out of sync home prices and incomes have become.
Affordability through the pandemic and beyond
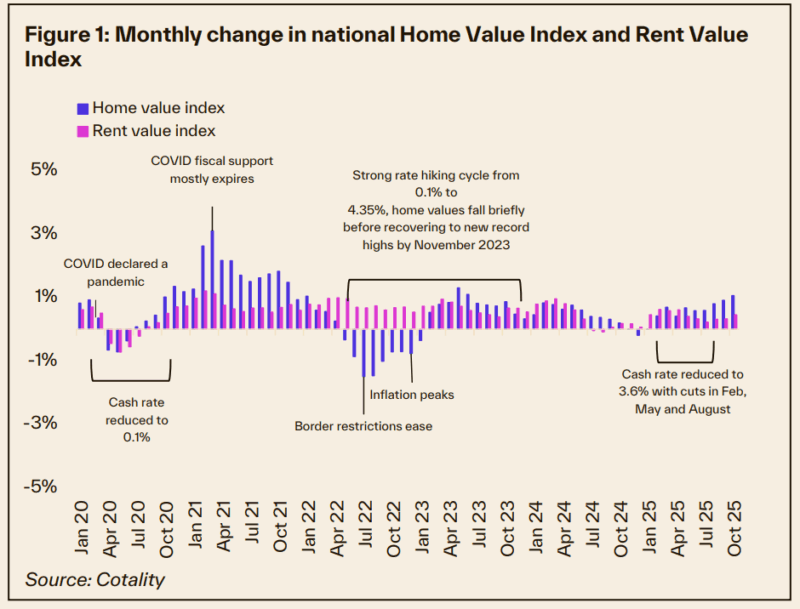
Australian home values have climbed by 47.3% since March 2020 through to October, the equivalent of $280,000 added to the median dwelling value (which is now $872,500).
This growth was driven by a confluence of factors.
It started with pandemic-era monetary stimulus.
Record-low interest rates, record peacetime fiscal payments and government incentives for new home purchases in 2020-21 supercharged borrowing capacity and housing demand.
Buyer preferences shifted toward larger homes and smaller household sizes, with a reduction in average household size adding to demand by an estimated 140,000 dwellings.
As net overseas migration plunged to just 9,000, domestic demand in 2021 prompted the highest calendar year of capital gain in Australia’s housing market since the 1980s (at 24.5%).
Rent values rose 9.6% in the same year, following a decade average annual growth rate of 2.1% in the 2010s.
As rates rose sharply in 2022, the structural imbalance between housing supply and demand staved off a large downswing and contributed to a swift recovery in values.
The strong catch up in net overseas migration potentially offset the impact of rising rates, with home values reaching a new record high by November 2023, the same month the cash rate reached a cyclical high of 4.35%.
Real wages growth and rate cuts through 2025 have reignited market momentum, pushing national dwelling values up 6.3% year-to-date.
Supply-side limitations compound these demand pressures.
Construction sector insolvencies, rising material costs, and planning bottlenecks restricted new housing delivery, with completions lagging well behind household formation.
ABS data suggests over one million new households formed in the past five years against 880,000 new dwellings completed.
This mismatch, coupled with tight rental markets and an investor resurgence, reinforced price resilience even during the period of rate hikes.
Macroeconomic stability and equity gains have also played a role in ongoing value growth.
Despite inflationary shocks and monetary tightening through 2022 and 2023, employment remained strong, and household savings buffers cushioned higher mortgage costs.
This meant that when housing values did see a sharp drop of 7.4% between May 2022 and January 2023, homeowners could largely keep servicing their loans, restrict selling activity accordingly, and effectively restrict supply until market conditions improved in the second half of 2025.
In short, the past five years combined extraordinary demand drivers with supply constraints, creating a boom in both home values and rents.
National overview
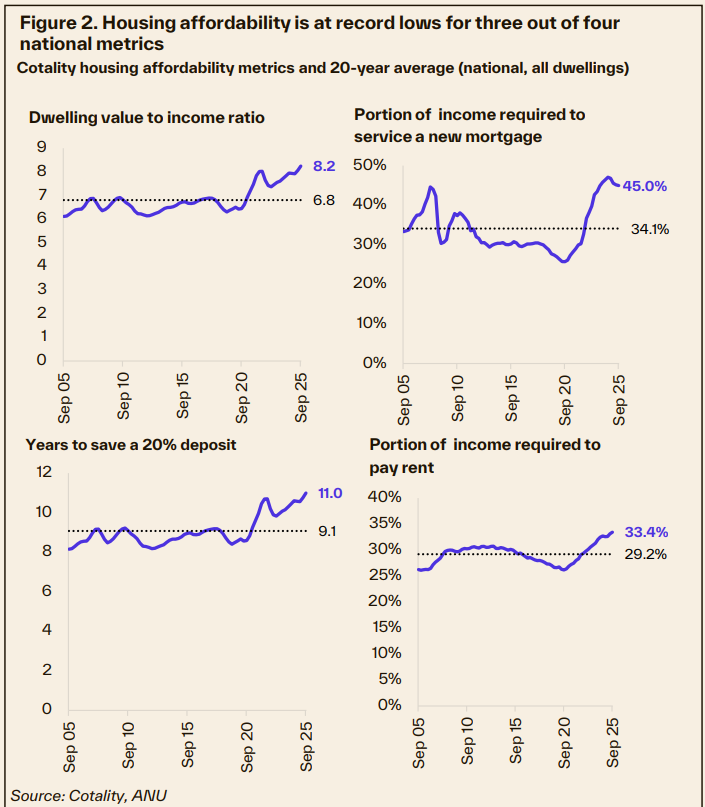
Cotality uses four different metrics to examine aspects of housing affordability over time, shown in figure 2.
Each metric assumes a median, pretax household income measure over time, which is supplied by the ANU Centre for Social Policy Research.
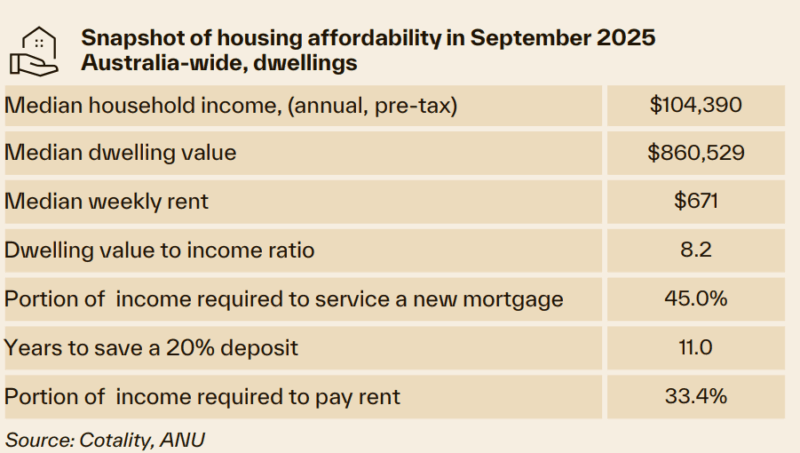
In September 2025 this resulted in a median, pre-tax, household income estimate of $104,390 per annum.
The income estimate increased 20.0% in the five years to September 2025 but was dwarfed by a 53.5% increase in
the median dwelling value, and a 53.3% rise in the median rent value in the same period.
The dwelling value to income ratio divides the median dwelling value by the median, pre-tax annual household income.
- Also read:Melbourne housing market update | July 2026

- Also read:Australian housing market update | July 2026

- Also read:Latest Property Price Forecasts. Australian Property Market Outlook 2026-2027: Navigating a Market Correction

- Also read:Everything you need to know about the state of Australia’s property markets in 20 charts – July 2026

- Also read:National Weekly Auction Report – July 18th 2026 | Early Signs of Improvement Continue in Mid-winter Home Auction Markets

In September 2025 household income went into the median dwelling value 8.2 times, a series high and up from 8 times a year ago.
The 20-year average dwelling value to income ratio is 6.8.
A 20% deposit would take a series record 11.0 years to save in September, up from 10.6 a year prior, and a 20-year average of 9.1 years.
This measure assumes a 15% per annum household savings rate.
The portion of income required to service a mortgage was 45.0%.
This was the only metric to have seen some improvement through 2025 amid falling mortgage rates and income
growth, down from a record high of 47.1% a year prior, though well above the 20-year average of 34.1%.
This metric has a few assumptions worth noting:
• Assumes a new mortgage being taken out, rather than an ongoing measure of mortgage costs to income.
• A loan-to-valuation ratio of 80% (or a 20% deposit).
• Assumes an average, new owneroccupier lending rate across all products (5.75% in September 2025).
• The full back series has been updated to assume a 30-year loan term.
The portion of income required to service rent is 33.4%, a series high.
This was up from 32.7% a year ago, and above a 20-year average of 29.2%.
This uses the median imputed rent value across all dwellings in Australia, not the median of rents paid or advertised.
Houses vs units
Housing affordability has worsened more for houses than units.
The median house value is now 8.9 times the average income, up from 6.6 times five years ago.
For units, the increase was smaller, rising from 6.0 to 6.7 times income.
It now takes almost 12 years to save a deposit for a house, which is 34.6% longer than five years ago.
For units, the time has grown to about 9 years, an increase of 12.8%.
The share of income needed to pay a mortgage has nearly doubled for houses, jumping from 26.5% to 50.8%.
For units, it rose from 23.9% to 36.8%. Rent costs have also increased for both houses and units, moving from about one-quarter of income to roughly one-third.
Houses have attracted much stronger growth in the past 5 years than units.
Nationally house values increased 53.8% for houses compared to 27.1% for units in the 5 years to September, against a 20% rise in median income.
Houses also generally outperform during market upswings and are more sensitive to changes in credit conditions.
Higher growth in house values reflects buyer preferences, as well as the appreciation in the underlying land value.
Looking ahead to 2026, it is hard to imagine the house price premium over units can continue with such challenging affordability conditions, especially in a city like Sydney where the dwelling value to income ratio for houses is almost double that of units.
The ‘performance gap’ in capital gains is narrowing at the national house and unit level, and house prices may be particularly sensitive to a stall in interest rates amid the recent reacceleration of inflation.
Interestingly however, there is not as much of a premium between house and unit rents, which may support additional demand for house rentals in the year ahead.
Larger rental properties also provide an added advantage of scaling rent costs for those in share housing.


