

Key takeaways
The Australian property market will move through a clear two-phase cycle in 2026 according to the latest Domain forecast.
The first half of the year will see strong momentum as the effects of interest rate cuts, rising incomes and policy support flow through, while the second half of the year is expected to see a natural slowdown as affordability limits re-emerge, particularly in Brisbane, Adelaide and Perth.
The expansion of the First Home Guarantee Scheme will be the single most influential demand driver in 2026.
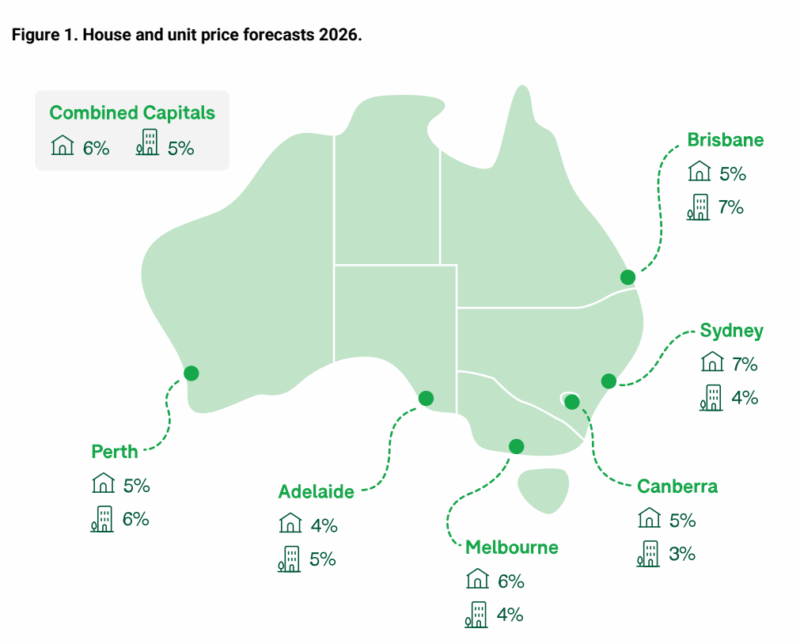
Property prices are forecast to reach record highs across all capital cities by the end of 2026.
Sydney is set to record the strongest house price growth, pushing the median to around $1.92 million.
Melbourne will stage a full recovery and continue rising to an expected $1.17 million.
Brisbane’s growth will moderate but remain solid, with units continuing to outperform.
Rents are projected to hit new records nationwide.
Rental conditions will tighten further in many markets, with unit rents rising faster than house rents in Brisbane, Adelaide and Perth as affordability pushes tenants toward smaller dwellings.
Housing supply will improve but remain well short of what is required to rebalance the market.
For investors, the best opportunities will remain in the affordable, investment-grade segment of the market.
The greatest risk for investors is not the market itself but choosing the wrong assets.
What if I told you that Australia’s property market is about to enter a phase we haven’t seen in years, a phase driven not just by interest rates, but by a wave of government policy, shifting affordability lines, and a surprising surge in first-home buyer activity?
According to Domain’s Forecast Report 2026, the next 18 months will reshape the housing landscape more than most Australians realise.
And whether you're an investor, a home owner or keen to get into the a property market, 2026 is shaping up to be one of those pivotal years, the kind you look back on and say “that was the turning point.”
So let’s break down what Domain believes is coming, and more importantly, what it means for you.
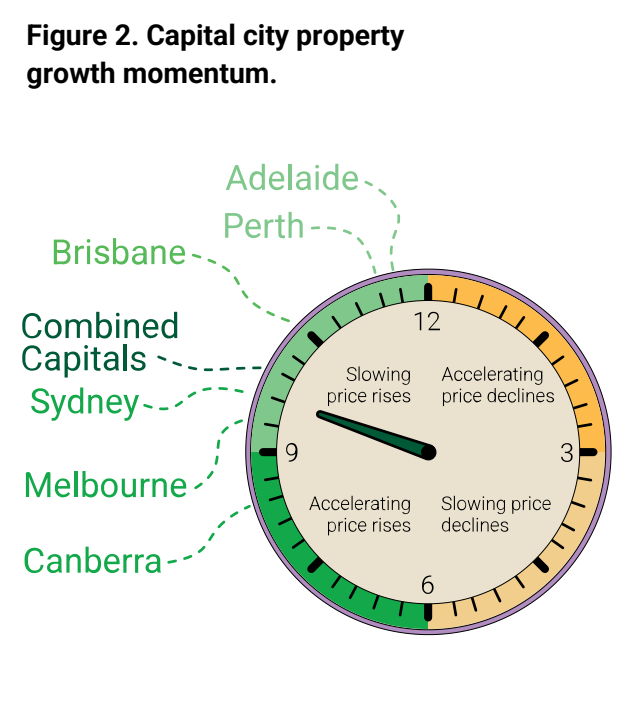
A market poised for acceleration, then moderation
Domain splits 2026 into two clear phases:
Phase 1: Momentum builds (January–June 2026)
Driven by:
-
Expansive first-home buyer stimulus
-
Lower interest rates beginning to fully flow through
-
Rising household incomes
-
Persistently tight housing supply
-
Lower listings volumes
This phase sees stronger price growth and heightened buyer competition, especially in the affordable price brackets.
Phase 2: Affordability ceilings hit (July–December 2026)
By mid–2026, affordability once again becomes a handbrake.
This is especially true in Adelaide, Brisbane and Perth, where several years of aggressive price growth have pushed borrowing capacity to its limits.
But even as growth moderates, it remains positive, just more subdued.
This two-speed dynamic will matter enormously for investors choosing between markets and asset classes.
The First Home Guarantee Scheme: the most Important Demand Shock of 2026
Domain believes that Government policy will be one of the biggest drivers of the property market next year.
The expanded First Home Guarantee Scheme, which now allows purchases with:
-
5% deposit
-
No LMI
-
No income caps
-
No annual limits on scheme places
-
Higher property price caps across every capital
This is poised to trigger a pull-forward of up to 20,000 first-home buyers in year one.

Note: That’s a massive influx of demand into a market that’s already supply-constrained.
Domain estimates this stimulus alone could lift prices 3.5% to 6.6% in the first year, equivalent to 125 basis points worth of rate cuts.
This is exactly the type of shock that:
-
Shortens deposit-saving times dramatically (from over 10 years to ~3 years in Sydney)
-
Pushes competition toward the lower end of the market
-
Encourages investors to re-enter ahead of rising prices
-
Intensifies bidding in the sub-$1m segment across Sydney, Perth, Brisbane and Adelaide
Yes, affordability is a problem, but when policy reduces entry barriers, demand shifts upward before supply can catch up.
Interest rates: a tailwind, but not a hurricane
While rate cuts in 2025 set the stage, Domain stresses that the RBA is unlikely to deliver further cuts anytime soon.
This means:
-
Borrowing conditions improve but don’t surge
-
Buyers feel more confident but still constrained
-
Price growth accelerates—but stays within boundaries
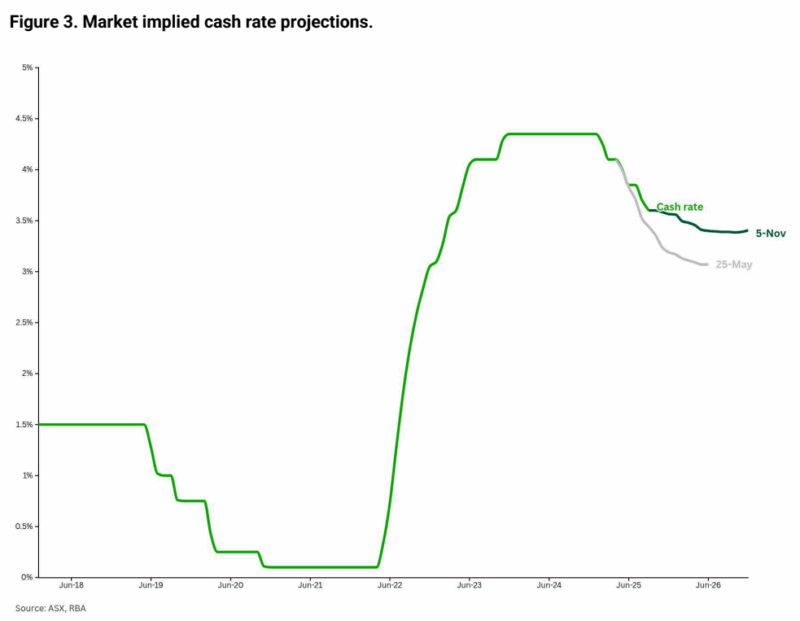
Sydney and Melbourne, always the most rate-sensitive markets, will react quickest and strongest, as they’ve done in every easing cycle since the mid-1990s.
And importantly, the psychology of rate cuts does almost as much as the cuts themselves.
Confidence returns. Enquiries rise. Even small improvements in borrowing capacity re-activate those sitting on the sidelines.
Supply pressures: still tight, but finally easing
Let’s be clear, Australia’s supply shortage isn’t going away in 2026.
But Domain notes the first credible signs of structural easing:
-
Population growth has slowed
-
Dwelling approvals have improved
-
Completions are rising through 2025 and into 2026
-
Vacancy rates are inching higher from record lows
-
The number of additional people per home is decreasing
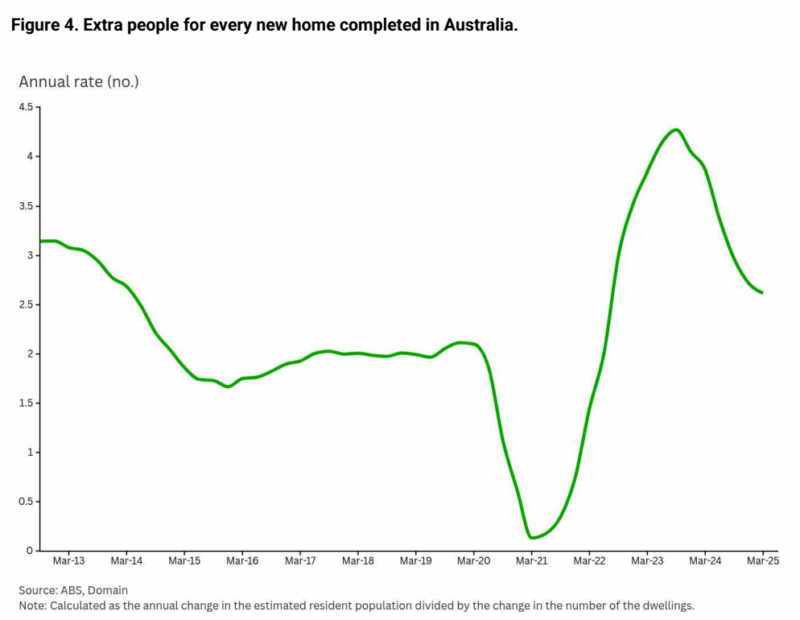
This doesn’t solve the shortage, it just reduces the pressure slightly.
But the market is still a long way from balanced.mAnd that’s why price and rent growth continue, despite rising supply.
Capital city breakdown
Sydney
Sydney is forecast to deliver the strongest house price growth of any capital, reaching:
-
$1.92 million for houses (+$173k)
-
$892,000 for units (+$52k)
Sydney remains:
-
The most responsive to interest rate cuts
-
The most supply-constrained in desirable areas
-
The most driven by high-income household segments
-
The market where affordability pressures have shifted buyers toward units
Rents are also forecast to hit new highs:
-
Houses: $815/week
-
Units: $792/week
With vacancy rates still among the lowest and incomes rising, rental competition stays fierce.
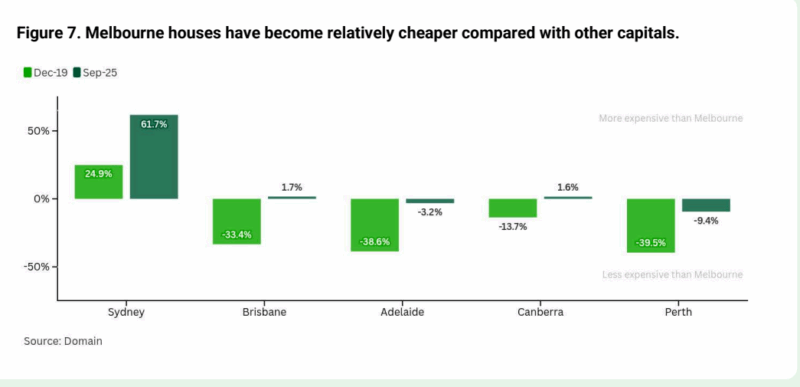
Melbourne
Melbourne is forecast to finally return to its pre-pandemic price highs and moves beyond them:
-
Houses: $1.17 million (+$87k)
This is a full recovery, driven by:
-
Improved relative affordability
-
The return of positive interstate migration
-
Strong auction clearance rates
-
Value gaps compared with Sydney and Brisbane
- Also read:Sydney housing market update | July 2026

- Also read:Melbourne housing market update | July 2026

- Also read:Melbourne property market forecast for 2026 & 2027 | Separating the fundamentals from the sentiment

- Also read:Australian housing market update | July 2026

- Also read:Brisbane Property Market Forecast [2026 & Beyond] – What The Olympics Decade Means for Investors.

- Also read:Sydney housing market update | July 2026
Units will rise more modestly in rent but remain popular due to affordability.
Brisbane
Brisbane house prices will rise another 5% to reach $1.19 million, but affordability is now a ceiling.
The extraordinary unit price growth of the past few years moderates, but still remains the strongest in the country, at 7% unit price growth
This is where investors should look closely:
-
Infrastructure for the 2032 Olympics still fuels demand
-
Domain notes heightened buyer enquiries
-
Households remain stretched but motivated
Brisbane remains a high-demand market, but only for well-located, investment-grade stock.
Adelaide
After years of double-digit gains, Adelaide now faces affordability pressures:
-
House price growth is forecast to slow to 4% (record high $1.11 million)
-
Units grow slightly faster at 5%
This is classic cycle behaviour according to the Domain report:
-
Rapid boom → affordability stress → slower growth
Mortgage repayments now absorb 51.5% of household income (up from 27% in 2019), one of the most dramatic affordability shifts of any state.
Perth
Perth is forecast to move past the $1 million mark with:
-
5% house price growth
-
6% unit price growth
Affordability remains favourable here compared to other capitals, and Domain highlights:
-
Strong income growth
-
Low unemployment
-
Low mortgage burden compared with Sydney, Melbourne or Adelaide
Vacancy rates remain the lowest nationally, while rents continue to rise strongly.
Canberra
Canberra is likely to complete its house price recovery:
-
$1.18 million median
-
3%–5% growth
And remains:
-
The most affordable city when compared to incomes
-
The most stable rental market
-
The most influenced by steady public sector employment
A predictable performer, but not a boom market.
Table 1. Price Forecast - Houses
| HOUSES | STRATIFIED MEDIAN PRICE | |||||||
| ANNUAL CHANGE | LEVEL | RECORD | |||||
| Capital City | 2025 | FY26 | 2026 | 2025 | FY26 | 2026 | 2026 |
| Sydney | 9% | 10% | 7% | $1,804,280 | $1,867,971 | $1,924,430 | YES |
| Melbourne | 7% | 8% | 6% | $1,104,704 | $1,142,582 | $1,170,168 | YES |
| Brisbane | 9% | 10% | 5% | $1,134,147 | $1,168,399 | $1,185,983 | YES |
| Adelaide | 9% | 8% | 4% | $1,069,748 | $1,096,653 | $1,107,646 | YES |
| Canberra | 4% | 7% | 5% | $1,122,400 | $1,150,629 | $1,178,409 | YES |
| Perth | 9% | 6% | 5% | $1,000,884 | $1,026,057 | $1,046,680 | YES |
| Combined capitals | 9% | 9% | 6% | $1,268,089 | $1,308,625 | $1,339,267 | YES |
Table 2. Price Forecast - Units
| UNITS | STRATIFIED MEDIAN PRICE | |||||||
| ANNUAL CHANGE | LEVEL | RECORD | |||||
| Capital City | 2025 | FY26 | 2026 | 2025 | FY26 | 2026 | 2026 |
| Sydney | 5% | 7% | 4% | $857,230 | $883,118 | $891,972 | YES |
| Melbourne | 5% | 6% | 4% | $602,409 | $614,517 | $626,869 | YES |
| Brisbane | 14% | 13% | 7% | $736,915 | $774,203 | $789,764 | YES |
| Adelaide | 16% | 11% | 5% | $651,640 | $671,320 | $681,423 | YES |
| Canberra | -1% | 2% | 3% | $609,887 | $620,914 | $630,888 | YES |
| Perth | 12% | 11% | 6% | $577,285 | $600,608 | $612,680 | YES |
| Combined capitals | 7% | 8% | 5% | $723,544 | $747,043 | $759,112 | YES |
Rents: still rising across every capital
Domain forecasts record rents across all cities by the end of 2026.
The dynamics will be:
-
House rents rise fastest in Sydney, Melbourne and Canberra
-
Unit rents rise faster in Brisbane, Adelaide and Perth
-
Vacancy rates stay painfully low, especially in Perth and Adelaide
-
Slower population growth takes some pressure off—but not enough
The shift toward smaller, more affordable dwellings continues. And as incomes rise, tenants can absorb moderate increases.
Table 3. Rent Forecast - Houses
| HOUSES | ADVERTISED RENTS | |||||
| ANNUAL CHANGE | LEVEL (PER WEEK) | RECORD | |||
| Capital City | 2025 | 2026 | 2025 | 2026 | 2026 |
| Sydney | 2% | 4% | $785 | $815 | YES |
| Melbourne | 1% | 2% | $583 | $595 | YES |
| Brisbane | 4% | 4% | $663 | $690 | YES |
| Adelaide | 4% | 4% | $626 | $652 | YES |
| Canberra | 1% | 3% | $705 | $725 | YES |
| Perth | 5% | 4% | $704 | $731 | YES |
| Combined capitals | 1% | 3% | $654 | $676 | YES |
Table 4. Rent Forecast - Units
| UNITS | ADVERTISED RENTS | |||||
| ANNUAL CHANGE | LEVEL (PER WEEK) | RECORD | |||
| Capital City | 2025 | 2026 | 2025 | 2026 | 2026 |
| Sydney | 7% | 5% | $758 | $792 | YES |
| Melbourne | 5% | 3% | $578 | $597 | YES |
| Brisbane | 6% | 5% | $633 | $662 | YES |
| Adelaide | 5% | 4% | $525 | $548 | YES |
| Canberra | 4% | 4% | $585 | $609 | YES |
| Perth | 1% | 4% | $606 | $631 | YES |
| Combined capitals | 4% | 4% | $655 | $682 | YES |
What this means for investors in 2026
1. The affordable end of the market will outperform
Because that’s where:
-
First-home buyers are flocking
-
Investors are re-entering
-
Government policy is focused
2. Units will outperform houses in select markets
This is particularly in Brisbane, Adelaide and Perth.
But not all units, of course, only those that are investment-grade - not off the plan units or those in high rise towers.
3. Mid-2026 will be the high-momentum window
Buyers acting before affordability ceilings bite will be advantaged according to the Domain report.
4. Rental yields will remain strong, especially in Perth, Adelaide and Brisbane.
5. Population trends are becoming more important
Melbourne’s return to positive interstate migration is a major signal for the housing market.
Meanwhile, Perth and Brisbane remain magnets for affordability-driven migration.
6. The real risk is buying inferior assets
Markets may rise broadly, but A-grade assets will outperform dramatically.
On the other hand, B- and C-grade properties risk underperformance once the market moderates.
Final word
We’re entering a property cycle powered less by speculative exuberance and more by structural change:
-
Policy
-
Demographics
-
Income trajectories
-
Supply constraints
-
Shift in buyer composition
For seasoned investors, 2026 offers opportunity, but not blind opportunity.
This is a cycle that will reward strategic, evidence-based decisions, not FOMO buying or chasing hotspots.
Those who select high-quality, investment-grade assets in supply-constrained, high-demand locations will look back at 2026 as a year they set themselves up for significant long-term upside.


