

Key takeaways
The Australian Property Institute (API) has just released its inaugural Valuation Report, and it turns that long-held belief on its head.
While housing markets have seen strong growth, industrial property, especially in Sydney, has quietly emerged as a top performer.
Sydney industrial warehouses emerged as the highest performing non-farm property sector over the past 20 years with a return of 261%.
Over the last 10 years, Queensland property owners have been the chief beneficiaries of ‘sea changers’ and ‘tree changers’, taking out seven of the top 10 best performing residential property regions across Australia in the 2014-2024 period.
Western Australia, NSW and Victoria had one region each in the best performing markets.
Coolangatta (QLD) and Broadbeach (QLD) were the strongest non-capital city markets anywhere in Australia over the last decade, with prices increasing by 154%.
Housing supply remains a key driver of housing unaffordability. For example, despite a NSW Government commitment to deliver 377,000 new well-located homes in the state by 2029, under the National Housing Accord, residential development has fallen below business as usual levels.
NSW Government housing activity and supply figures also suggest the state is lagging with 21,214 net completions in the year to June 2024, 17.8% below the previous five financial years’ average of 25,823. Building Approvals for the year to June 2024 were 25,852, 23.6% below the previous five financial years’ average of 33,847[3].
Greater Sydney housing supply forecasts suggest only an additional 172,900 new homes will be built to 2028-29, which is 10.2% below the previous six financial years’ total completions of 192,498
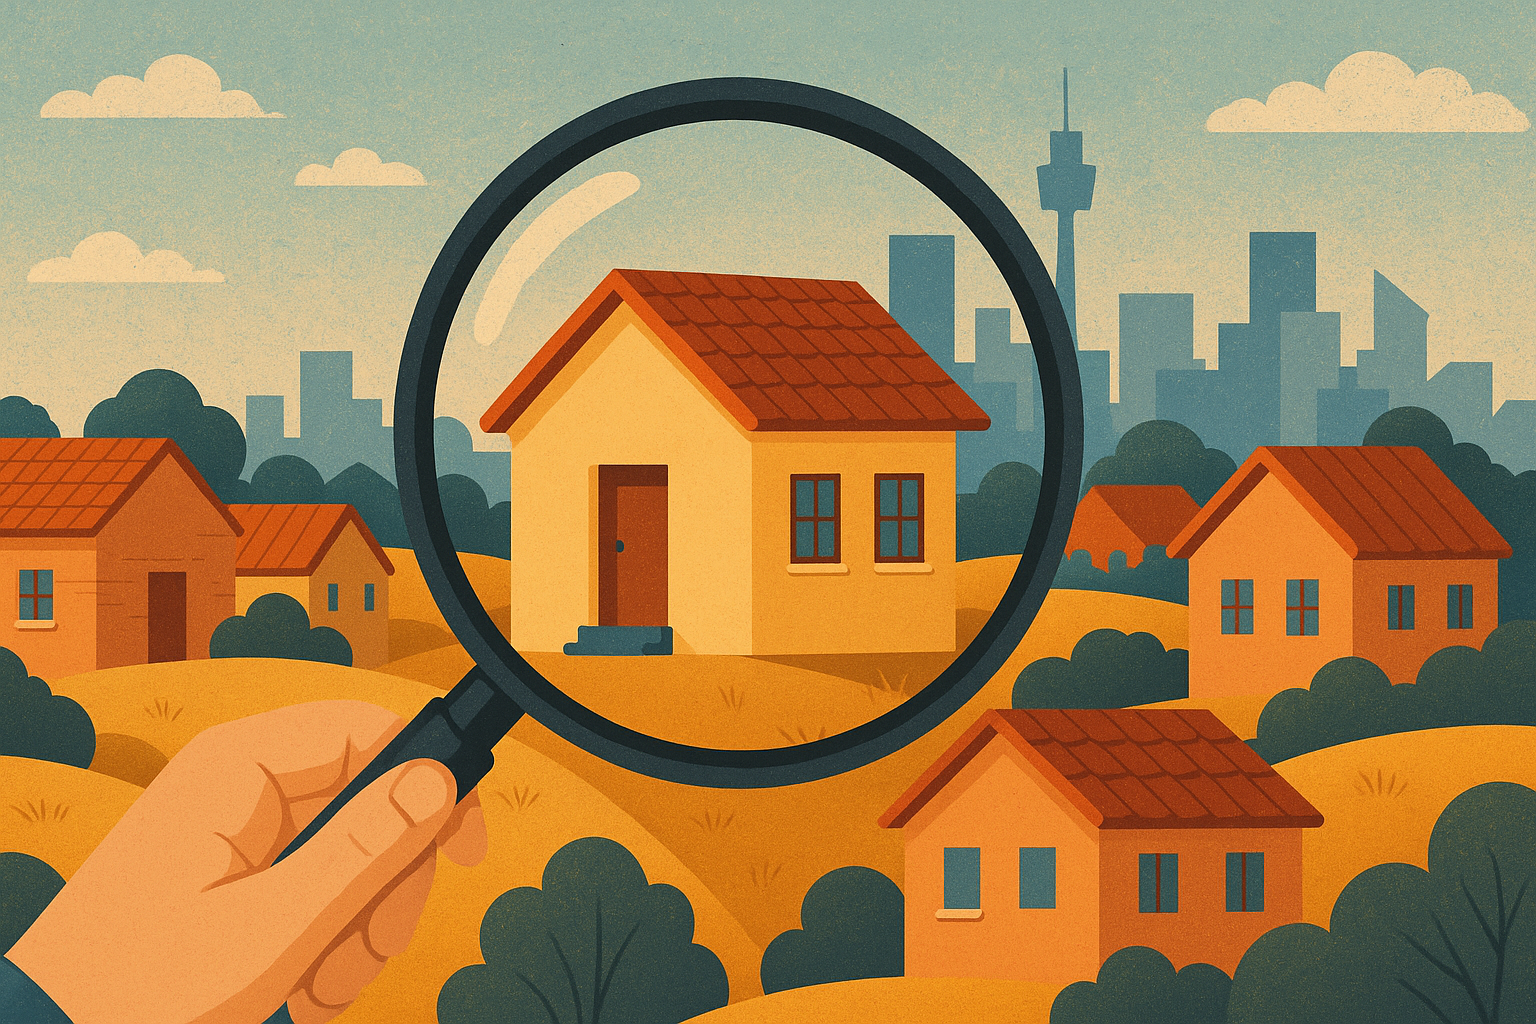
For decades, Sydney and Melbourne have dominated the conversation when it comes to property investment in Australia.
They’ve been the go-to markets for capital growth, perceived as safe, stable, and predictably lucrative.
But the Australian Property Institute (API) has just released its inaugural Valuation Report, and it turns that long-held belief on its head.
This isn’t just another data set.
It’s a 20-year deep dive into residential, commercial, industrial, and agricultural property values across every Australian state and territory.
And its findings challenge many of the assumptions property investors have held for years.
Let’s explore the key takeaways—and more importantly, what they mean for strategic investors like us.

Smaller cities take the crown in residential growth
According to the API report, Adelaide has topped the list for capital city house price growth over the past 20 years, with a staggering 175% increase.
Hobart follows closely at 172%.
Sydney and Melbourne, while still strong, lag behind at 171% and 169% respectively.
Brisbane also notched 169%, followed by Canberra (148%), Perth (123%) and Darwin (102%).
These numbers are particularly striking when you compare them to inflation over the same period, just 67%.
So why did the smaller cities outperform?
Several factors come into play:
-
Affordability pressures drove buyers to more reasonably priced markets.
-
Lifestyle changes (especially post-COVID) accelerated interest in secondary cities.
-
Government and infrastructure investment in places like Adelaide and Hobart improved liveability and employment options.

Note: Good investment isn’t about sentiment, it’s about being in the right market at the right time, with the right strategy.
Agriculture: the best-performing property class—by far
Interestingly, it wasn’t residential, commercial, or even industrial property that delivered the strongest growth.
It was agricultural land.
Over the past two decades, farming land values increased by an average of 256%, compared to:
-
154% for housing
-
164% for industrial property
-
143% for commercial property
What’s behind this massive appreciation?
-
High global commodity prices
-
Consistent demand for food security
-
Climate resilience in some regions
-
An overlay of renewable energy projects in areas like the Wimmera, which saw an incredible 802% increase in value, the highest of any property market in the country.
Agriculture is no longer just for farmers. It’s now a core asset class and increasingly a strategic one.
Industrial leads the commercial pack
While housing markets have seen strong growth, industrial property, especially in Sydney, has quietly emerged as a top performer.
-
Sydney industrial warehouses grew 261% over 20 years, making it the best-performing non-farming property type in the country.
-
Sydney commercial came in second at 176%.
-
Adelaide industrial warehouses weren’t far behind at 173%.
This speaks to broader structural shifts:
-
The rise of e-commerce has created strong demand for logistics and warehousing.
-
Land scarcity around metropolitan areas has led to capital growth.
-
Corporations are paying premiums for newer, greener buildings to meet ESG mandates.
Queensland’s coastal markets are booming
Zoom in on the last 10 years, and you’ll see that Queensland is dominating the regional property growth scene.
Seven of the top 10 highest-growth regions are in Queensland.
The top performers?
-
Coolangatta and Broadbeach–Burleigh both saw 154% growth.
-
Maroochy (141%), Noosa Hinterland (134%), and Robina (126%) were also among the leaders
This is no accident. We’ve seen a long-term shift driven by:
- Also read:Australian housing market update | July 2026

- Also read:Everything you need to know about the state of Australia’s property markets in 20 charts – July 2026

- Also read:National Weekly Auction Report – July 18th 2026 | Early Signs of Improvement Continue in Mid-winter Home Auction Markets

- Also read:National Vacancy Rate Rises to 1.3% | SQM Research

- Also read:This week’s Australian Property Market Update – Latest Data, State by State July 14th 2026

-
Interstate migration from NSW and VIC
-
Lifestyle preferences
-
Relative affordability
-
Ongoing infrastructure investment in the southeast
It’s a clear case of lifestyle meeting leverage, and it’s working.
Housing affordability: a structural crisis
The API’s long-term data paints a sobering picture of just how far housing affordability has slipped.
Back in 1975, a Sydney home cost just 4.2 times the average annual wage. Today it’s 13 times.
Melbourne has jumped from 3.5x to 8.4x.
Brisbane, from 2.9x to 8.3x.
Nationally, we’ve gone from 3.4x to 8.1x.
This trend has been driven by:
-
Strong capital growth outpacing wage growth
-
Chronic undersupply of housing stock
-
A policy environment that often struggles to align planning, development, and infrastructure delivery
We’re not just facing a short-term affordability blip.
We’re in a generational shift where ownership is becoming more elusive, especially for younger Australians.
Note: For investors, that only reinforces the long-term opportunity in quality rental housing. Build-to-rent, dual-occupancy dwellings, and high-amenity townhomes will continue to be in strong demand.
Supply is still falling short
The report also underscores one of the biggest systemic risks to the market: Australia isn’t building enough homes.
In NSW, despite a government commitment to deliver 377,000 new homes by 2029, we’re seeing:
-
Net completions of just 21,214 in the year to June 2024—18% below the five-year average
-
Building approvals down 23.6%
-
A forecast shortfall of at least 19,500 homes in Greater Sydney over the next four years.
This is a fundamental reason prices have remained resilient even amid rising interest rates.
Demand remains strong, but supply just isn’t keeping up.
Energy, emissions and land use: a new frontier
Another theme emerging from the report is the role of net-zero targets and renewable energy projects in shaping property values.
Valuers are now having to assess:
-
The impact of transmission infrastructure cutting across farmland
-
The economics of solar and wind projects on rural land
-
Carbon sequestration deals between landowners and corporations
As emissions reduction becomes a national imperative, we’ll see a growing divergence between land that can adapt and land that can’t.
It will be expert valuation and advisory services that help determine the best use.
So, where to from here?
The API’s data confirms what I’ve been saying for years: the property market isn’t a monolith.
It’s not just about capital cities or buying the median house in a “blue-chip” suburb.
It’s about understanding long-term macro trends, demographic shifts, infrastructure plays, policy changes, and asset class performance.
If there’s one thing to take away from this report, it’s that informed investors will win the next decade, just as they did the last.
We’re at a critical inflection point:
-
Migration is surging
-
Infrastructure is evolving
-
The energy transition is reshaping land values
-
And affordability remains one of the defining economic issues of our time
Now is the time for strategic thinking, smart asset selection, and long-term vision.
That’s exactly what we do at Metropole: help clients build resilient portfolios.


