Key takeaways
Total national property listings rose 3.1% month-on-month in January to 216,826 dwellings, reflecting a seasonal rebound following December’s sharp contraction.
Listings remain 11.0% lower year-on-year, highlighting ongoing structural supply tightness.
New listings lifted sharply in Sydney, while Brisbane also saw a solid monthly bounce, despite activity remaining below last year’s levels.
Old listings increased 4.8% nationally, suggesting some accumulation of longer-dated stock as buyer activity resets post-holidays.
Asking prices were mixed in January, with strength continuing in Brisbane, Perth, and Adelaide.
SQM Research’s Weekly Asking Prices Index for the week ending 27 January 2026 showed mixed price movements across capital cities, though annual growth remains strong.
Nationally, asking prices eased slightly over the month for houses (-0.3%), while unit prices rose 1.3%, with combined dwellings broadly flat (-0.1%) but 11.4% higher year-on-year.
Sydney house asking prices were steady, up 0.2% monthly, and remain 10.6% higher year-on-year, while unit prices edged higher (+0.4% MoM).
Melbourne recorded modest softness, with combined prices down 0.1% for the month, though still 7.7% higher year-on-year.
Brisbane continued to outperform, with combined asking prices rising 1.8% monthly and 20.7% year-on-year, supported by strong gains in both houses and units.
Perth also recorded strong momentum, with combined prices up 2.9% for the month and 13.0% annually, driven by unit price growth.
Adelaide maintained solid conditions, with combined asking prices rising 0.5% monthly and 18.9% year-on-year.
Canberra and Hobart recorded divergent monthly price movements across houses and units, reflecting uneven short-term market dynamics, though annual price growth remains positive.
Darwin continued to exhibit elevated volatility, with inconsistent performance across property types.

Australia’s housing market recorded a modest rebound in listings during January as sellers returned following the holiday period.
Total national listings increased 3.1% to 216,826 dwellings, reversing part of December’s seasonal decline. Despite the lift, total listings remain 11.0% lower than a year ago.
Sydney listings rose 7.1% to 28,922, while Melbourne increased 3.6% to 35,980.
Brisbane (+5.5%) and Adelaide (+5.9%) also recorded solid monthly gains, while Perth rose 3.2%.
Canberra listings increased 3.8%, while Hobart lifted 2.3%.
Darwin was the only capital to record a monthly decline (-0.7%) and remains 36.3% below January 2025 levels.
Total Listings of Properties for Sale
| City | Jan 2026 Total | Dec 2025 Total | Jan 2025 Total | Monthly change | Yearly Change % |
|---|---|---|---|---|---|
| Sydney | 28,922 | 27,012 | 29,791 | 7.1% | -2.9% |
| Melbourne | 35,980 | 34,719 | 37,873 | 3.6% | 5.0% |
| Brisbane | 12,546 | 11,890 | 16,241 | 5.5% | -22.8% |
| Perth | 11,971 | 11,595 | 15,271 | 3.2% | -21.6% |
| Adelaide | 7,433 | 7,021 | 7,857 | 5.9% | -5.4% |
| Canberra | 4,212 | 4,058 | 4,304 | 3.8% | -2.1% |
| Darwin | 718 | 723 | 1,127 | -0.7% | -36.3% |
| Hobart | 2,715 | 2,655 | 3,116 | 2.3% | -12.9% |
| National | 216,826 | 210,237 | 243,642 | 3.1% | -11.0% |
Source: SQM Research
New Listings
New listings were mixed in January, reflecting a staggered return of vendor activity across capital cities.
Nationally, new listings slipped 4.7% to 51,199, marginally below January 2025 levels (-3.4% YoY).
Sydney recorded a strong rebound, with new listings jumping 52.9% month-on-month, while Brisbane rose 19.5% and Darwin increased 25.8%.
Melbourne and Adelaide posted modest gains (+4.6% and +5.7% respectively), while Canberra rose 3.0%.
Perth declined slightly (-3.8%), while Hobart recorded a sharper fall (-23.3%) following a stronger December.
New Listings of properties for sale (less than 30 days)
| City | Jan 2026 Total | Dec 2025 Total | Jan 2025 Total | Monthly change | Yearly Change % |
|---|---|---|---|---|---|
| Sydney | 10,880 | 7,188 | 10,027 | 52.9% | 8.5% |
| Melbourne | 11,652 | 11,136 | 10,504 | 4.6% | 10.9% |
| Brisbane | 4,995 | 4,181 | 5,898 | 19.5% | -15.3% |
| Perth | 4,267 | 4,436 | 4,714 | -3.8% | -9.5% |
| Adelaide | 3,039 | 2,874 | 2,905 | 5.7% | 4.6% |
| Canberra | 1,384 | 1,344 | 1,214 | 3.0% | 14.0% |
| Darwin | 200 | 159 | 131 | 25.8% | 52.7% |
| Hobart | 562 | 733 | 530 | -23.3% | 6.0% |
| National | 51,199 | 53,378 | 53,019 | -4.7% | -3.4% |
Source: SQM Research
Old Listings
Older stock increased 4.8% nationally to 63,195 dwellings, indicating some accumulation of longer-dated listings as the market resets early in the year.
However, old listings remain 12.0% lower year-on-year, suggesting overall stock levels remain historically tight.
Melbourne (+4.3%), Adelaide (+3.9%) and Perth (+1.6%) recorded notable monthly increases. Sydney (+0.4%) and Brisbane (+0.1%) were broadly steady.
Canberra (-3.5%), Hobart (-2.1%) and Darwin (-5.2%) continued to see reductions in older stock, with Darwin sitting 67.7% below last year’s levels.
| City | Jan-2026 | Dec 2025 | Jan 2025 | Monthly change | Yearly Change % |
|---|---|---|---|---|---|
| Sydney | 5,698 | 5,674 | 6,082 | 0.4% | -6.3% |
| Melbourne | 7,821 | 7,500 | 9,102 | 4.3% | -14.1% |
| Brisbane | 1,597 | 1,596 | 1,779 | 0.1% | -10.2% |
| Perth | 1,315 | 1,294 | 1,582 | 1.6% | -16.9% |
| Adelaide | 848 | 816 | 892 | 3.9% | -4.9% |
| Canberra | 627 | 650 | 768 | -3.5% | -18.4% |
| Darwin | 184 | 194 | 570 | -5.2% | -67.7% |
| Hobart | 997 | 1,018 | 1,283 | -2.1% | -22.3% |
| National | 63,195 | 60,320 | 71,835 | 4.8% | -12.0% |
Source: SQM Research
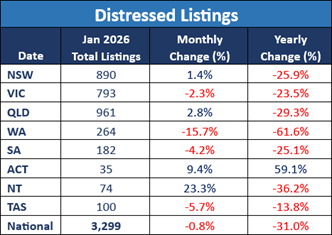
Distressed Listings
Distressed listings edged lower nationally in January, down 0.8% to 3,299 dwellings, and remain 31.0% lower year-on-year.
New South Wales (+1.4%) and Queensland (+2.8%) recorded modest monthly increases, while Victoria declined 2.3%.
Western Australia saw the sharpest monthly fall (-15.7%) and remains 61.6% lower than a year ago.
The ACT recorded a 9.4% monthly rise and is now 59.1% higher year-on-year, continuing to warrant close monitoring.
Distressed Property Listings

Source: SQM Research
Asking Prices
Sydney Weekly Asking Prices Index
| Property type | Price ($) | Weekly Change | Monthly Change % | Annual % change |
|---|---|---|---|---|
| All Houses | 2,202,489 | 6.946 | -0.1% | 11.8% |
| All Units | 901,235 | -0.735 | 0.0% | 7.3% |
| Combined | 1,671,154 | 3.809 | -0.1% | 10.6% |
Source: SQM Research
Melbourne Weekly Asking Prices Index
| Property type | Price ($) | Weekly Change | Monthly Change % | Annual % change |
|---|---|---|---|---|
| All Houses | 1,337,117 | -12.013 | -1.5% | 6.8% |
| All Units | 672,353 | 1.547 | 0.5% | 9.7% |
| Combined | 1,126,620 | -7.719 | -1.2% | 7.2% |
Source: SQM Research
Perth Weekly Asking Prices Index
| Property type | Price ($) | Weekly Change | Monthly Change % | Annual % change |
|---|---|---|---|---|
| All Houses | 1,216,566 | 2.511 | 2.3% | 9.9% |
| All Units | 771,468 | 5.531 | 3.3% | 27.4% |
| Combined | 1,099,719 | 3.304 | 2.5% | 12.7% |
Source: SQM Research
Brisbane Weekly Asking Prices Index
| Property type | Price ($) | Weekly Change | Monthly Change % | Annual % change |
|---|---|---|---|---|
| All Houses | 1,443,756 | -0.692 | 1.8% | 20.6% |
| All Units | 890,366 | -0.166 | 0.8% | 31.3% |
| Combined | 1,304,136 | -0.559 | 1.7% | 22.2% |
Source: SQM Research.
Adelaide Weekly Asking Prices Index
| Property type | Price ($) | Weekly Change | Monthly Change % | Annual % change |
|---|---|---|---|---|
| All Houses | 1,160,364 | -10.164 | -2.0% | 17.1% |
| All Units | 622,728 | -1.998 | 3.0% | 18.7% |
| Combined | 1,063,535 | -8.693 | -1.5% | 17.2% |
Source: SQM Research
Canberra Weekly Asking Prices Index
| Property type | Price ($) | Weekly Change | Monthly Change % | Annual % change |
|---|---|---|---|---|
| All Houses | 1,259,009 | -2.384 | -1.7% | 5.9% |
| All Units | 614,353 | -1.603 | 0.3% | 2.8% |
| Combined | 1,015,738 | -2.089 | -1.2% | 4.6% |
Source: SQM Research
Darwin Weekly Asking Prices Index
| Property type | Price ($) | Weekly Change | Monthly Change % | Annual % change |
|---|---|---|---|---|
| All Houses | 809,357 | 14.443 | 4.6% | 13.0% |
| All Units | 476,115 | 3.635 | 1.5% | 16.1% |
| Combined | 678,307 | 10.193 | 3.7% | 13.8% |
Source: SQM Research
Hobart Weekly Asking Prices Index
| Property type | Price ($) | Weekly Change | Monthly Change % | Annual % change |
|---|---|---|---|---|
| All Houses | 896,439 | 1.197 | 1.1% | 10.3% |
| All Units | 518,635 | -0.435 | -0.6% | 2.3% |
| Combined | 838,677 | 0.947 | 1.0% | 9.4% |
Source: SQM Research
National Weekly Asking Prices Index
| Property type | Price ($) | Weekly Change | Monthly Change % | Annual % change |
|---|---|---|---|---|
| All Houses | 1,077,311 | 1.797 | -0.4% | 11.8% |
| All Units | 643,767 | 4.483 | 1.7% | 13.1% |
| Combined | 983,140 | 2.380 | -0.1% | 11.9% |
Source: SQM Research
Capital City Average Weekly Asking Prices Index
| Property type | Price ($) | Weekly Change | Monthly Change % | Annual % change |
|---|---|---|---|---|
| All Houses | 1,584,739 | -4.751 | -0.7% | 11.7% |
| All Units | 799,131 | -0.244 | 0.1% | 12.4% |
| Combined | 1,349,703 | -3.403 | -0.6% | 11.7% |
Source: SQM Research
Final note...
Sam Tate, Head of Property of SQM Research said:
“January’s data reflects a fairly typical reopening of the housing market following the Christmas break,” said Sam Tate.
“While listings have lifted modestly, the bigger picture is that stock levels remain well below last year, which continues to underpin prices in most capital cities.”
“We’re also seeing some early accumulation in older listings, particularly in Melbourne and Adelaide, which suggests buyers are becoming more selective after strong price growth in 2025.”
“Overall, the market remains undersupplied. Unless new listings rise materially in the coming months, upward pressure on prices—especially in Brisbane, Perth and Adelaide—is likely to persist through the first half of 2026.”


