


Key takeaways
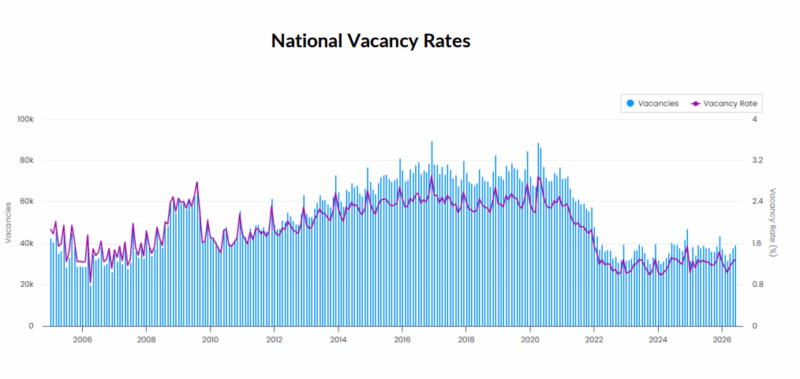
Australia's national residential vacancy rate increased to 1.3% in June 2026, up from 1.2% in May, with the total number of residential vacancies rising slightly to 39,229 dwellings from 37,844 the previous month.
While the increase suggests a modest easing in rental market conditions, vacancy rates remain well below long-term averages, with every capital city continuing to record vacancy rates below 2%, highlighting the ongoing shortage of rental accommodation across Australia.
SQM Research released its latest data on residential rental property vacancy rates.
Australia's national residential vacancy rate increased to 1.3% in June 2026, up from 1.2% in May, with the total number of residential vacancies rising slightly to 39,229 dwellings from 37,844 the previous month.
While the increase suggests a modest easing in rental market conditions, vacancy rates remain well below long-term averages, with every capital city continuing to record vacancy rates below 2%, highlighting the ongoing shortage of rental accommodation across Australia.
Vacancy Rates - June 2026
| City | June 2025 Vacancies | June 2025 Vacancy Rate | May 2026 Vacancies | May 2026 Vacancy Rate | June 2026 Vacancies | June 2026 Vacancy Rate |
|---|---|---|---|---|---|---|
| Sydney | 11,482 | 1.6% | 10,820 | 1.5% | 11,957 | 1.6% |
| Melbourne | 9,414 | 1.8% | 8,446 | 1.6% | 8,640 | 1.6% |
| Brisbane | 3,147 | 0.9% | 3,124 | 0.9% | 3,065 | 0.9% |
| Perth | 1,457 | 0.8% | 1,265 | 0.7% | 1,247 | 0.6% |
| Adelaide | 1,268 | 0.8% | 1,081 | 0.7% | 1,096 | 0.7% |
| Canberra | 920 | 1.5% | 970 | 1.6% | 1,063 | 1.7% |
| Darwin | 115 | 0.5% | 75 | 0.3% | 64 | 0.3% |
| Hobart | 175 | 0.6% | 161 | 0.6% | 185 | 0.7% |
| National | 39,027 | 1.3% | 37,844 | 1.2% | 39,229 | 1.3% |
Source: SQM Research
Capital city highlights
Sydney:
Vacancy rates increased slightly to 1.6%, up from 1.5% in May, with 11,957 dwellings available.
The Sydney rental market has continued to ease modestly, although conditions remain considerably tighter than historical averages.
Melbourne:
Vacancy rates held steady at 1.6%, with 8,640 vacancies recorded.
Melbourne continues to exhibit relatively balanced rental conditions compared to other capital cities.
Brisbane:
Vacancy rates remained unchanged at 0.9%, with 3,065 dwellings available.
Rental conditions remain extremely tight as population growth continues to support demand.
Perth:
Vacancy rates declined to 0.6%, down from 0.7%, with 1,247 dwellings available.
Perth remains one of Australia's most constrained rental markets.
Adelaide:
Vacancy rates remained unchanged at 0.7%, with 1,096 dwellings available.
Limited rental stock continues to underpin tight market conditions.
Canberra:
Vacancy rates increased to 1.7%, up from 1.6%, with 1,063 dwellings available.
The ACT continues to record a gradual easing in rental availability.
Darwin:
Vacancy rates remained unchanged at 0.3%, with only 64 dwellings available.
Darwin continues to record Australia's lowest vacancy rate, reflecting an exceptionally tight rental market.
Hobart:
Vacancy rates increased to 0.7%, up from 0.6%, with 185 dwellings available.
While vacancy rates have risen slightly, rental availability remains constrained.
Advertised rents analysis
National advertised rents remained elevated through July, with combined rents easing 0.4% over the past 30 days but remaining 8.1% higher than a year ago, highlighting the resilience of rental pricing despite a modest increase in vacancies.
The national combined rent average now stands at $697.43 per week, while the capital city average sits at $793.63 per week.
Nationally, house rents eased 0.5% over the month but remain 8.7% higher over the year, while unit rents declined 0.2% monthly and are 7.1% higher annually, suggesting rental growth is beginning to moderate after a sustained period of strong increases.
Sydney:
Combined rents eased 0.4% for the month but remain 7.6% higher year-on-year, with house rents averaging $1,149.81 per week.
Melbourne:
Combined rents declined 0.3% over the month while remaining 5.9% higher annually, supported by continued demand for well-located properties.
Brisbane:
Combined rents rose 1.0% for the month and are 9.1% higher year-on-year, maintaining one of the strongest annual growth rates among the eastern capitals.
Perth:
Combined rents declined 1.6% over the month but remain 5.0% higher than a year ago, suggesting some easing following an extended period of exceptional rental growth.
Adelaide:
Combined rents increased 0.6% for the month and 3.4% annually, with unit rents continuing to outperform houses.
Canberra:
Combined rents rose 0.7% over the month and 5.8% year-on-year, reflecting improving rental demand.
Darwin:
Combined rents increased 0.9% for the month and 13.8% annually, continuing to record some of the strongest rental growth in Australia.
Hobart:
Combined rents declined 0.9% over the month but remain 12.1% higher year-on-year, reflecting ongoing supply constraints despite recent moderation.
Weekly rents index
Sydney
| Property Type | Rent ($) | Weekly change | Monthly change | 12 Months change |
|---|---|---|---|---|
| All Houses | $1,149.81 | -9.82 | -0.5% | 7.4% |
| All Units | $757.53 | 0.47 | -0.4% | 7.8% |
| Combined | $916.73 | -3.71 | -0.4% | 7.6% |
Source: SQM Research
Melbourne
| Property Type | Rent ($) | Weekly change | Monthly change | 12 Months change |
|---|---|---|---|---|
| All Houses | $815.53 | 3.47 | -0.7% | 6.5% |
| All Units | $603.73 | -1.74 | 0.2% | 5.0% |
| Combined | $692.80 | 0.46 | -0.3% | 5.9% |
Source: SQM Research
Brisbane
| Property Type | Rent ($) | Weekly change | Monthly change | 12 Months change |
|---|---|---|---|---|
| All Houses | $840.90 | 1.11 | 1.2% | 10.4% |
| All Units | $643.99 | 0.01 | 0.6% | 7.1% |
| Combined | $752.16 | 0.61 | 1.0% | 9.1% |
Source: SQM Research
Perth
| Property Type | Rent ($) | Weekly change | Monthly change | 12 Months change |
|---|---|---|---|---|
| All Houses | $884.58 | -4.58 | -1.9% | 6.4% |
| All Units | $670.61 | -5.62 | -1.1% | 2.4% |
| Combined | $796.40 | -5.01 | -1.6% | 5.0% |
Source: SQM Research
Adelaide
| Property Type | Rent $) | Weekly change | Monthly change | 12 Months change |
|---|---|---|---|---|
| All Houses | $687.02 | -2.01 | 0.6% | 2.2% |
| All Units | $559.61 | 2.39 | 0.7% | 6.0% |
| Combined | $644.17 | -0.53 | 0.6% | 3.4% |
Source: SQM Research
Canberra
| Property Type | Rent ($) | Weekly change | Monthly change | 12 Months change |
|---|---|---|---|---|
| All Houses | $840.83 | -0.83 | 0.2% | 8.6% |
| All Units | $606.39 | 1.60 | 1.4% | 3.1% |
| Combined | $711.56 | 0.52 | 0.7% | 5.8% |
Source: SQM Research
Darwin
| Property Type | Rent ($) | Weekly change | Monthly change | 12 Months change |
|---|---|---|---|---|
| All Houses | $834.53 | -4.53 | -1.1% | 8.2% |
| All Units | $654.08 | 21.93 | 2.6% | 19.1% |
| Combined | $728.08 | 11.08 | 0.9% | 13.8% |
Source: SQM Research
Hobart
| Property Type | Rent 9$) | Weekly change | Monthly change | 12 Months change |
|---|---|---|---|---|
| All Houses | $627.70 | 1.31 | -0.2% | 9.8% |
| All Units | $576.80 | -11.79 | -1.9% | 16.0% |
| Combined | $607.44 | -3.91 | -0.9% | 12.1% |
Source: SQM Research
National
| Property Type | Rent ($) | Weekly change | Monthly change | 12 Months change |
|---|---|---|---|---|
| All Houses | $777.00 | 4.00 | -0.5% | 8.7% |
| All Units | $605.00 | 4.00 | -0.2% | 7.1% |
| Combined | $697.43 | 4.00 | -0.4% | 8.1% |
Source: SQM Research
Cap City Average
| Property Type | Rent ($) | Weekly change | Monthly change | 12 Months change |
|---|---|---|---|---|
| All Houses | $921.00 | -4.00 | -0.9% | 6.7% |
| All Units | $681.00 | 0.00 | -0.3% | 6.4% |
| Combined | $793.63 | -1.88 | -0.6% | 6.6% |
Source: SQM Research
Commentary
While the national vacancy rate has edged up to 1.3%, Australia's rental market remains exceptionally tight by historical standards.
Most capital cities continue to record vacancy rates below one per cent or only marginally above, highlighting that rental supply remains insufficient to meet demand.
The encouraging sign is that rental growth appears to be moderating in some markets, with national asking rents easing slightly over the past month.
However, annual rental growth remains strong at 8.1%, and cities such as Darwin, Hobart and Brisbane continue to experience significant rental inflation.”
Perth and Darwin remain particularly constrained, with vacancy rates of just 0.6% and 0.3% respectively.
Without a substantial increase in the supply of rental housing, affordability pressures are likely to remain a challenge for tenants for some time yet.


