Key takeaways
Negative gearing on established residential properties purchased after budget night (May 12) will be abolished from 1 July 2027, while new builds retain full deductibility and the CGT concessions.
Existing investors are grandfathered, so if you already own investment property, the rules applying to you have not changed.
The national auction clearance rate was 52.2% for the week of May 23, down modestly from the prior week, with auction volumes recovering but clearance rates running well below year-ago levels.
Three consecutive RBA rate hikes have taken the cash rate to 4.35%, fully reversing last year's cuts - with the major banks now split on whether further hikes follow.
National values remain near their peak and are up 37.6% over five years, with Brisbane and Perth still leading annual growth.
Supply constraints remain a core support for prices, with Perth and Brisbane advertising stock still far below five-year averages.
The market is more fragmented than ever - don't make decisions based on national averages. The right property, in the right suburb, with the right structure matters more now than it did a month ago.
A lot has happened in a fortnight, and if you've been watching the headlines, you could be forgiven for feeling like the ground has shifted beneath the property market.
The RBA had already raised rates three times this year, taking the cash rate back to 4.35% - effectively unwinding every cut made in 2025.
Two weeks ago, we were waiting on the Federal Budget. Now we have it.
And now the government has followed up with the most significant property tax changes in a generation, with the negative gearing and capital gains tax, change is well-documented here.
CBA have recently updated their forecasts. Dwelling price growth is expected to slow to 3% over the year to December 2026, a step down from their previous estimate for growth to be 5%. Growth over the year to December 2027 remains unchanged at 3%.
The slowdown over the coming year primarily reflects the effect of higher mortgage rates, with the three cash rate hikes this year to date adding to borrowing costs and cooling buyer sentiment. These three hikes have subtracted 1.5 percentage points from the banks 2026 price growth forecasts.
The restriction of negative gearing for established housing and the replacement of the CGT discount with indexation and a 30% minimum tax rate will also weigh on prices according to the CBA. They estimate this policy change will subtract 0.6 percentage points from annual price growth by the end of this year and just under 1 percentage point from growth over 2027.
That's an overall figure, and some markets will perform better than others. But it's really not moving the needle, is it?
On the auction front this week... Combined capital cities clearance rate remains below 60%
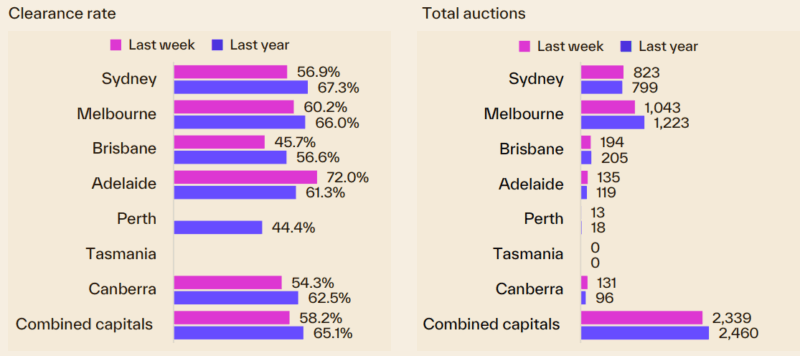
Across the combined capital cities, the preliminary auction clearance rate saw a slight increase last week, reaching 58.2%, up from the 57.5% low recorded the week prior in the wake of policy changes in the 2026-27 federal budget.
Despite this modest improvement, the rate has stayed under the 60% benchmark for six of the last eight weeks.
These figures were based on 2,339 auction listings, which represented a 19% weekly volume increase but was 4.9% below the volume recorded during the same period last year.
See Cotality's full auction report below.
This week, Cotality also reports that:
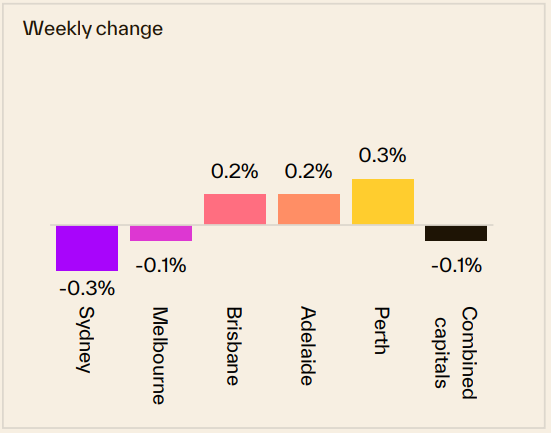
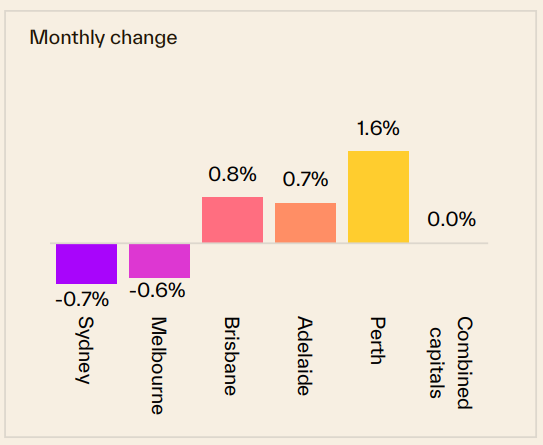
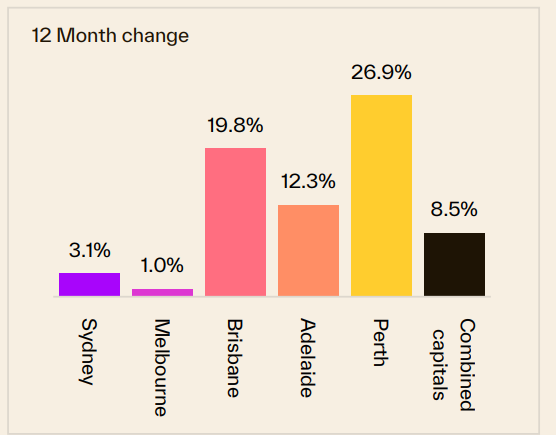
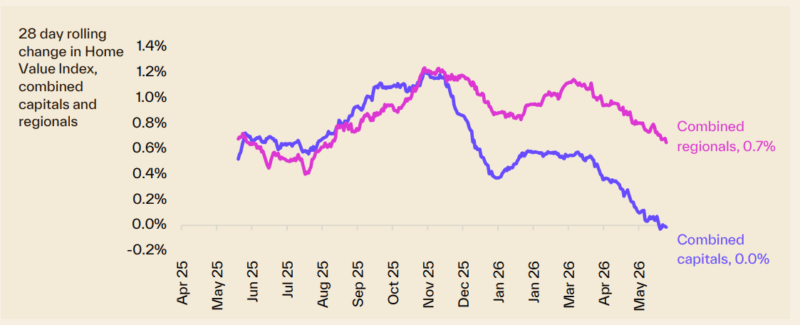
- Sydney property prices declined -0.3% over the last week, also declined -0.7% over the last month but are 3.1% higher than they were 12 months ago.
- Melbourne property prices declined -0.1% over the last week, also declined -0.6% over the last month, and increased 1% compared to 12 months ago.
- Brisbane property prices increased 0.2% over the last week, increased 0.8% over the last month and are 19.8% higher than they were 12 months ago.
Overall, Australian capital dwelling prices remained flat over the last month and are now 8.5% higher than they were 12 months ago.
Clearly, the property cycle is moving on but our markets are very fragmented.
Source: Cotality May 25th 2026
Of course, these are "overall" figures - there is not one Sydney or Melbourne or Brisbane property market.
And various segments of each market are performing differently.
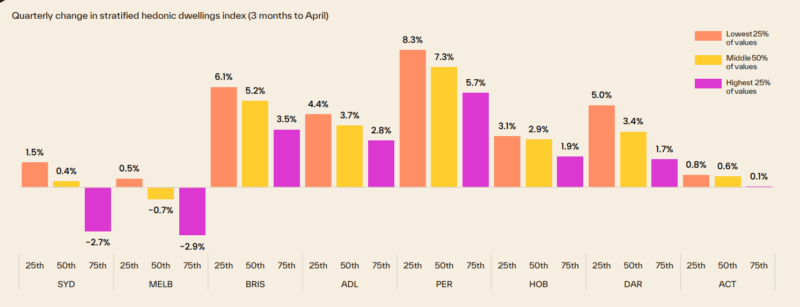
At the beginning of this cycle the upper quartile of the market lead the upswing but last year the lower quartile across every capital city recorded a stronger outcome for housing values relative to its upper quartile counterpart.
The following chart shows how various segments of each capital city market are performing differently, with median-priced properties performing well.
To help keep you up-to-date with all that's happening in property, here is my updated weekly analysis of data and charts as of 25th May 2026, provided by SQM Research, Cotality, and realestate.com.au.
Current property asking prices
Property asking prices are a useful leading indicator for housing markets - giving a good indication of what's ahead.
Here is the latest data available:
Sydney
| Property type | Price ($) | Weekly Change | Monthly Change % | Annual % change |
|---|---|---|---|---|
| All Houses | 2,128.749 | -1.749 | -0.9% | 4.4% |
| All Units | 932.108 | 1.882 | 0.2% | 9.4% |
| Combined | 1,639.531 | -0.265 | -0.7% | 5.3% |
Source: SQM Research
Melbourne
| Property type | Price ($) | Weekly Change | Monthly Change % | Annual % change |
|---|---|---|---|---|
| All Houses | 1,329.246 | -5.963 | -1.2% | 3.8% |
| All Units | 683.159 | -1.159 | 0.1% | 8.4% |
| Combined | 1,124.671 | -4.442 | -1.0% | 4.6% |
Source: SQM Research
Brisbane
| Property type | Price ($) | Weekly Change | Monthly Change % | Annual % change |
|---|---|---|---|---|
| All Houses | 1,420.005 | -5.205 | -1.1% | 15.1% |
| All Units | 890.727 | -0.337 | -0.8% | 24.5% |
| Combined | 1,286.080 | -3.974 | -1.1% | 16.5% |
Source: SQM Research
Perth
| Property type | Price ($) | Weekly Change | Monthly Change % | Annual % change |
|---|---|---|---|---|
| All Houses | 1,310.416 | -2.919 | -1.3% | 16.1% |
| All Units | 802.721 | 4.899 | -0.6% | 24.0% |
| Combined | 1,176.953 | -0.864 | -1.2 | 17.4% |
Source: SQM Research
Adelaide
| Property type | Price ($) | Weekly Change | Monthly Change % | Annual % change |
|---|---|---|---|---|
| All Houses | 1,135.346 | -13.946 | -1.8% | 11.2% |
| All Units | 627.047 | 2.853 | 4.0% | 14.4% |
| Combined | 1,043.720 | -10.918 | -1.2% | 11.5% |
Source: SQM Research
Canberra
| Property type | Price ($) | Weekly Change | Monthly Change % | Annual % change |
|---|---|---|---|---|
| All Houses | 1,244.831 | 1.919 | -1.0% | 8.1% |
| All Units | 607.419 | 1.331 | 0.6% | 1.8% |
| Combined | 1,002.696 | 1.695 | -0.7% | 6.1% |
Source: SQM Research
Darwin
| Property type | Price ($) | Weekly Change | Monthly Change % | Annual % change |
|---|---|---|---|---|
| All Houses | 841.792 | 6.008 | 2.1% | 8.3% |
| All Units | 473.914 | -3.664 | -2.7% | 16.8% |
| Combined | 698.885 | 2.203 | 0.8% | 10.4% |
Source: SQM Research
Hobart
| Property type | Price ($) | Weekly Change | Monthly Change % | Annual % change |
|---|---|---|---|---|
| All Houses | 927.643 | 8.744 | 1.8% | 10.0% |
| All Units | 535.513 | -0.113 | 0.8% | 2.6% |
| Combined | 867.595 | 7.388 | 1.7% | 9.2% |
Source: SQM Research
National
| Property type | Price ($) | Weekly Change | Monthly Change % | Annual % change |
|---|---|---|---|---|
| All Houses | 1,086.704 | 1.830 | 0.0% | 10.3% |
| All Units | 660.564 | 1.490 | 1.5% | 13.2% |
| Combined | 993.935 | 1.756 | 0.2% | 10.6% |
Source: SQM Research
Cap City Average
| Property type | Price ($) | Weekly Change | Monthly Change % | Annual % change |
|---|---|---|---|---|
| All Houses | 1,565.164 | -2.662 | -1.1% | 6.9% |
| All Units | 819.983 | 2.220 | 0.3% | 11.9% |
| Combined | 1,341.716 | -1.198 | -0.8% | 7.6% |
Source: SQM Research
The value of property asking prices as a leading indicator for housing markets is quite significant.
In fact it's more valuable than median prices which can be quite misleading.
Let's delve into why this is the case and how it impacts the real estate market.
- Early Market Sentiment Indicator: Asking prices often reflect the current sentiment of sellers in the real estate market.
If sellers are confident, they might set higher asking prices, anticipating strong demand.
Conversely, if sellers are uncertain or perceive a market downturn, they might lower their asking prices to attract buyers.
This makes asking prices a real-time indicator of market sentiment, often preceding changes in actual sales prices. - Predictive of Future Price Trends: Trends in asking prices can be predictive of where the actual property prices are headed.
For example, a consistent rise in asking prices over a period can signal an upcoming rise in transaction prices. - Impact of Economic Factors: Economic factors such as interest rates, employment rates, and broader economic health influence asking prices.
For instance, changes in the Reserve Bank of Australia's policies or shifts in the job market can quickly reflect in the asking prices, providing insights into how these factors are influencing the housing market. - Regional Variations: In a diverse market like Australia's, asking prices can also provide insights into regional disparities.
For instance, the property markets in Melbourne and Sydney might behave differently from those in Brisbane or Perth. Asking prices can give early indications of these regional trends. - Influence of Supply and Demand: Asking prices are also a response to the balance of supply and demand in the market.
In areas with limited supply and high demand, asking prices tend to be higher and vice versa.
However, it's important to note that while asking prices are a valuable indicator, they should not be used in isolation.
Other factors like actual sales prices, time on the market, auction clearance rates, and economic conditions also play crucial roles in understanding the property market dynamics.
READ MORE: The latest median property prices in Australia’s major cities
Last weekend's auction report
Combined capital cities clearance rate remains below 60%
Across the combined capital cities, the preliminary auction clearance rate saw a slight increase last week, reaching 58.2%, up from the 57.5% low recorded the week prior in the wake of policy changes in the 2026-27 federal budget.
Despite this modest improvement, the rate has stayed under the 60% benchmark for six of the last eight weeks.
These figures were based on 2,339 auction listings, which represented a 19% weekly volume increase but was 4.9% below the volume recorded during the same period last year.
- Also read:Latest Property Price Forecasts. Australian Property Market Outlook 2026: Where To Now After The Rate Rise & Budget Changes.

- Also read:Melbourne property market forecast for 2026 & 2027 | Why the opportunity is bigger than it looks

- Also read:Sydney property market forecast for 2026 and 2027 | Why the short-term softness is a long-term opportunity

- Also read:Brisbane Property Market Forecast [2026 & Beyond] – What The Olympics Decade Means for Investors.

- Also read:This week’s Australian Property Market Update – Latest Data, State by State May 26th 2026

Last week, Melbourne saw 1,043 properties taken to auction, a 13.6% increase in volume compared with the week before.
While the preliminary clearance rate of 60.2% was a slight decrease from the previous week's 61.4%, it remained above the 60% threshold for the second week in a row.
Sydney saw 823 homes go to auction last week, up by a third on the previous week when 619 auctions were held.
The preliminary clearance rate posted a solid rise to 56.9%, recovering from 49.2% the week prior (similar to lows last seen during the early stages of the pandemic).
Although the clearance rate lifted, the result remained soft, with the early clearance rate sitting below 60% in eight of the past nine weeks.
Brisbane hosted 194 auctions, a 7.2% rise on the previous week but 5.4% lower than a year ago.
The preliminary clearance rate came in at a soft 45.7%, the lowest early auction outcome for Brisbane since April 2023.
Brisbane hosted 194 auctions, a 7.2% rise on the previous week but 5.4% lower than a year ago.
The preliminary clearance rate came in at a soft 45.7%, the lowest early auction outcome for Brisbane since April 2023.
In Adelaide, auction volumes experienced an 8.8% decline from the preceding week, with 135 properties listed for sale.
The preliminary clearance rate of 72.0% remained the highest among all capital cities, despite a decrease from the 75.7% recorded during the previous week.
In Canberra, auction activity surged with 131 homes entering the market, a notable increase from the 69 auctions held the week prior.
Despite this rise in volume, the preliminary clearance rate remained steady at 54.3%, showing little change from the previous week's 54.0%.
With just over 2,750 properties currently scheduled for auction, volumes are expected to rise significantly this week.
Both Sydney and Melbourne are expected to see significant market activity, with each city having over 1,000 properties scheduled for auction.
Our rental markets
There is no evidence that the rental market is starting to loosen, with the rental vacancy rate holding at 1.6% across Australia in April, lower in the unit sector (1.5%) and higher for houses (1.7%).
Every capital city recorded a vacancy rate of 1.8% or lower, well below the national average of 2.5% over the decade.
Over the ten years before 2020, the national rental vacancy rate averaged 3.3%.
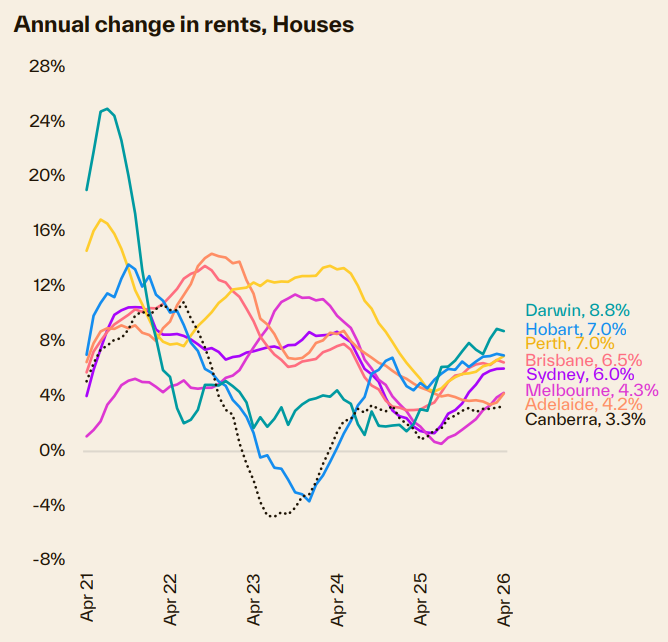
With vacancy rates remaining low, rents continue to rise, up a further 0.6% in April.
Rents were 5.7% higher over the year, the fastest annual pace of growth since October 2024, adding approximately $38 per week to the national median rent.
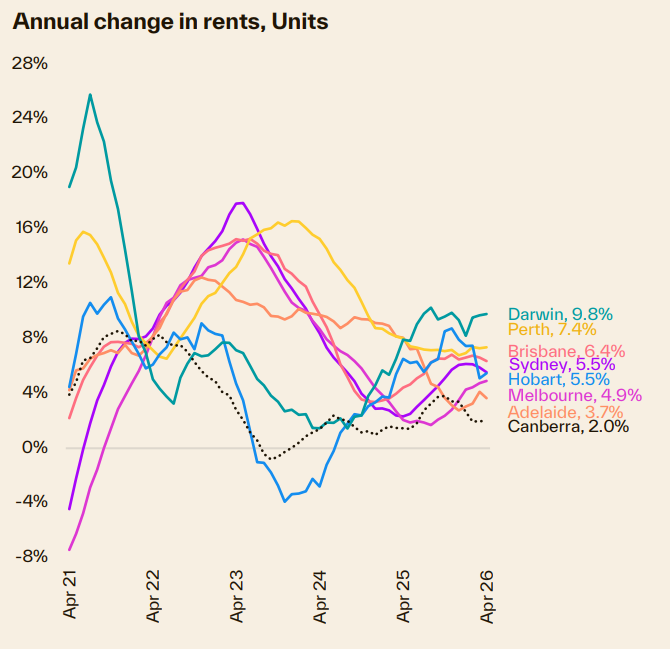
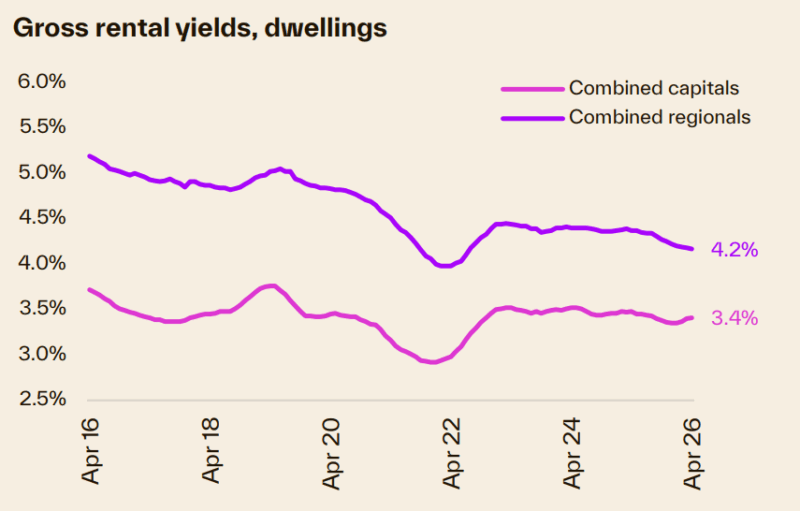
In Sydney and Melbourne, as well as Canberra’s unit market, annual rental growth is now outpacing value growth, placing some upward pressure on gross rental yields, albeit from very low levels.
Sydney
| Property Type | Rent ($) | Weekly change | Monthly change | 12 Months change |
|---|---|---|---|---|
| All Houses | $1,153.99 | -2.98 | 0.2% | 7.5% |
| All Units | $756.55 | 0.45 | 0.2% | 6.7% |
| Combined | $917.81 | -0.94 | 0.2% | 7.1% |
Source: SQM Research
Melbourne
| Property Type | Rent ($) | Weekly change | Monthly change | 12 Months change |
|---|---|---|---|---|
| All Houses | $810.47 | 0.52 | 0.2% | 6.6% |
| All Units | $599.92 | 1.07 | 0.5% | 5.8% |
| Combined | $688.34 | 0.85 | 0.4% | 6.3% |
Source: SQM Research
Brisbane
| Property Type | Rent ($) | Weekly change | Monthly change | 12 Months change |
|---|---|---|---|---|
| All Houses | $826.22 | 2.78 | 1.2% | 9.8% |
| All Units | $640.96 | 1.05 | 1.1% | 8.7% |
| Combined | $742.75 | 2.00 | 1.1% | 8.7% |
Source: SQM Research
Perth
| Property Type | Rent ($) | Weekly change | Monthly change | 12 Months change |
|---|---|---|---|---|
| All Houses | $887.08 | 1.92 | -0.3% | 7.0% |
| All Units | $680.65 | -0.65 | -0.1% | 4.4% |
| Combined | $801.95 | 0.86 | -0.2% | 6.1% |
Source: SQM Research
Adelaide
| Property Type | Rent $) | Weekly change | Monthly change | 12 Months change |
|---|---|---|---|---|
| All Houses | $681.58 | -1.59 | -1.6% | 2.5% |
| All Units | $561.11 | 1.88 | 1.5% | 9.5% |
| Combined | $641.03 | -0.41 | -0.7% | 4.6% |
Source: SQM Research
Canberra
| Property Type | Rent ($) | Weekly change | Monthly change | 12 Months change |
|---|---|---|---|---|
| All Houses | $842.01 | 0.99 | 3.3% | 3.0% |
| All Units | $593.97 | 2.03 | -0.1% | 1.5% |
| Combined | $705.48 | 1.56 | 1.7% | 2.1% |
Source: SQM Research
Darwin
| Property Type | Rent ($) | Weekly change | Monthly change | 12 Months change |
|---|---|---|---|---|
| All Houses | $815.84 | 1.15 | 0.9% | 10.5% |
| All Units | $618.86 | 21.15 | 6.9% | 18.0% |
| Combined | $699.58 | 12.95 | 4.0% | 14.4% |
Source: SQM Research
Hobart
| Property Type | Rent 9$) | Weekly change | Monthly change | 12 Months change |
|---|---|---|---|---|
| All Houses | $631.98 | -2.98 | 1.3% | 12.4% |
| All Units | $562.35 | -0.36 | -0.6% | 16.6% |
| Combined | $604.25 | -1.93 | 0.6% | 13.9% |
Source: SQM Research
National
| Property Type | Rent ($) | Weekly change | Monthly change | 12 Months change |
|---|---|---|---|---|
| All Houses | $774.00 | -3.00 | 0.5% | 7.4% |
| All Units | $603.00 | -1.00 | 0.7% | 6.4% |
| Combined | $694.87 | -2.07 | 0.6% | 7.0% |
Source: SQM Research
Cap City Average
| Property Type | Rent ($) | Weekly change | Monthly change | 12 Months change |
|---|---|---|---|---|
| All Houses | $922.00 | -1.00 | 0.2% | 7.1% |
| All Units | $681.00 | 1.00 | 0.4% | 6.6% |
| Combined | $794.07 | 0.06 | 0.3% | 6.9% |
Source: SQM Research
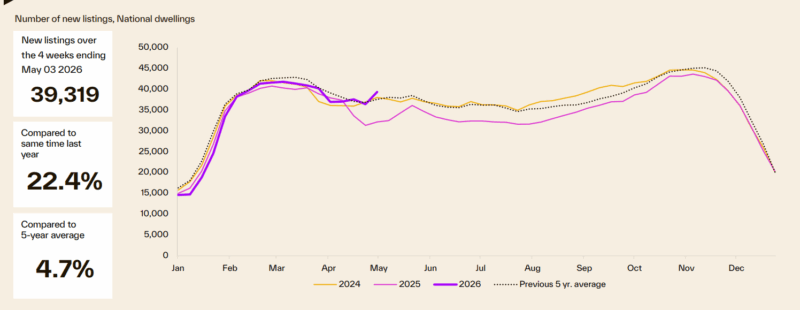
Here's how many properties are for sale at the moment
After tracking at below average levels through most of the year-to-date, the flow of new listings has picked up over the four weeks ending early May.
The rise in freshly advertised stock is likely to be at least partially seasonal, with a flurry of long weekends and public holidays influencing the trend.
Total advertised stock levels are seeing some upwards pressure as the flow of new listings rises and the rate of absorption slows due to less buyer demand.
The rise in total listings is from a low base, with overall stock levels remaining almost 10% below the five-year average in early May.
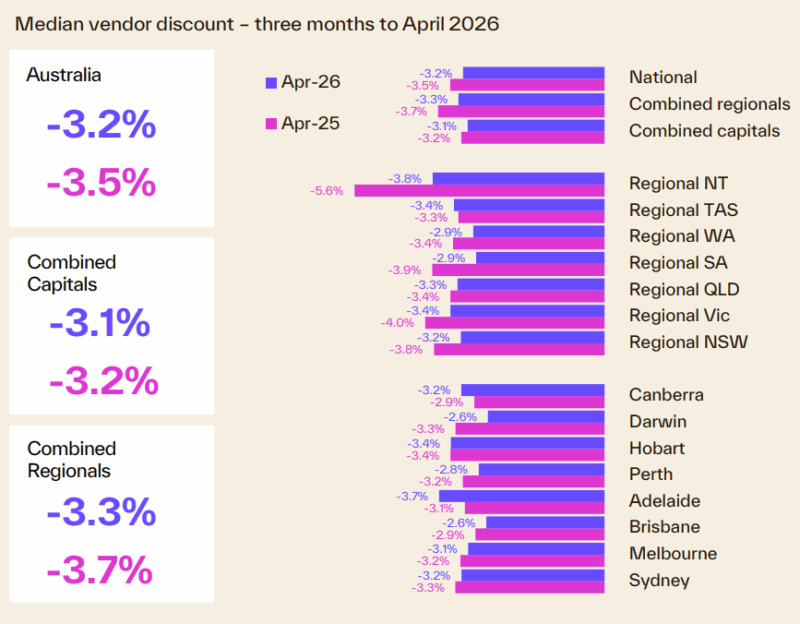
Vendor metrics
Compared to a year ago, homes are selling faster.
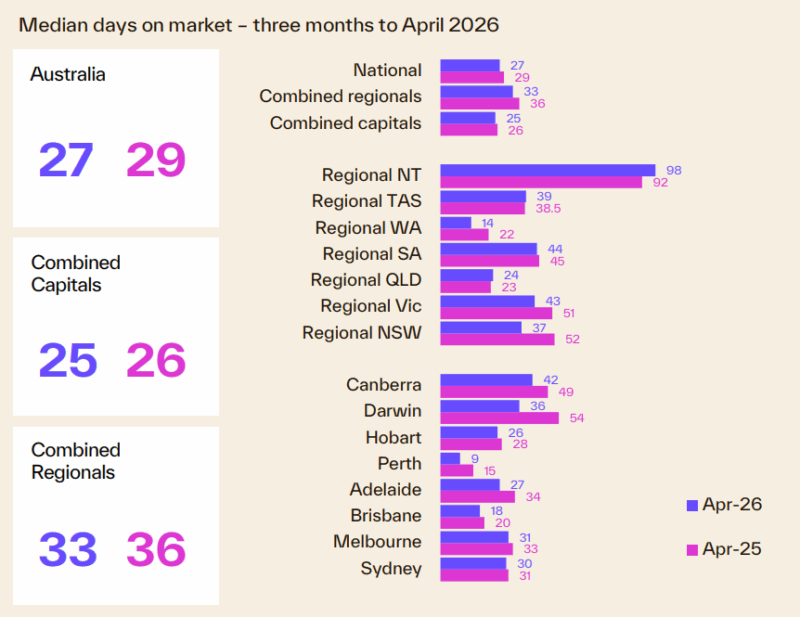
Homes are selling faster, with a median of 27 days on market over the three months ending April 2026, down from 29 days over the same period in 2025.
However, the median selling time has risen through early 2026, reflecting a slowdown in housing demand amid mounting headwinds.