Key takeaways
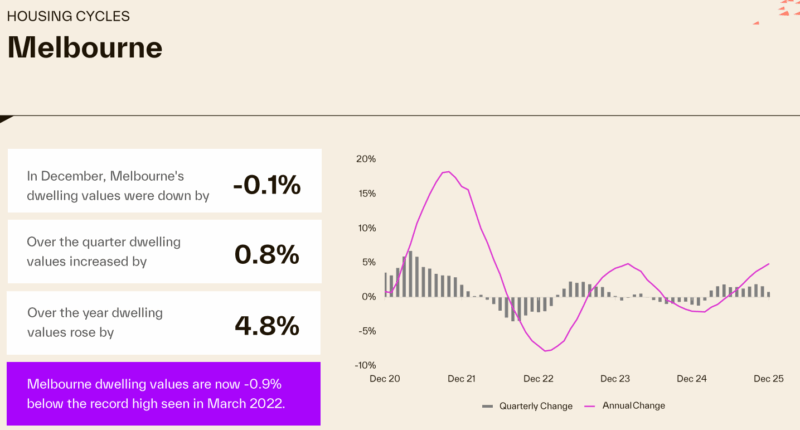
Melbourne has posted consecutive months of home price growth in the second half of 2025.
This represents a notable turnaround as Melbourne property prices fell in most months of 2024.
Melbourne remains a top long-term investment city, backed by strong population growth, infrastructure spending, and a diversified economy.
Now is a countercyclical opportunity to invest, with prices still below peak levels and buyer confidence returning as interest rates are expected to fall.
Not all suburbs will perform equally — inner- and middle-ring suburbs with owner-occupier appeal and tight supply are primed for growth.
Avoid off-the-plan and high-rise apartments, which often underperform due to oversupply, lack of scarcity, and weak demand from quality tenants.
Well-located, family-friendly houses and townhouses in gentrifying suburbs offer the best balance of capital growth and rental income.
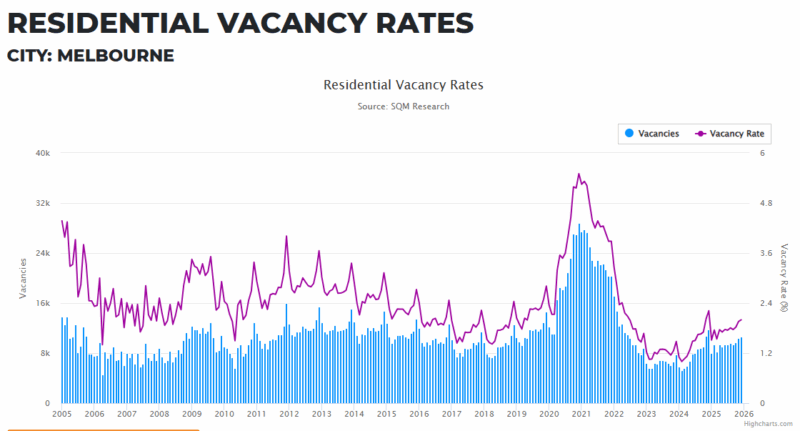
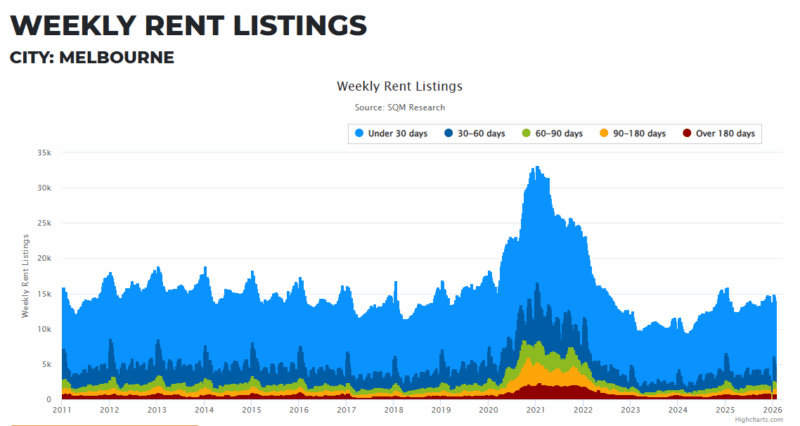
The Melbourne market is undersupplied, with building approvals at record lows, migration surging, and vacancy rates at historic lows.
Smart investors are taking a strategic, long-term view, focusing on investment-grade properties with strong fundamentals — not chasing short-term fads.
Melbourne’s property cycle is turning, and those who act now are likely to benefit as momentum builds in 2025 and beyond.
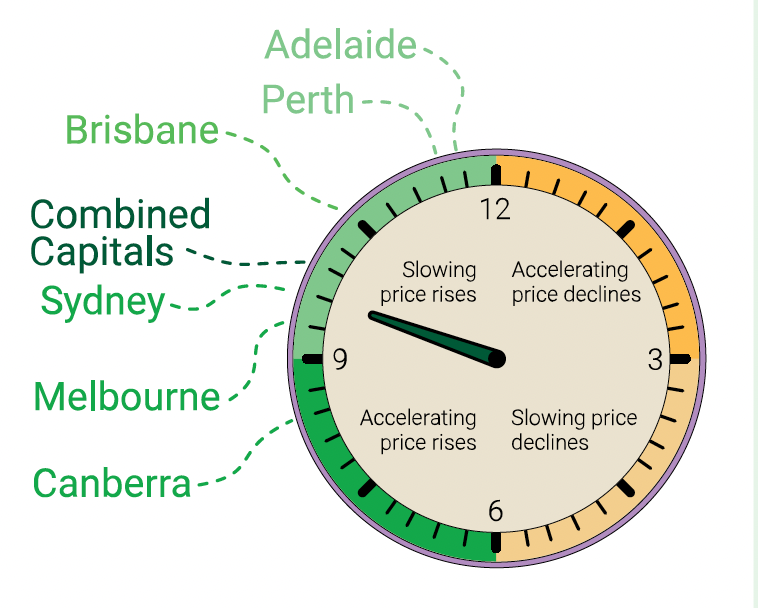
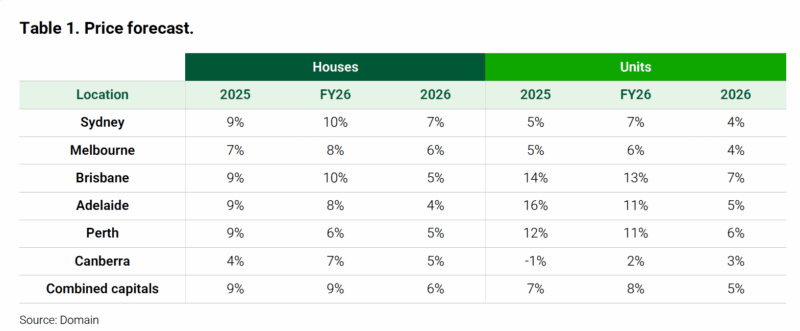
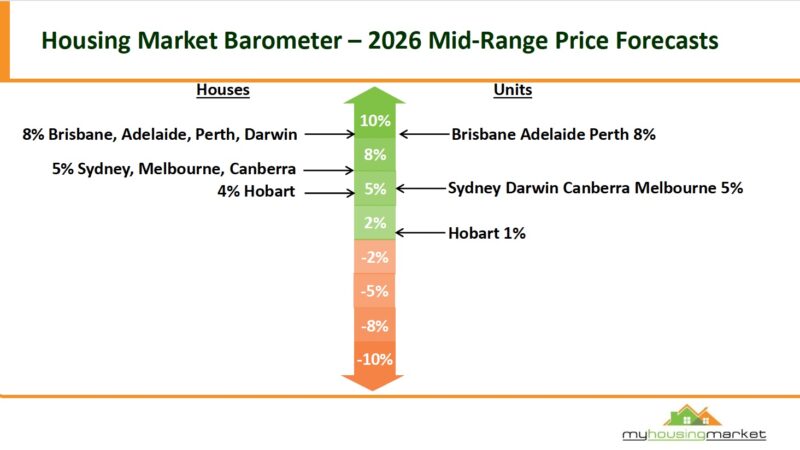
According to Domain.com.au record housing unit prices are expected across all capital cities by the end of 2026 but the year will be split into two clear phases
Phase 1: Momentum builds (January–June 2026)
Driven by:
- Expansive first-home buyer stimulus
- Lower interest rates beginning to fully flow through
- Rising household incomes
- Persistently tight housing supply
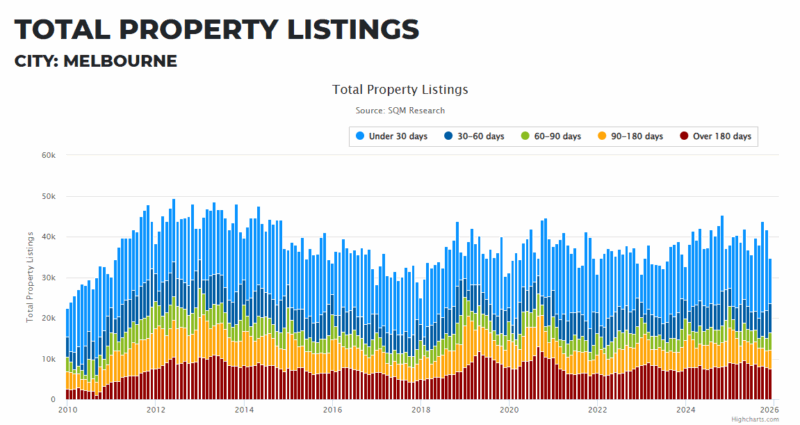
- Lower listings volumes
This phase sees stronger price growth and heightened buyer competition, especially in the affordable price brackets.
Phase 2: Affordability ceilings hit (July–December 2026)
By mid–2026, affordability once again becomes a handbrake.
This is especially true in Adelaide, Brisbane and Perth, where several years of aggressive price growth have pushed borrowing capacity to its limits.
But even as growth moderates, it remains positive, just more subdued.
This two-speed dynamic will matter enormously for investors choosing between markets and asset classes.
Domain expects Melbourne price growth to return to their pre-pandemic highs and move beyond them with median house prices finishing the year at $1.17 million (+$87k)
This is a full recovery, will driven by:
-
Improved relative affordability
-
The return of positive interstate migration
-
Strong auction clearance rates
-
Value gaps compared with Sydney and Brisbane
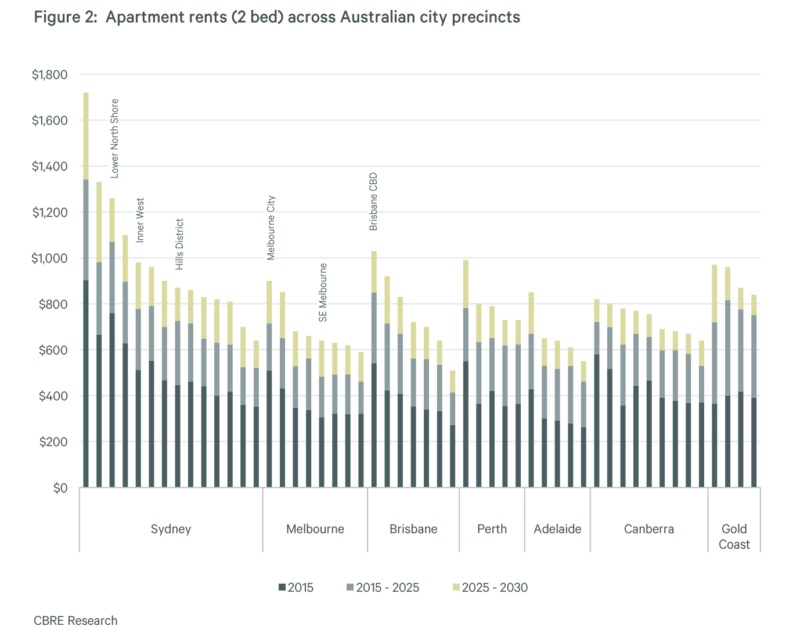
Units will rise more modestly in rent but remain popular due to affordability.
Across the combined capitals, Domain expects house rent growth is to pick up in 2026, driven by Sydney, Melbourne and Canberra – reflecting rising household incomes and still-tight rental supply.
In most capital cities, growth in unit rents are expected to rise slightly faster than house rents, reflecting continued affordability pressures and stronger demand for smaller, more affordable dwellings.
Source: Proptrack
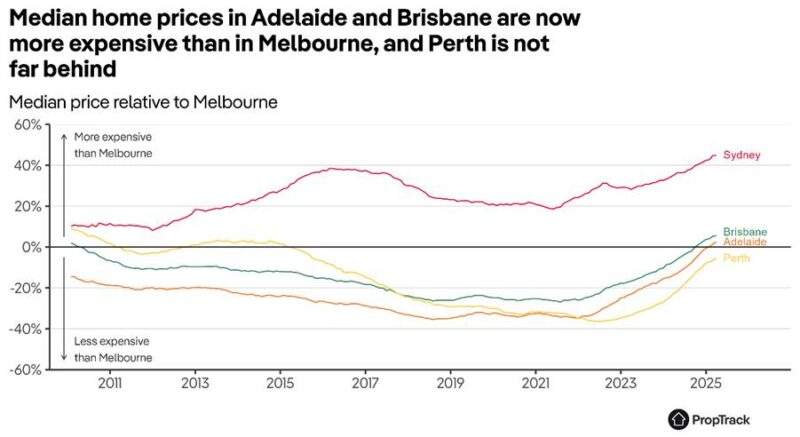
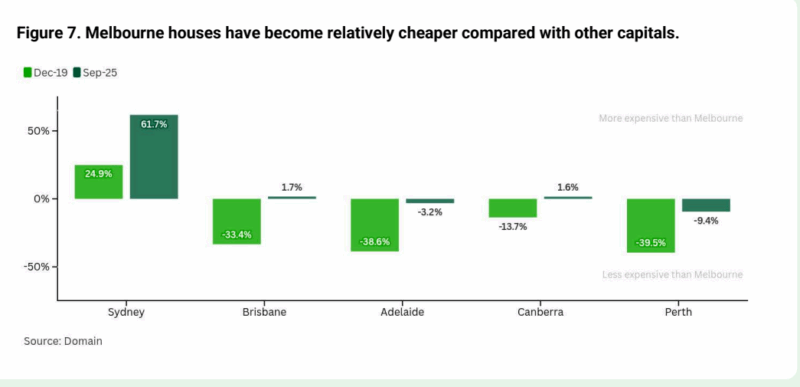
What this enormous divergence in growth has meant is that home prices in Melbourne are now low relative to other capital cities.
Source: Proptrack
This is a recent phenomenon. For most of the 2010s, Melbourne was more expensive than the smaller capitals – with the three cities around 20-40% cheaper for much of the back half of the 2010s.
In Perth, prices were briefly higher in the early 2010s on the back of the mining investment boom, which saw an enormous surge in home prices out west.

Note: Median prices are not a perfect comparison of housing costs: the types of homes in Melbourne differ from the types of homes in Adelaide Perth and Brisbane, so we are not comparing like-for-like as there are many more apartments in Melbourne.
The economic struggles of Victoria have had a direct impact on the property market. Where the economy and jobs go, the property market follows.
At the same time…
Property investors have been getting disillusioned with Melbourne
Despite the state’s housing shortage and rental crisis, the Victorian government has made a habit of using property as a cash cow to plug its budget deficits.
It has introduced a cocktail of taxes that actively disincentivise the very investors needed to increase housing supply.
And to make matters worse, landlords now face some of the country’s most rigid tenancy laws—at a time when risks and holding costs have never been higher.
Here’s a quick summary of the most impactful changes:
- Land Tax Changes (from 1 January 2024):
The land tax-free threshold for absentee owners and investors was reduced from $300,000 to $50,000, meaning many “accidental landlords” and small investors are now being hit with annual bills they never had before.
A new fixed fee of up to $975 was introduced, plus an additional 0.10% land tax hike for properties over $300,000 in value.
- Vacant Residential Land Tax (from 1 January 2025):
Originally confined to inner and middle Melbourne, this tax is now being expanded statewide. If your property is vacant for more than six months in a year, you’ll be taxed—regardless of location.
This hits holiday homes, development sites, and homes undergoing long-term renovations.
- Windfall Gains Tax (in effect from 1 July 2023):
This little-known but highly punitive tax imposes up to 50% on the uplift in land value following rezoning. This particularly hurts small developers or landowners in growth corridors who aren't even selling, just holding.
- Emergency Services Levy (ESL):
Once a modest line item on council rates, the ESL has ballooned in recent years. In effect, it’s a quasi-property tax, with property owners footing the bill for fire and emergency services via their annual rates notice.
Importantly, it’s not income-tested, nor does it reflect the property's risk profile—landlords in low-risk suburbs still pay disproportionately.
Combined, these taxes can easily add thousands, even tens of thousands of dollars to an investor’s annual holding costs.
Tenancy Reforms: Too Much, Too Fast
But the pain doesn’t end with tax policy.
In 2021, Victoria rolled out 132 amendments to the Residential Tenancies Act—many of which significantly shifted the power dynamic between landlords and tenants. And more have been added recently.
Here are some of the key changes that have left landlords feeling handcuffed
- Harder to End a Tenancy
Landlords can no longer end a tenancy without reason. The “no reason notice to vacate” was scrapped.
Now, landlords must rely on a very narrow list of prescribed grounds, such as moving in themselves or planning a full renovation. And even then, it must be genuinely provable.
- Maintenance & Modifications
Tenants can now make a wide range of modifications—like mounting TVs, installing child safety devices, or replacing curtains—without landlord consent.
For more substantial changes, landlords cannot unreasonably refuse consent, and in many cases, must foot the bill for repairs and maintenance more promptly.
- Pets in Rentals
Tenants can request to keep pets in a property, and landlords can’t say no unless they have VCAT approval.
And good luck getting that approval—it’s rarely granted unless there’s a compelling reason (such as body corporate restrictions or property damage risks).
- Disclosure & Compliance Burdens
The legislation introduced a mountain of compliance obligations: electrical, gas, and smoke alarm checks must be done every two years, with proof required.
Landlords must also provide energy-efficient heating, minimum standards for insulation, and upgraded locks—costing thousands in some cases.
- VCAT Tilted Against Landlords
VCAT (Victorian Civil and Administrative Tribunal), which adjudicates tenancy disputes, has increasingly been criticised as tenant-leaning.
Disputes over rent arrears, property damage, or eviction can take months to be heard, and even longer to enforce.
These changes have created the perfect storm for Victorian landlords. Many are selling up, particularly in regional areas or the outer suburbs where rental yields were already marginal.
But here’s the irony: the same government that’s taxing investors out of the market is relying on them to provide rental housing.
Private landlords make up over 90% of rental supply in Victoria. As they exit the market, rental vacancies shrink, and rents continue to surge.
We’re already seeing the consequences.
Melbourne’s vacancy rate is under 1% s and asking rents have jumped more than 25% year-on-year in some suburbs.
The government wants to cool rents, but their own policies are fanning the flames.
And while it hasn’t made big headlines just yet, if you read between the lines, it points to a worrying trend for renters, a turning point for policymakers, and a potential opportunity for long-term investors who know how to read the market.
The latest data from Victoria’s Residential Tenancies Bond Authority (RTBA) has quietly revealed a tipping point: more rental bonds are being refunded than lodged.

Source: abc.net.au
Now, that might sound technical, but here’s what it means in plain terms: More rental properties are being removed from the rental market than are being added.
This hasn't happened since the RTBA started recording this data over 20 years ago.
It’s not just unusual, it’s unprecedented.
In the March 2025 quarter, there were 3,398 more bond refunds than new bond lodgements in Victoria.

Source: abc.net.au

Note: Note: That means thousands of rental properties were taken off the market in just one quarter.
To put that in perspective, Victoria usually sees a positive balance, with more new tenancies starting than ending.
That’s how a growing rental market should behave, especially in a state with strong population growth, thanks to immigration and internal migration.
However, this time the numbers are reversed.
And it’s not just a single-quarter anomaly. The trend has been building for months.
Real estate agents and property managers have been reporting a growing number of landlords choosing to sell up, and now the data backs it up.
The long-term opportunity for strategic investors
While the headlines are painting a picture of doom and gloom for p, savvy long-term investors will recognise this environment for what it truly is:
A clearing-out of less committed landlords that will tighten supply, lift yields, and create opportunities for those who know what they’re doing.
Here’s why:
-
Less competition means fewer investors bidding up prices on quality assets.
-
Rising rents improve gross yields and cash flow, especially for those who bought before interest rates peaked.
-
The pipeline of new housing is drying up, thanks to high construction costs, labour shortages, and development delays.
-
Population growth is rebounding, particularly in Melbourne, which remains Australia’s fastest-growing city.
Note: In short, the fundamentals are strengthening, despite short-term noise.
Despite the current struggles, there are significant opportunities in Melbourne's property market.
Property prices are considerably below replacement costs, creating a unique buying opportunity.
In fact, this situation is similar to where Brisbane and Perth were three years ago.
Back then, both cities were experiencing a period of underperformance, but those who bought during that time have since seen significant capital growth as the markets recovered.
Even though some short-term investors have exited the market, we’re witnessing a growing number of interstate investors viewing the current market as a window of opportunity.
I’ve been around long enough to see this pattern play out before.
The best opportunities often emerge from assets that have experienced a period of underperformance, while the biggest risks often lie in those that have been running hot.
This isn’t to say that any Melbourne property is guaranteed to outperform, but it's time to remember the saying: "Be greedy when others are fearful, and fearful when others are greedy."
At Metropole Melbourne we’re finding that strategic investors and homebuyers are back actively looking to upgrade, picking the eyes out of the market.
Here's a breakdown of how properties in various price points have fared:
- High-End Properties ($2M+)
While, in general, the upper end of Melbourne's property market has struggled over the last couple of years, luxury properties in some of Melbourne's prestigious suburbs, such as Toorak, Balwyn, Brighton and Camberwell, have shown resilience and, in some cases, significant growth.
For instance, 25 Melbourne suburbs experienced median house price increases exceeding $100,000 in 2024, with Deepdene recording a remarkable $602,000 (20%) rise.
Factors contributing to this performance include limited supply, strong demand from affluent buyers, and the desirability of established, blue-chip locations. - Mid-Tier Properties ($800K–$1.5M)
The mid-tier market, encompassing many family homes in Melbourne's middle-ring suburbs, has faced challenges.
After peaking in early 2022, prices in this segment declined by approximately 7.9% through to January 2023 .
While there was a modest recovery in early 2023, growth remained sluggish throughout 2024, with annual changes hovering around -1.2%.
Contributing factors include increased interest rates, higher property taxes, and a cautious buyer sentiment.
But this segment of the market has picked up in the last few months due to increased buyer confidence and demand at the time when there is limited supply - Affordable Properties (Under $800K)
The affordable segment, often comprising apartments and entry-level houses in outer suburbs, has experienced mixed results.
While some areas saw price declines due to oversupply and reduced investor activity, others benefited from first-home buyer incentives and infrastructure developments.
More recently, apartment prices in Melbourne have been increasing, as have the value of villa units in Melbourne’s inner suburbs. At the same time, house prices in outer suburbs are increasing as investors and first homebuyers are getting into the market before the expected surge of activity early in 2026 when the first home bueyer grants kick in.
Back then, both cities had experienced a period of underperformance, but those who bought then have since enjoyed significant capital growth as these markets recovered.
This suggests that as interest rates continue to decline, and when Melbourne regains its Mojo, the Melbourne housing market is likely to outperform other capital cities, driven by strong population growth, economic recovery, and relative affordability.
Despite confidence returning as interest rates fall further and more buyers return to the Melbourne property market, affordability will still be an issue for many potential buyers, and buyers will only be able to pay up to the limit of what they can afford, so I would only invest in locations where wages are increasing faster than average and residents have multiple streams of income, not just wages.
This means it will be important to invest in Melbourne's more affluent inner-ring and gentrifying middle-ring suburbs, which are expected to outperform the cheaper suburbs, where residents will still struggle to afford a home.
What is the Victorian government going to do about the situation?
Recently the Victorian government has stepped up to encourage more housing supply with two key policies designed to give developers a push to build.
Firstly, from October 21, 2024, there has been be a 12-month reduction in stamp duty for off-the-plan units, townhouses, and apartments - regardless of the price tag.
This should make these properties more attractive to both developers and buyers.
Secondly, to boost density around public transport, the government has identified 50 new activity centres where it will streamline the planning process for multi-storey residential developments.
The goal is to fast-track much-needed housing in these areas.
Now, when we look at the numbers from the ABS, things are a bit concerning.
Currently, there are about 63,700 dwellings under construction across Victoria—this is 11% fewer than what we observed a year ago, and most of that decline is attributed to the slowdown in high-density apartment projects.
While detached houses under construction are still above the 10-year average, they've fallen by 19% over the past year.
If you look at the bigger picture, 2024 is likely to see the lowest level of new housing completions in Victoria in the last decade, and new housing starts are continuing to decline.
The approval pipeline isn’t looking great either—approved dwellings in Victoria are sitting 14% below the 10-year average. This all points to a further tightening supply in the near future.
On the flip side, demand is booming.
Victoria’s population is growing at near-record levels, increasing by over 183,000 people in the 12 months to March 2024, which is the biggest jump of any state in Australia.
A big driver of this has been overseas migration, and for the first time since 2020, Victoria has also managed to attract people moving from other states.
In terms of housing finance, things are also picking up. Investors, in particular, are making their presence felt, now accounting for 32% of total housing finance in Victoria, up from 27% just three years ago.
With rental growth continuing strong and the housing shortage becoming more acute, I expect investors to take an even larger share of housing loans moving forward, as affordability challenges push owner-occupiers out of the market.
It’s an interesting dynamic—demand is as strong as ever, but the supply side is struggling to keep pace.
This imbalance will continue to put upward pressure on prices and rents in the months ahead.
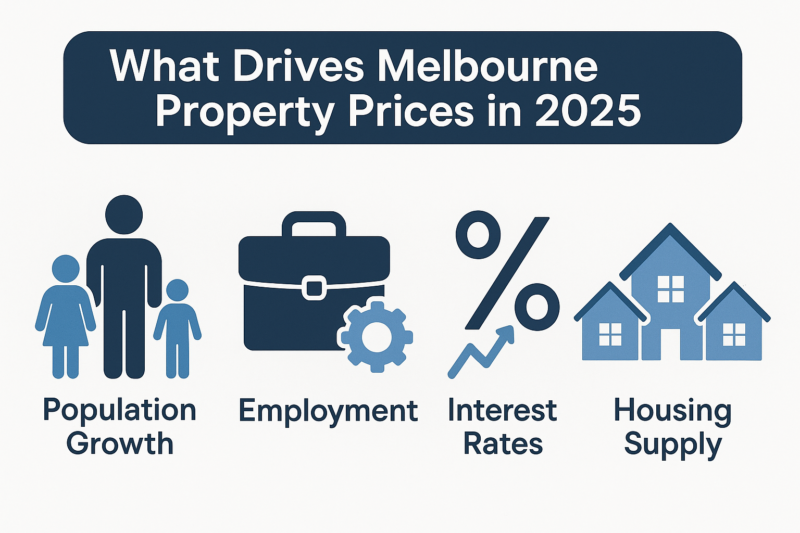
The best performing properties in Melbourne in 2025
Family-Friendly Homes
Price growth of established houses in Melbourne’s gentrifying suburbs will be underpinned by the ongoing trend of families seeking spacious homes with proximity to amenities, schools, parks, and transport links that continue to fuel demand for houses.
With Melbourne’s population growth back on the rise due to both domestic and international migration, family-oriented homes in established suburbs will maintain strong demand.
3-4 bedroom houses with larger land components, ideally with some potential for renovation or minor upgrades, will attract families and grow in value.
Middle ring eastern suburbs such as Mount Waverley, Glen Waverley, Mitcham, Blackburn, and Ringwood are enjoying gentrification and infrastructure upgrades, and remain more affordable than inner suburbs, and therefore experiencing strong owner occupier demand to push up prices as well as rental demand.
In the west, Essendon and Moonee Ponds are popular suburbs among families and professionals alike and provide easy access to the CBD, reputable schools, and ample lifestyle amenities.
In the south east, Bentleigh and bayside suburbs like Cheltenham, Mentone and Parkdale are experiencing strong demand as they go through gentrification.
Townhouses and Villa Units
Townhouses are becoming an increasingly popular form of accommodation for young families, offering a compromise between apartments and houses.
With affordability pressures still high, many buyers and renters prefer townhouses as a more cost-effective option compared to standalone houses.
The trend toward higher-density living in inner and middle-ring suburbs will continue to make townhouses an appealing choice for investors.
Melbourne’s gentrifying, middle ring suburbs are great locations in which to buy townhouses, including Bentleigh and McKinnon in the south east, Reservoir and Preston in the north and Mount Waverley and Glen Waverley in the east.
Similarly, villa units in Melbourne’s inner suburbs are excellent investments, as they are popular among young families and older couples.
Established apartments in Premium Locations
Well-located "family friendly" two-bedroom apartments are seeing renewed interest.
This is particularly true in areas with strong rental demand, especially from young professionals, students, and downsizers.
Look for properties in low-rise, boutique developments that offer unique features and modern finishes, spacious layouts, and access to amenities such as cafes, restaurants, public transport, and green spaces.
Where to avoid buying in Victoria.
While I see many suburbs poised for strong growth over the next couple of years, there are some areas I would avoid as they carry risks of poor capital growth, low rental growth, and economic instability.
- Outer suburbs. While Melbourne's outer suburbs offer cheaper properties, they often lack the infrastructure and amenities needed to attract future home buyers (who will push up the value of your property) and long-term tenants.
While many property marketers discuss significant growth in areas like Melton, Bacchus Marsh, and Werribee South, this actually reflects population growth and abundant new development, but not necessarily capital growth. With limited infrastructure and a lack of local transport, schools, and healthcare services, these locations are likely to underperform in the long term. - Regional Victoria.There is no doubt that some large Victorian regional centres will continue to grow strongly; however, with a majority of population growth and economic growth occurring in the capital city of Melbourne, I would advise against investing in regional Victoria.
- High crime rate areas. When considering property investment in Melbourne, it's crucial to assess not only the potential for capital growth and rental yield but also the safety and crime rates of the area. High crime rates can impact tenant demand, property values, and overall investment returns.
You can check the latest prime rate statistics around Victoria at this government website.
Interestingly, the Melbourne CBD, South Melbourne, Docklands, and the inner suburbs of Fitzroy and Collingwood have relatively high crime rates. And not surprisingly, some of the low socio-economic areas, such as Broadmeadows, Campbellfield, and Dandenong, are also challenged by high crime rates
What's happening in the Melbourne Property Market?
| Population at 30 September 2024 ('000) | Change over previous year ('000) | Change over previous year (%) | |
|---|---|---|---|
| New South Wales | 8511.2 | 120.8 | 1.4 |
| Victoria | 7013.0 | 146.7 | 2.1 |
| Queensland | 5608.7 | 111.9 | 2.0 |
| South Australia | 1882.7 | 21.5 | 1.2 |
| Western Australia | 2981.8 | 72.6 | 2.5 |
| Tasmania | 576.0 | 1.9 | 0.3 |
| Northern Territory | 255.6 | 1.7 | 0.7 |
| Australian Capital Territory | 475.6 | 6.9 | 1.5 |
| Australia (a) | 27309.4 | 484.0 | 1.8 |
Source: ABS data


